/usr4/users/aorr/mcg-6-30-15
(03.09.3; 11.17.1; 11.17.4; 13.25.3)
A. Orr: aorr@astro.estec.esa.nl
Quasi-simultaneous observations of 3C 273 by BeppoSAX and ASCA
Abstract
We report the results of quasi-simultaneous observations of the bright quasar 3C 273 using the BeppoSAX Low-Energy Concentrator Spectrometer (LECS) and the ASCA Solid-State Imaging Spectrometer (SIS). These observations are part of an intercalibration programme and demonstrate good agreement between both instruments in the common energy range 0.5-10 keV. In particular, the absorption feature discovered by BeppoSAX/LECS at 0.5 keV is consistently seen by ASCA/SIS. We present the most accurate measurement yet of the spectral shape of this absorption feature and provide constraints on its physical interpretation. A self-consistent warm absorber model in photoionization equilibrium only gives an adequate spectral fit if a very high velocity inflow is allowed for the warm absorber (v0.36 c). The ionization parameter and the column density of the warm absorber are then 1 and 1.3 cm-2, respectively. If the differences in best-fit neutral absorption column density between the LECS and each SIS are taken as estimates of the systematic spectral uncertainties, then these are 0.8 and 2.0 cm-2 (at 90% confidence) for SIS0 and SIS1, respectively.
keywords:
Instrumentation: miscellaneous – Quasars: individual: 3C 273 – Quasars: absorption lines – X-rays: general1 Introduction
3C 273 is a high luminosity radio-loud quasar at a redshift of z=0.158. Previous X-ray observations of 3C 273 using HEAO 1 A2, EXOSAT and Ginga showed a featureless power-law continuum with a photon index, , that varies between 1.3 and 1.6 (Worrall et al. 1979; Turner et al. 1990, 1991; Williams et al. 1992). The 2–10 keV luminosity varies in the range 0.7–2.0 erg s-1(Turner et al. 1990). EXOSAT observations revealed a soft excess below 1 keV (Courvoisier et al. 1987), which has been confirmed by subsequent ROSAT observations (Staubert 1992; Staubert et al. 1992). This soft excess is also visible in an ASCA Performance Verification observation of 3C 273, but at a reduced level compared to that observed by ROSAT (Yaqoob et al. 1994). Both Ginga (Williams et al. 1992) and ASCA observations (Cappi & Matsuoka 1997) indicate the presence of a weak narrow Fe K emission line (equivalent width, EW, eV) during low X-ray flux states and there is recent evidence for a strong broad Fe K emission line (EW 100 eV, Yaqoob et al. in preparation). The BeppoSAX Science Verification Phase (SVP) observation also took place during a low state. The SVP spectrum can be represented by a single power-law model between 1 and 200 keV with a weak narrow Fe emission feature at a rest frame energy of 6.4 keV with an equivalent width EW of 30 eV (Grandi et al. 1997). Below 1 keV the BeppoSAX LECS detected a soft excess and led to the discovery of an absorption feature in this source at 0.5 keV (Grandi et al. 1997, Fossati & Haardt 1997).
3C 273 was observed quasi-simultaneously by BeppoSAX, ASCA, and the Rossi X-ray Timing Explorer (XTE) as part of a dedicated program to cross-calibrate the instruments on the three satellites. 3C 273 was chosen since it is visible at the lowest and highest energies observable by the above satellites and because of the supposed simplicity of the underlying spectrum. Here we describe one aspect of the program, the intercalibration of the BeppoSAX LECS and ASCA SIS instruments. Both instruments detect similar low-energy spectral structure from 3C 273, indicating a good relative calibration.
2 The instruments
The payload of the Italian-Dutch satellite BeppoSAX includes four identical X-ray mirrors with imaging gas scintillation proportional counters (GSPCs) as detectors (Boella et al. 1997a). Amongst these the LECS is sensitive from 0.1–10 keV (Parmar et al. 1997). The other detectors operate in the energy range 1.3–10 keV and are referred to as the Medium-Energy Concentrator Spectrometer (MECS; Boella et al. 1997b).
The LECS achieves an extended low-energy response by utilizing a driftless gas cell and an ultra-thin entrance window. The energy resolution of the LECS is 32% full width at half-maximum at 0.28 keV, 16% at 1.5 keV and 8.8% at 6 keV. For an on-axis source, the effective area of the LECS peaks at 50 cm2 at an energy of 1.5 keV and the area is 11 cm2 directly below the carbon edge at 0.28 keV. A study of a large sample of LECS AGN spectra below 2 keV (Orr et al. 1998) has shown that the maximum amplitude of fit residuals due to instrumental effects is 10% of the folded model count rate in the energy ranges 0.1–0.4 keV and 0.5–2 keV. Between 0.4–0.5 keV, where the effective area is very low, effects up to a 15% level are present with the current LECS response (LEMAT 3.5.3).
ASCA has four identical X-ray telescopes. The corresponding focal plane detectors are two Solid-state Imaging Spectrometers (SIS) and two Gas Imaging Spectrometers (GIS) (Tanaka et al. 1994; Serlemitsos et al. 1995). The SIS is sensitive in the energy range 0.4–10 keV. Originally, the SIS energy resolution was 5% at 1.5 keV and 2% at 6 keV, but due to radiation damage it was reduced to 3.6% and 3.9% at 6 keV for SIS0 and SIS1, respectively, at the time of the observation (see Dotani et al. 1997).
The low-energy responses of the SIS and the LECS are difficult to calibrate in-flight. The Crab Nebula, which is a favored calibration source in X-ray astronomy, is not detected by the LECS 0.5 keV due to interstellar absorption, and observation of such a bright source is not possible with the SIS because of multiple events occurring in single pixels. For this reason 3C 273 was used to cross-calibrate the SIS and GIS above 3 keV (Dotani et al. 1996). The GIS can observe the Crab, so this source was used to calibrate the overall response of the GIS detector and to verify the effective area of the X-ray telescope.
3 Observations and data reduction
3C 273 was observed by BeppoSAX between 1996 July 18–21 during the SVP and by ASCA between 1996 July 16–18 (Table 1). Good LECS data were selected from intervals when the minimum elevation angle above the Earth’s limb was 4∘ and when the instrument parameters were nominal. Due to an instrument anomaly, LECS data between 1996 July 19 11:23 and July 20 13:06 UTC were lost. Since the LECS was only operated during satellite night-time, this gave a total on-source exposure of 11.5 ks. LECS data were processed using SAXLEDAS 1.7.0 (Lammers 1997).
A spectrum was extracted at the source centroid using the standard extraction radius of 8′. Background subtraction was performed using standard blank field exposures, but is not critical for such a bright source. The 3C 273 count rate above background is s-1 and the background in the 0.1–10 keV range is 4% of the total count rate. 3C 273 was located 2′ off-axis in the LECS FOV. This position is close to a strongback rib, which reduces the overall source count rate. Since the LECS response is dependent on both source position within the FOV and extraction radius, the appropriate matrix was created using LEMAT 3.5.3.
| Satellite | Inst. | Start time | End time | Exp. |
|---|---|---|---|---|
| (1996) (UTC) | (UTC) | (ks) | ||
| BeppoSAX | LECS | July 18 00:41 | July 21 08:35 | 11.6 |
| ASCA | SIS0 | July 16 19:52 | July 17 14:54 | 42.0 |
| SIS1 | July 16 19.52 | July 18 00:57 | 41.9 |
The two SIS instruments observed 3C 273 on the default chips, in 1-CCD FAINT mode. The data were cleaned by excluding South Atlantic Anomaly passages (SAA), applying the standard algorithm for removing hot and flickering pixels, requiring an Earth elevation angle greater than and a magnetic cut-off rigidity greater than 7 GeV c-1. Data were also rejected within 50 s of the satellite exiting the SAA and within 50 s of day/night transitions. Standard upper limits of 100 were also applied to the ‘S0_PIXL1’ and ‘S1_PIXL3’ parameters in order to eliminate contamination due to light leaks in the SIS.
On-source data were extracted using circles of radius 4′ centered on the source. Background spectra with sufficient signal-to-noise were extracted from off-source regions of the chips. The count rates in SIS0 and SIS1 are 2.36 and 1.88 s-1, respectively, with the background constituting 4% of the total counts in the 0.5–10 keV band. The response matrices for the SIS were generated using sisrmg 1.1, with the CTI tables issued on 1997 March 11. The XRT responses were generated with ascarf 2.64, with both of the empirical energy-dependent effective area modification factors implemented. In the following, all spectra are re-binned to have 20 counts in each bin allowing the use of the statistic. Uncertainties are quoted as 90% confidence intervals for one parameter of interest.
4 Spectral fits
Fits were performed on the SIS and LECS data in different energy bands in order to examine whether a single absorbed power-law provides an adequate description of the entire spectrum. A model without an Fe K emission line was used in order to have a simple parameterization. Furthermore, the presence of the line does not affect the conclusions of the present analysis. The photoelectric absorption coefficients of Morrison & McCammon (1983) and the abundances of Anders & Grevesse (1989) were used throughout the fitting.
4.1 SIS-only fits
In the 2–10 keV energy range independent fits to the SIS0 and SIS1 spectra using a simple power-law with neutral absorption fixed at the galactic value, cm-2 (Stark et al. 1992), give photon indices and of 1.59. The fit statistics are better for SIS1 than for SIS0 ( = 251.5 for 208 degrees of freedom, dof; = 186.6 for 199 dof). The indices agree well with the values obtained for the same model using the near-simultaneous XTE/PCA and BeppoSAX/MECS observations. (2–10 keV) = 1.61 (Yaqoob et al. in preparation) and (1.5–10 keV) = 1.57 (Grandi et al. 1997), using the slightly lower value of cm-2 from Savage et al. (1993).
When the low energy data down to 0.5 keV are included and excess neutral absorption is allowed, the simple power-law fits result in basically the same slopes and quality of fit ((0.5–10 keV) = 1.63). However, excess of (3.3) cm-2 and (5.5) cm-2 are required for SIS0 and SIS1, respectively.
4.2 LECS-only fits
A 2–10 keV power-law fit with galactic absorption gives a marginally flatter slope in the LECS than measured by the SIS, (2–10 keV) = ( = 140.2 for 135 dof). Including the data at lower energies (0.5–10 keV) and allowing for excess neutral absorption, , also gives a good fit ( of 232.2 for 242 dof). The spectral slope is similar to above, (0.5–10 keV), and the excess column density increases to a value compatible with that found by the SIS in this energy range. However, the uncertainty on excess absorption is large, cm-2. When data down to 0.1 keV is included, and using only galactic neutral absorption, one obtains an unacceptable fit with significant residuals below 0.8 keV and a of 313.5 for 263 dof. If the total absorption is left as a free parameter it decreases to cm-2 and the fit statistics improve by = 52.3, as the fit tries to account for the increase in flux 0.4 keV.
In summary, across their common energy range (0.5–10 keV) both the LECS and the SIS data show that the spectrum of 3C 273 deviates from a single power-law at lower energies and requires excess neutral absorption. In this energy range the best-fit values of and are closely coupled. The simple power-law model with galactic and excess neutral absorption and provides a satisfactory, if not physical, description of both the LECS and the ASCA data between 0.5–10 keV. However, it becomes unacceptable for fits extending below 0.5 keV. Such behavior is suggestive of spectral structure. In fact, structured residuals at 0.5–0.6 keV have been reported by several workers in the case of SIS observations of 3C 273 (Yaqoob et al. 1994) and other AGN, leading to speculation about systematic uncertainty of the SIS response (Dotani et al. 1996; Cappi & Matsuoka 1997). Moreover, a previous analysis of the LECS SVP data (Grandi et al. 1997) revealed for the first time in this source the presence of an absorption feature at 0.5 keV.
4.3 Estimates of the relative SIS/LECS systematic deviation
In order to verify whether similar low energy structure is present in both LECS and SIS data for 3C 273 simultaneous SIS0/LECS and SIS1/LECS spectral fits were performed in the energy range 0.6–4 keV. It is assumed that any relative systematic deviation between the SIS and the LECS in the range 0.6–4 keV can be represented by an effective column density. Data below 0.6 keV were not used because the SIS detection efficiency is poorly understood here, probably due to the effects of an O edge at 0.53 keV (Dotani et al. 1996). By restricting the energy range to below 4 keV relatively more statistical weight is given to the low energy bins which are affected by the spectral complexity.
The model combines a normalization factor, a power-law and three neutral absorption components: one fixed at the galactic value of cm-2, a second column density common to both LECS/SIS0 or LECS/SIS1 and a third component which is zero for the LECS and allowed to vary for the SIS. This third component characterizes the systematic deviation relative to the LECS. The choice of the model is based on the results of Sects. 4.1 and 4.2.
| SIS | Norm | (dof) | |||
|---|---|---|---|---|---|
| 0 | 4.71.1 | 319.1 (282) | |||
| 1 | 284.1 (282) |
The model provides a good fit to the data. The result (Table 2) is that the relative SIS/LECS systematic deviation in the common energy range 0.6–4 keV is consistent with zero. The average data-to-model ratio for the fits in Table 2 and for either SIS0 or SIS1 has a standard deviation of 6% (rms). The corresponding standard deviation for the LECS is 23%. When computed for the SIS in the energy range 0.6–1 keV, the standard deviation is even smaller (4%), whereas the LECS standard deviation decreases to 19%.
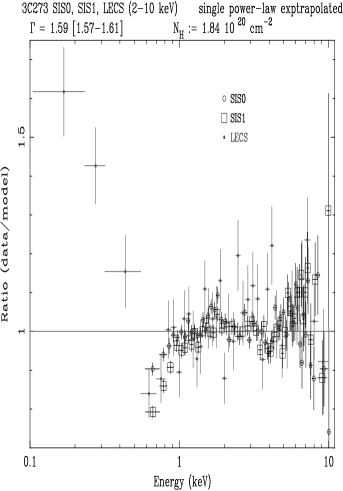
These results remain valid even with a more complex fit model. For instance, a model was considered with the same components as the previous one, but extending down to 0.5 keV and including an absorption edge at E0.6 keV. The justification for such a model is given in the following section. Figure 1 illustrates the good agreement between LECS and SIS at low energies. Here SIS0 and SIS1 data from 2–10 keV and BeppoSAX/LECS data between 2–4 keV are fit with a single power-law and neutral absorption fixed at cm-2. The resulting model ( with a 589.5.5 for 545 dof) is extrapolated to lower energies.
4.4 Fitting the absorption feature: 0.1-10 keV fits
| n Model | (dof) |
|---|---|
| 1 PL (power-law) | 1144.2 (775) |
| 2 PL + PL | 874.1 (773) |
| 3 (PL + PL) part. CF abs. | 874.1 (771) |
| 4 BPL () | 1116.7 (774) |
| 5 BPL | 880.3 (773) |
| 6 PL edge | 881.7 (773) |
| 7 (PL + PL) edge | 850.0 (771) |
| 8 (PL + PL) notch | 858.6 (770) |
| 9 (PL + PL) inv. Gauss. | 859.4 (770) |
| 10 BPL edge | 850.7 (771) |
| 11 BPL notch | 865.6 (770) |
| 12 (BB + PL) | 878.9 (773) |
| 13 (BB + PL) edge | 851.9 (771) |
| 14 (BB + PL) notch | 861.3 (770) |
| n | Eedge | ||||
|---|---|---|---|---|---|
| Tsoft eV | (keV) | (cm-2) | |||
| 7 | |||||
| 10 | |||||
| 13 |
The results of Sect. 4.2 reveal that complex spectral structure is present below 1 keV. Further fits have been performed between 0.1–10 keV (LECS) and 0.5–10 keV (SIS0, SIS1) in order to measure the spectral shape of this structure. The results of various simultaneous LECS/SIS0/SIS1 fits are listed in Table 3. The fit models include normalization factors for each instrument. The factors were left as free parameters, but remained very stable from one model to the next, the average values with respect to the LECS being: SIS0/LECS = 1.07, SIS1/LECS = 1.04 with a typical uncertainty of .
A single power-law model is unacceptable. The improvement in fit statistics brought by adding a “soft excess” component is significant at 99.9% confidence using the F-statistic (see models 2, 5 and 12 versus model 1), with the two power-law model (2) giving slightly better results than the broken power-law or the blackbody plus power-law model. However, the fits remain unacceptable, with large residuals below 1 keV. The addition of a narrow Fe K emission line at 6.4 keV (EW 24 eV) brings no significant improvement to the quality of fit (95% confidence level with the F-statistic) and is therefore omitted in the present study. Furthermore, the presence of a broad Fe K emission component does not affect the results of the present study.
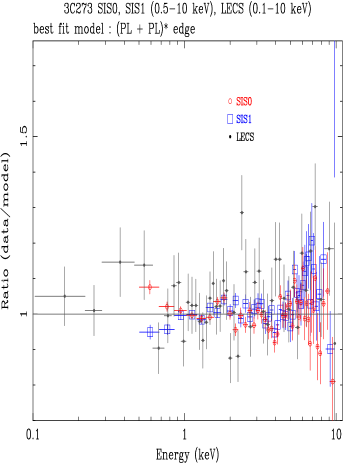
Models including an absorption feature do bring significant improvement to the fit statistics. The “best fit” is obtained by including an absorption feature in the form of an edge (models 7, 10 and 13 of Table 3, see Fig. 2). It is not possible to discriminate between the soft continuum components (i.e. two power-laws, a broken power-law or by a blackbody and power-law) when an absorption edge is included, since the fits statistics are very similar. The best fit parameters are given in Table 4. In broken power-law models the energy of the break, when left as a free parameter (models 5, 10 and 11) tends to values close to that of the absorption feature, thereby indicating that such a continuum contributes in part to the fit of the absorption feature.
The observed 2–10 keV flux with model 7 and the LECS normalization is ergs s-1 cm-2. The 0.15–2 keV unabsorbed fluxes in the soft component are 1.0 and ergs s-1 cm-2 with models 7 and 13 respectively. These soft excess values are somewhat lower than those measured by ROSAT/PSPC (Walter et al. 1994) in the same spectral range during the ROSAT all sky survey (RASS), i.e. 4.7 and ergs s-1 cm-2 with two power-laws and a blackbody plus power-law fit respectively. On the other hand, the flux at 2 keV observed by BeppoSAX/ASCA, photons keV-1 s-1 cm-2, is comparable to the RASS flux, photons keV-1 s-1 cm-2. Leach et al. (1995) have shown that the 1.5–2.4 keV and 0.1–0.3 keV count rates of 3C 273 are both highly variable but uncorrelated.
Slightly worse fits are obtained when the absorption feature is modeled by a notch or by a Gaussian line (models 8, 9, 11 and 14). The Gaussian absorption line (model 9) has a line energy of E keV, a line width eV and EW = eV (the uncertainty intervals for Erest and EW are calculated with fixed at 114 eV). The rest frame energy of the line is compatible with resonant absorption from Oviii Ly at E keV. However, significant structure remains in the fit residuals at the energy of the absorption feature when it is modeled by a Gaussian line or a notch.
4.5 Fitting the absorption feature: photoionization models
To understand the physics of the absorption feature, we have calculated a two-dimensional grid of photoionization models using the code CLOUDY (Ferland 1996). The two grid parameters are U, the dimensionless ratio of hydrogen ionizing photon density to total hydrogen density and NW, the total hydrogen column density of of the ionized material in units of cm-2. NW determines the amplitude of a given absorption feature, whereas the parameter U dictates the abundances of different ions and therefore also the presence of absorption features at a given energy.
The following assumptions have been made. The warm absorber is in photoionization equilibrium with a central ionizing continuum. The ionizing continuum (here the “standard AGN” continuum in CLOUDY) consists of an “X-ray” power-law of photon index from 1.36 eV to 100 keV, above which the continuum falls off as E-3. A “Blue Bump” power-law is added to the “X-ray” power-law, with and an exponential cut-off corresponding to a “Blue Bump” temperature of K. A typical X-ray to UV ratio was chosen so that , where is the spectral index of a single power-law connecting the observed fluxes at 2 keV and 2500 Å (see CLOUDY manual). Solar composition (Grevesse & Anders 1989) and a constant density are assumed (with a hydrogen density n cm-3) within the entire single-zone warm absorber. The fits were performed between 0.1–5 keV in order to give relatively more statistical weight to the low energy data, neutral absorption was fixed at the galactic value and the instrumental normalization factors were fixed at the values listed in Sect. 4.4.
Both stationary and red-shifted warm absorbers were considered. As noted by Grandi et al. (1997) the stationary case gives a very poor fit to the data. This is because the bulk of the model absorption is caused at E0.7 keV, by the Ovii and Oviii edges, which is at significantly higher energy than observed. When the red-shift of the warm absorber is left as a free parameter, the best fit parameters are z with respect to the observer’s frame (i.e. z0.36 with respect to the rest frame of 3C 273), log U and log N, with 667 (for 516 dof). When the neutral absorption is left as a free parameter the statistics improve (642.2 for 515 dof). These results can be compared to the statistics obtained in the same energy range with a single power-law and free neutral absorption ( 881.3 for 515 dof) or a broken power-law and free neutral absorption ( for 513 dof).
5 Discussion
Both separate and simultaneous SIS and LECS fits make it possible to constrain the spectral shape of 3C 273 and to measure the relative systematic deviation between the SIS and the LECS. A power-law with galactic neutral absorption gives an adequate description of both the SIS and the LECS data in the range 2–10 keV. The SIS power-law slope () agrees well with near simultaneous values from XTE and MECS (Sect. 4.1). The 2–10 keV LECS spectrum of 3C 273 appears marginally flatter than the SIS spectrum (). Between 0.5–2 keV, the SIS and the LECS spectra show evidence for a flux deficit at the lowest energies which can be fit with excess neutral absorption. However, we suggest that this is a fit artifact due to the presence of an absorption feature at 0.5 keV, because of the flux increase observed by the LECS below 0.4 keV.
In previous ASCA observations of 3C 273 extra neutral absorption has been used as a description of possible SIS systematic uncertainties (see Cappi et al. 1998, Cappi & Matsuoka 1997 and references therein). Furthermore, because ASCA cannot observe the low-energy side of any absorption feature at 0.5 keV, such features can be mis-interpreted as a systematic instrumental effect. Simultaneous LECS/SIS power-law fits including excess absorption show that the 90% confidence upper limits for relative to the LECS are 0.8 and 2.0 cm-2 for SIS0 and SIS1, respectively in the range 0.6–4 keV. These upper limits, together with the small rms spread in data-to-model ratio (see Sect. 4.3) not only indicate a good match between LECS and SIS spectra, but exclude any other significant systematic trends with a spectral dependency. The variations in NH amongst the different ASCA observations of 3C 273 (Cappi & Matsuoka 1997) are therefore likely to be due to real changes in the intrinsic spectrum, rather than a measure of the systematic error.
The mean SIS/LECS normalization factor of 1.1 (see Table 2 and Sect. 4.4) probably reflects inadequate modeling of the obscuration caused by the LECS strongback during the off-axis exposure. The modeling is complicated by a slight “wobble” in pointing position during the BeppoSAX observation, due to a lack of suitable guide stars. Future work is expected to improve the understanding of these effects.
Strictly speaking the results of the present SIS/LECS comparison are only valid at the time of the observations and may not hold for other epochs. Further simultaneous ASCA/BeppoSAX observations of 3C 273 are planned to monitor the ASCA and BeppoSAX intercalibration.
The SIS and the LECS have fundamentally different detectors (CCDs versus GSPCs) and mirror designs (although the mirror materials are similar) and both instruments have been calibrated independently of one another. Therefore and because the relative agreement between the two instruments is good, one may be confident in the correctness of their absolute calibration. For these reasons and because the common spectral range extends down to lower energies, the simultaneous fits to the SIS0/SIS1/LECS data bring the strongest constraints yet on the spectral shape of 3C 273 between 0.1–2 keV.
The photoionization models considered in Sect. 4.5 require a large red-shift for the absorption component. The relativistic in-flow velocity implied by such a red-shift (v0.36 c) is higher than the typical velocities found in the broad line regions of AGN (1500–30000 km s-1) or in broad absorption line systems, which don’t exceed 0.1 (Hamman 1997). There is some evidence in other AGN for similar X-ray absorption features which may originate in relativistic winds (v0.2–0.6 c, Leighly et al. 1997). However, it is not yet clear which mechanism accelerates these flows. Finally, the assumption of simple photoionization equilibrium may not apply and other physical interpretations of the absorption feature, such as resonant absorption from Oviii Ly at E keV, cannot be strictly excluded.
Acknowledgements.
The authors wish to thank both the ASCA and the BeppoSAX science team members for help with these observations. We thank O.R. Williams for helpful comments. AO acknowledges an ESA Fellowship. The BeppoSAX satellite is a joint Italian and Dutch programme.References
- [1976] Anders E., Grevesse N., 1989, Geochimica et Cosmochimica Acta 53, 197
- [1976] Boella G., Butler R.C., Perola G.C., et al., 1997a, A&AS 122, 299
- [1976] Boella G., Chiappetti L., Conti G., et al., 1997b, A&AS 122, 327
- [1976] Cappi M., Matsuoka M., 1997. In: Winkler C., Courvoisier T., Durouchoux P. (eds.) Proc. 2nd INTEGRAL Workshop, The Transparent Universe. ESA SP-382, p. 389
- [1976] Cappi M., Matsuoka M., Otani C., Leighly K., 1998, PASJ, in press
- [1976] Courvoisier T.J-L, Turner M.J.L., Robson E.I., et al., 1987, A&A 176, 197
- [1976] Dotani T., Mitsuda K., Ezuka H., et al., 1996, ASCA News n.4
- [1976] Dotani T., Yamashita A., Ezuka H., et al., 1997, ASCA News n.5
- [1976] Ferland G.J., 1996, University of Kentucky, Department of Physics and Astronomy, Internal Report
- [1976] Fossati G., Haardt F., 1997, Internal report SISSA 146/97/A, astro-ph/9804282
- [1976] Grandi P., Guainazzi M., Mineo T., et al., 1997, A&A 325, L17
- [1976] Grevesse N., Anders E., 1989, AIP Conference Proceedings 183, Ed. Waddington C., p. 1
- [1976] Hamman F., 1997, ApJS. 109, 279
- [1976] Lammers U., 1997, The SAX LECS Data Analysis System, 1997, Internal Report ESTEC SAX/LEDA/0010, ESA
- [1976] Leach C., McHardy I., Papadakis I., 1995, MNRAS 272, 221
- [1976] Leighly K., Mushotzky R., Nandra K., Forster K., 1997, ApJ 489, L25
- [1976] Morisson D., McCammon D., 1983, ApJ 270, 119
- [1976] Orr A., Parmar A.N., Yaoqoob T., Guainazzi M., 1998, in Scarsi et al. (eds.) Proc., The Active X-ray Sky: Results from BeppoSAX and Rossi-XTE, Rome, October 1997. Nuclear Physics B Proceedings Supplements (in press), astro-ph/9712274
- [1976] Parmar A.N., Martin D.D.E., Bavdaz M., et al., 1997, A&AS 122, 309
- [1976] Savage B., Lu L., Bahcall J., et al., 1993, ApJ 413, 116
- [1976] Serlemitsos P., Jalota L., Soong Y., et al., 1995, PASJ 47, 105
- [1976] Stark A., Gamie C., Wilson R., et al., 1992, ApJS 79, 77
- [1976] Staubert R., 1992, In: W. Brinkmann and J. Trümper (eds.) X-ray Emission from Active Galactic Nuclei and the Cosmic X-ray Background, MPE report 235, p. 42
- [1976] Staubert R., Fink H., Courvoisier T.J-L. et al., 1992, In: AIP Proc. 254, Testing the AGN Paradigm, Am. Inst. Phys., New York, p.366
- [1976] Tanaka Y., Inoue H., Holt S.S., 1994, PASJ 46, L37
- [1976] Turner M.J.L., Williams O.R., Courvoisier T.J-L., et al., 1990, MNRAS 244, 310
- [1976] Turner T.J., Weaver K.A., Mushotzky R.F., Holt S.S., Madejski G.M., 1991, ApJ 381, 85
- [1976] Walter R., Orr A., Courvoisier T.J.L., et al, 1994, A&A 285, 119
- [1976] Williams O.R., Turner M.J.L., Stewart G.C., et al., 1992, ApJ 389, 157
- [1976] Worrall D., Mushotzky R., Boldt E., Holt S., Serlemitsos P., 1979, ApJ 232, 683
- [1976] Yaqoob T., Serlemitsos P., Mushotzky R., et al., 1994, PASJ 46, L49
- [1976]