The Circumnuclear Ring of Ionized Gas in NGC 3593 ††thanks: Based on observations carried out at ESO, La Silla (Chile) (ESO N. 52, 1-020) and on observations with the VATT: the Alice P. Lennon Telescope and the Thomas J. Bannan Astrophysics Facility.
Abstract
We present the results of narrow-band H[N II] imaging of the early-type spiral NGC 3593 in combination with a study of the flux radial profiles of the [N II] ( 654.80, 658.34 nm), H, and [S II] ( 671.65, 673.08 nm) emission lines along its major axis. The galaxy is known to contain two counterrotating stellar discs of different size and luminosity. We find that the H emission mainly derives from a small central region of 57′′25′′. It consists of a filamentary pattern with a central ring. This has a diameter of about 17′′ ( kpc) and it contributes about half of the total H flux. The ring is interpreted as the result of the interaction between the acquired retrograde gas which later formed the smaller counterrotating stellar disc and the pre-existing prograde gas of the galaxy.
Key Words.:
galaxies: individual: NGC 3593 — galaxies: interactions – galaxies: ISM — galaxies: spiral — galaxies: structure1 Introduction
By the mid-1980’s the phenomenon of counterrotation had been observed in a significant number of elliptical and lenticular galaxies (see the recent review by Bertola & Corsini 1998). Only more recently the presence of gaseous and/or stellar discs counterrotating with respect to the main stellar body has been discovered in some early-type spirals. These galaxies are the Sab(s) NGC~4826 (Braun et al. 1992, 1994; Rubin 1994; Walterbos et al. 1994; Rix et al. 1995), the Sb(r) NGC~7217 (Merrifield & Kuijken 1994), the Sa NGC~3626 (Ciri et al. 1995), the Sa pec NGC~3593 (Bertola et al. 1996), and the Sa(r) pec NGC~4138 (Jore et al. 1996).
This discovery poses new questions for the formation of disc galaxies. It is almost impossible for an isolated galaxy to generate an internal counterrotating component. In the general case, it is necessary to assume that the galaxy has acquired material from outside. The infall of external gas and the merging with gas-rich dwarf companions have been recently investigated by means of numerical simulations (Thakar & Ryden 1996; Thakar et al. 1997) as possible mechanisms for producing massive counterrotating gaseous discs in spirals. The presence of stellar counterrotation is usually interpreted as the end result of an initial counterrotation of gas. But gas acquisition in spirals, more than in elliptical or in S0 galaxies, raises the problem of the interaction between the accreted counterrotating and the pre-existing corotating gas (e.g., Lovelace & Chou 1996). Recently some attempts have been made to explain special cases of stellar counterrotation as due to a self induced phenomenon in non-axisymmetric potentials (Evans & Collett 1994; Athanassoula 1996; Wozniak & Pfenniger 1997).
NGC 3593 is an highly-inclined early-type spiral classified Sa pec by Sandage & Tammann (1981) and S0/a(s) uncertain by de Vaucouleurs et al. (1991). Sandage & Bedke (1994) in The Carnegie Atlas of Galaxies (hereafter CAG), described NGC 3593 as characterized by a spiral dust pattern made of patches rather than lanes. Such a dust pattern is visible via its silhouette throughout the face of the disc (see panel 76 in CAG) obscuring the galaxy central regions to the north of the major axis. An overview of the optical properties of NGC 3593 is given in Table 1.
| parameter | value |
|---|---|
| Name | NGC 3593 (UGC 6272) |
| Morphological type | Sa peca; SAS0b |
| Position (equinox 2000.0)b | |
| right ascension | 11h 14m |
| declination | ∘ 49′ |
| Heliocentric systemic velocity c | |
| Position angle P.A.b | 92∘ |
| Isophotal diameters Dd25b | |
| Inclination | 67∘ |
| Total corrected magnitude b | mag |
-
a
from Sandage & Tammann (1981)
-
b
from de Vaucouleurs et al. (1991)
-
c
from Bertola et al. (1996)
-
d
from Rubin et al. (1985)
In NGC 3593 Bertola et al. (1996) found two stellar exponential discs of different scale lengths and surface brightnesses counterrotating with respect to one other. The smaller and less massive stellar disc (disc 2) corotates with the H I, the H2 and the ionized gas disc, and counterrotates with respect to the larger and more massive stellar disc (disc 1). They also noticed that the radial intensity profile for the gas emission lines has two maxima at about 9′′ to each side of the centre. The derived properties of the stellar, gaseous and dust components of NGC 3593 are summarized in Table 2. They have been scaled to a distance of Mpc (Wiklind & Henkel 1992) with Mpc-1.
| parameter | value |
|---|---|
| Distance | 7 Mpc |
| Total luminosity | |
| Primary stellar disc (disc 1)b | |
| scale length | 40′′ |
| central surface brightness | 19.9 mag arcsec-2 |
| luminosity | |
| mass | M⊙ |
| Secondary stellar disc (disc 2)b | |
| scale length | 10′′ |
| central surface brightness | 18.5 mag arcsec-2 |
| luminosity | |
| mass | M⊙ |
| Gas and dust | |
| mass c | M⊙ |
| mass d | M⊙ |
| mass a | M⊙ |
| mass e | M⊙ |
-
a
from Wiklind & Henkel (1992)
-
b
from Bertola et al. (1996)
-
c
from this paper
-
d
from Krumm & Salpeter (1979)
-
e
from Young et al. (1996)
The main purpose of this paper is to present a new narrow-band H[N II] imaging of NGC 3593 and the flux radial profiles of the [N II] ( 654.80, 658.34 nm), H, and [S II] ( 671.65, 673.08 nm) emission lines measured along its major axis. We use our photometric and spectroscopic data to confirm the presence of a ring of ionized gas in the circumnuclear region of NGC 3593. It was previously suggested by Hunter et al. (1989) and Pogge & Eskridge (1993).
2 Observations, data reduction and results
2.1 Narrow-band imaging
The narrow-band H imaging of NGC 3593 was performed on March 8, 1997 at the 1.8 m Vatican Advanced Technology Telescope (VATT) operated in the Mt. Graham International Observatory. A back illuminated 20482048 Loral CCD with 15 m pixels was used as detector at the aplanatic Gregorian focus, f/9. It yielded a field of view of with an image scale of pixel-1 after a on-line pixel binning. The gain and the readout noise were 1.4 and 6.5 respectively.
We obtained minutes emission-band images and minutes continuum-band images using two narrow-band filters kindly provided by R.C. Kennicutt. The emission-band images were taken with an interference filter ( nm; nm) isolating the spectral region characterized by the redshifted H and [N II] (654.80, 658.34 nm) emission lines. The continuum-band images were taken through an interference filter ( nm; nm), which has been selected to observe an emission-free spectral region sufficiently near to that of the emission-band filter in order to subtract off the stellar continuum in the emission-band images. Different flat field exposures of the twilight sky were taken for each of the two filters.
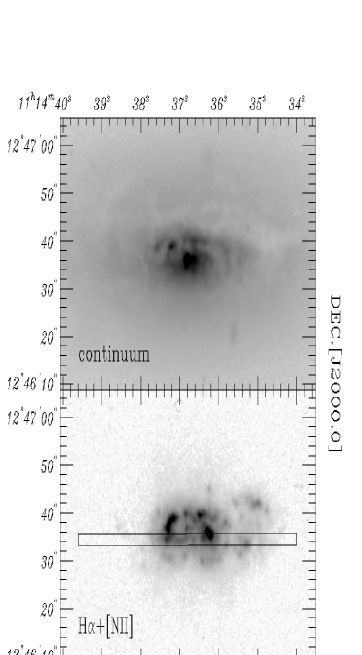
The data reduction was carried out using IRAF111IRAF is distributed by the National Optical Astronomy Observatories which are operated by the Association of Universities for Research in Astronomy (AURA) under cooperative agreement with the National Science Foundation. The images were bias subtracted, flat field corrected using the normalized flat field of the corresponding filter and then sky subtracted. The sky level was determined by calculating the average intensity in blank regions of the frames. The images were shifted and aligned to an accuracy of a few hundredths of a pixel using the common field stars as a reference. Then they were averaged (after checking that their PSF’s were comparable) to obtain a single continuum-band image (Fig. 1, upper panel) and a single emission-band image. The cosmic rays were identified and removed during the averaging routine. Gaussian fits to field stars in the two final processed images yielded point spread function measurements of (FWHM). This corresponds to a physical resolution of 37 pc at the assumed distance. Finally the continuum-free image of NGC 3593 (Fig. 1, lower panel) showing the galaxy H[N II] emission was obtained by subtracting the continuum-band image, suitably scaled, from the emission-band image. The mean scale factor for the continuum image was estimated by comparing the intensity of the field stars in the two bandpasses.
The flux calibration was performed using images of the optical spectrophotometric standard star Feige 66 (Oke 1990) obtained during the same night. The total H[N II] flux of NGC 3593 was measured by summing the contribution of those pixels exceeding the sky background noise level ( ). The resulting value is . The uncertainty on is estimated to be . Our determination of the H[N II] flux is in agreement, within the measurement errors, with that of Young et al. (1996). We subtract from this total emission flux the estimated contribution of the two [N II] lines to obtain the H emission flux for NGC 3593. At the wavelengths of the redshifted [N II], H,and [N II] lines the transmission of the filter is , , and , respectively. We know the [N II]/[N II] ratio from the atomic transition probabilities and we measured [N II]/H from our spectroscopical data (see § 2.2). In fact the two [N II] lines contribute to the total emission in the continuum-free image. After this subtraction we find . Our H flux determination lies in between measured by Pogge & Eskridge (1993) and by Hunter et al. (1989). According to Burstein & Heiles (1984) the Galaxy contributes no appreciable foreground extinction for NGC 3593, and noattempt was made to correct the computed flux for internal extinction. This flux corresponds to a total H luminosity of at the assumed distance.
2.2 Long-slit spectroscopy
For the study of radial profiles of the flux of the [N II], H and [S II] emission lines we adopted the same original spectral data of NGC 3593 used by Bertola et al. (1996) to derive the kinematics of stars and ionized gas. They were obtained at the ESO 1.52 m Spectroscopic Telescope in La Silla on February 18-19, 1994. The Boller & Chivens Spectrograph was used in combination with the No. 26 1200 grating and a slit. Four major-axis (P.A. = 92∘) spectra of 60 minutes were taken with an instrumental resolution of nm (i.e. at 620.0 nm). The spectral range was 520.0 – 719.0 nm. Each NGC 3593 spectrum pixel corresponds to 0.097 nm after on-chip binning of 3 pixels along the spatial direction on the No. 24 FA2048L CCD. The details of the spectra reduction and calibration are given in Bertola et al. (1996).
We measured the flux of the [N II] lines ( 654.80, 658.34 nm), of the H line, and of the [S II] lines ( 671.65, 673.08 nm). At each radius the line flux was obtained separately for each emission line after fitting a polynomial to the surrounding continuum, using the ESO-MIDAS222MIDAS is developed and maintained by the European Southern Observatory package ALICE. At some radii where the intensity of the emission lines was low, we averaged adjacent spectral rows to improve their ratio.
The flux calibration was performed by comparing the major axis H[N II] emission radial profiles of the ESO spectrum with that of VATT continuum-free image (see Fig. 2). The uncalibrated profile of the ESO spectrum was obtained by summing, at each radius, the contribution of the H and of the two [N II] lines scaled for the transmission of the VATT emission-band filter at their relevant wavelengths. The VATT calibrated profile was obtained from the central row of the continuum-free image. The image has been previously rotated counterclockwise by 2∘ and rebinned in pixels to reproduce the scale, the slit width and the seeing of the ESO spectrum. Because of the differences in instrument, weather conditions and set-up of the two observing runs this should be considered only a rough but useful calibration.
The flux radial profiles of all the measured emission lines show the same trend (Fig. 2). They are characterized by a central relative minimum and two maxima at . A secondary peak in the fluxes of the emission lines has been detected at ′′. For ′′ ′′ the flux ratio between the [N II] and the H lines ranges between 0.35 and 0.56, the flux ratio between the [S II] and the H ranges between 0.10 and 0.16, and the flux ratio between the [S II] and the [S II] lines is virtually constant at 0.76.

3 Discussion and conclusions
Our continuum-free image reveals that the H[N II] flux of NGC 3593 mainly derives from a small central region of about 57′′25′′ ( kpc-2) as projected on the sky. It constits of a filamentary pattern dominated by a ring and two bright H II structures. The centre of the ring coincides with the position of the maximum intensity in the continuum. The two H II structures are located to the west of the centre at a distance of about 24′′ and about 30′′ at position angles of 109∘ and 79∘ respectively. A faint H II complex is detected to the east at about 59′′ from the centre at a position angle of 94∘. The area of the ring is about 0.17 ( of the total line-emitting region). It contributes about half of the total line flux. Fitting this maximum-emission region, we derived for the ring an apparent major-axis diameter ( kpc), a position angle ∘∘, and an ellipticity corresponding to an inclination ∘∘. The derived value of the ring inclination is in agreement within the errors with the galaxy inclination of 67∘ derived by Rubin et al. (1985) from the disc parameters. The position of the two maxima in the radial flux profiles of the all the measured emission lines corresponds to the radii at which the ring intersects the line of the nodes.
We have obtained the photometric and spectroscopic evidence for the existence in NGC 3593 of a circumnuclear ring of ionized gas. It is associated with molecular gas, which is also distributed in a nuclear ring-like configuration as discovered by Wiklind & Henkel (1992). The centre of the CO ring coincides with the galaxy kinematical center and its radius () is located at the turning point of the ionized gas rotation curve.
In the past years, Hunter et al. (1989) were not able to distinguish between a small gaseous disc and a possibly ring-like structure due to the lower resolution of their H image. Pogge & Eskridge (1993) derived the same overall morphology and suggested the presence of the ring. The extent of the H[N II] emitting region is about , as deduced from their published plate. In this image the diffuse emission surrounding the structure of the ring is not visible. They measured for the H ring the same major-axis position angle (∘∘) and a smaller diameter (). This difference is probably due to the clumpy morphology of the ionized gas emission. No estimate of the ring ellipticity (or inclination) is given.
As it appears from the kinematics along the major axis of NGC 3593 (Bertola et al. 1996) the ionized gas ring corotates with the gaseous and the secondary stellar discs and counterrotates with respect to the primary stellar disc. From Wiklind & Henkel (1992) we derive that the ionized and the molecular gas components corotate.
The H luminosity can be used to estimate the current star formation rate (SFR) of NGC 3593. Following the SFR relation by Kennicutt (1983) we find for NGC 3593 a SFRHα (total) . This value is about one tenth of the SFR derived from the far infrared (FIR) luminosity by Wiklind & Henkel (1992). Indeed it is SFRFIR (total) . The observed H flux is about of the value needed to make the SFR derived from the H luminosity comparable to that from the FIR luminosity. It means that NGC 3593 is not a transparent system. In fact NGC 3593 is a dust-rich system as one can also infer by a comparison of its dust-to-H I gas mass ratio with the mean values found by Bregman et al. (1992) for the early-type disc galaxies investigated by Roberts et al. (1991).
We can estimate the mean past SFR from the mass and the age of the stellar disc. Following Kennicutt et al. (1994), but using our determination of the mass of stellar disc, we find (past) . For NGC 3593 the birthrate parameter calculated as the ratio of current SFR (from FIR luminosity) to average past SFR is . For comparison, Kennicutt et al. (1994) found that this value for a sample of 18 non-interacting and/or peculiar Sa’s ranges from 0.01 to 0.1 (with ). So the central part of NGC 3593 is characterized by a value of which is high compared to the majority of early-type spirals. The current SFR is slightly higher than the SFR in the recent past. Given the uncertainty in estimation of the SFR the only tenable conclusion is that it has been approximately constant.
The total ionized gas mass can be derived from the H luminosity under the assumption of case B recombination (see Osterbrock 1989). For a given electron temperature and density, the H II mass can be written:
| (1) |
where is the H luminosity, is the mass of the hydrogen atom, is the H emissivity, and and are the electron and the proton densities. The term is insensitive to changes of over the range – cm-3. It decreases by a factor 3 for changes of over the range ∘K–∘K (Osterbrock 1989). For an assumed temperature ∘K, the electron density can be estimated to be cm-3 from the measured [S II] lines ratio. It results M⊙ for the observed and a value ten times larger for the corrected for extinction.
The presence of a counterrotating star-forming H ring in the nuclear regions of a galaxy was found for the first time in NGC 4138 (Jore et al. 1996). The discovery of the same feature in NGC 3593 is notable, as the two galaxies are very similar. They are both early-type spirals with a small bulge and an apparently undisturbed morphology apart from the dust lanes crossing their stellar components. But they each have two counterrotating stellar discs with the more massive one containing about the of the stars. In both galaxies a gaseous disc is present and it rotates in the same direction as the less massive stellar disc. In the two objects the total counterrotating mass amounts to about the of their luminous mass.
The ring in NGC 3593 gives further significance to the numerical results of Thakar et al. (1997) for NGC 4138. They adopted a two-component galaxy model with a stellar gas-free exponential disc and a truncated spherical isothermal halo to investigate the origin of the massive counterrotating component. In one of their simulations, namely I6, they placed in the stellar disc a prograde ring of gas. In this case the observed counterrotating H ring is the relic of the collisions between the infalling retrograde gas clouds and the pre-existing but less massive prograde gas. Such collisions could have triggered the local enhancement of the stellar formation rate in the region of the ring. The same scenario can be applied to the case of NGC 3593. The formation of one or more gaseous rings in counterrotating systems as due to the two-stream instability has been discussed by Lovelace et al. (1997).
As to the remaining spirals hosting counterrotation listed in § 1, in NGC 4826 the interaction between the newly supplied counterrotating gas and the old corotating one is actually observed in the so-called ‘transition region’ (Rubin 1994). In NGC 3626 no gaseous ring has been detected (García-Burillo et al. 1998). In NGC 7217 the ionized gas rotates in the same direction as the primary stellar disc (Merrifield & Kuijken 1994). The presence of three gaseous rings has suggested to Athanassoula (1996) an internal origin for its stellar counterrotation as due to the decay of a bar. In this sense gaseous rings in this kind of objects could be useful to understand if the origin of counterrotation is external or internal. In the case of an external origin a gaseous ring could be considered as the signature of the presence of an original amount corotating gas.
Acknowledgements.
We wish to thank G. Galletta for useful discussions and J.E. Beckman for his valuable comments on the manuscript. We are most grateful to R.C. Kennicutt for the use of its interference filters set at the VATT, and to the Vatican Observatory Research Group for the allocation of time for our observations. In particular we thank R. Boyle, S.J for his help during the observing run at the VATT. The research of AP was partially supported by an Acciaierie Beltrame grant. JCVB acknowledges the support by a grant of the Telescopio Nazionale Galileo and the Osservatorio Astronomico di Padova. EMC thanks the Instituto de Astrofísica de Canarias for hospitality while this paper was in progress. This research has made use of The Digitized Sky Survey, which was produced at the Space Telescope Science Institute under U.S. Government grant NAG W-2166.References
- (1) Athanassoula, E. 1996, In: ‘Barred Galaxies’, IAU Coll. 117, Buta R., Crocker D.A., B. G. Elmegreen (eds.), ASP Conf. Ser. Vol. 91, ASP, San Francisco, p. 309
- (2) Bertola, F., Corsini, E.M. 1998, In: ‘Galaxy Interactions at Low and High Redshift’, IAU Symp. 186, Sanders D.B. (ed.), ASP Conf. Ser., ASP, San Francisco, in press
- (3) Bertola, F., Cinzano, P., Corsini, E.M., Pizzella, A., Persic, M., Salucci, P. 1996, ApJ, 458, L67
- (4) Braun, R., Walterbos, R.A.M., Kennicutt Jr., R.C. 1992, Nature, 360, 442
- (5) Braun, R., Walterbos, R.A.M., Kennicutt Jr., R.C., Tacconi, L.J. 1994, ApJ, 420, 558
- (6) Bregman, J.N, Hogg, D.E., Roberts, M.S. 1992, ApJ, 387, 484
- (7) Burstein, D., Heiles, C. 1984, ApJS, 54, 33
- (8) Ciri, R., Galletta, G., Bettoni, D. 1995, Nature, 375, 661
- (9) de Vaucouleurs, G., de Vaucouleurs, A., Corwin Jr., H.G., Buta, R.J., Paturel, G., Fouquè, P. 1991, Third Reference Catalogue of Bright Galaxies, Springer-Verlag, New York
- (10) Evans, N.W., Collett, J.L. 1994, ApJ, 420, L67
- (11) García-Burillo, S., Sempere, M.J., Bettoni, D. 1998, ApJ, in press
- (12) Hunter, D.A., Thronson Jr., H.A., Casey, S., Harper, D.A. 1989, ApJ, 341, 697
- (13) Kennicutt Jr., R.C. 1983, ApJ, 272, 54
- (14) Kennicutt Jr., R.C., Tamblyn, P., Congdon, C.W. 1994, ApJ, 435, 22
- (15) Krumm N., Salpeter, E.E., 1979, ApJ, 228, 64
- (16) Jore, K.P., Broeils, A.H., Haynes, M.P. 1996, AJ, 112, 438
- (17) Lovelace, R.V.E., Chou, T. 1996, ApJ, 468, L25
- (18) Lovelace, R.V.E., Jore, K.P., Haynes, M.P. 1997, ApJ, 475, 83
- (19) Merrifield, M.R., Kuijken, K. 1994, ApJ, 432, 575
- (20) Oke, J.B. 1990, AJ, 99, 1621
- (21) Osterbrock, D.E. 1989, Astrophysics of Gaseous Nebulae and Active Galactic Nuclei, University Science Book, Mill Valley
- (22) Pogge, R.W., Eskridge, P.B. 1993, AJ, 106, 1405
- (23) Rix, H.-W., Kennicutt Jr., R.C., Braun, R., Walterbos, R.A.M. 1995, ApJ, 438, 155
- (24) Roberts, M.S., Hogg, D.E., Bregman, J.N., Forman, W.R., Jones, C. 1991, ApJS, 75, 751
- (25) Rubin, V.C. 1994, AJ, 107, 173
- (26) Rubin, V.C., Burstein, D., Ford Jr., W.K., Thonnard, N. 1985, ApJ, 289, 81
- (27) Sage, L.J. 1993, A&A, 272, 123
- (28) Sandage, A., Bedke, J. 1994, The Carnagie Atlas of Galaxies, Carnagie Institution and Flintridge Foundation, Washington (CAG)
- (29) Sandage, A., Tammann, G.A. 1981, A Revised Shapley-Ames Catalog of Bright Galaxies, Carnagie Institution, Washington
- (30) Thakar, A.R., Ryden, B.S. 1996, ApJ, 461, 55
- (31) Thakar, A.R., Ryden, B.S., Jore, K.P., Broeils, A.H. 1997, ApJ, 479, 702
- (32) Walterbos, R.A.M., Braun, R., Kennicut Jr., R.C. 1994, AJ, 107, 184
- (33) Wiklind, T., Henkel, C. 1992, A&A, 257, 437
- (34) Wozniak, H., Pfenniger, D. 1997, A&A, 317, 14
- (35) Young, J.S., Allen, L., Kenney, J.D.P., Lesser, A., Rownd, B. 1996, AJ, 112, 1903