Radiation from Dwarf Nova Discs
Abstract
We use the Shaviv & Wehrse (1991) code to model the vertical structure and the emission properties of quiescent dwarf nova discs. We find that in the case of HT Cas the quiescent disc must be optically thin, in contradiction with the requirements of the standard disc instability model. We find a viscosity parameter . Although this is much less than values () obtained in isothermal slab models it is not consistent with the accretion disc model assumptions.
PACS: 95.10.Gz; 97.30Jx; 97.30.Qt; 97.80.Gm
Keywords: Accretion discs; Dwarf novae; Radiative transfer
1 Introduction
Dwarf novae are cataclysmic binary systems (Warner 1995) which go into outbursts at more or less regular intervals. In cataclysmic binaries, a Roche–lobe filling low mass (secondary) star loses matter that is accreted by a white dwarf (the primary). If the white dwarf is not too strongly magnetized ( G) the accreting matter forms a disc that extends down to the white dwarf surface. Despite the variety of the observed properties of dwarf nova outbursts it has been firmly established that they are due to the brightening of the accretion disc in this systems. This does not mean that the physical process leading to outbursts must be a disc instability. For some time (see Cannizzo 1993, 1997, for the history of the subject) an instability in the mass transfer from the secondary was put forward as an alternative possibility. This model was discarded by the majority of those working in the field when a simple physical reason for disc instability (hydrogen recombination) was found in the early 80’s. In the standard version of the disc instability model (DIM) it is assumed that the mass transfer is constant in time, but there is growing evidence that variations in the mass transfer rate play an important role, in, at least, some types of dwarf nova outbursts (Smak 1996; Lasota 1996; Cannizzo & King 1998).
The DIM reproduces rather well the basic properties of ‘typical’ dwarf nova outbursts (see Hameury et al. 1998 for the most recent version of the model). When it comes to the description of the variety of outburst properties, however, the range of recurrence times and the emission properties of dwarf nova cycles, the DIM is less successful. Very long recurrence times in WZ Sge–type systems, are obtained only by assuming either very low values of the viscosity parameter (Smak 1998), or inner disc radii larger than the white dwarf radius and increased mass transfer during the outburst (Lasota et al. 1995; Hameury et al. 1997). Clearly, these problems are due, at least in part, to our poor knowledge of the viscous processes operating in accretion discs.
Additional difficulties appear when one tries to obtain accretion disc spectra. In the simplest case, it is assumed that each ring of an optically thick disc emits like a black body. Another approach consists in using stellar atmosphere models corresponding to the disc effective temperature and gravity at optical depth one. As shown by Wade (1988) and Shaviv & Wehrse (1991) such models provide an inadequate description of accretion disc spectra. In the case of optically thin discs, various approximate schemes have been used to describe continuum and line radiation (Williams 1980; Tylenda 1981; Marsh 1987; Lin et al. 1988; Mineshige & Wood 1990, Dumont et al. 1991; Williams 1991; Wood et al. 1992) but these models are not self-consistent; in particular they often require very high () values of the viscosity parameter (see below).
Quiescent dwarf nova discs present a rather surprising puzzle, which results, probably, from two weaknesses of accretion disc models: the ignorance of the nature of viscosity which drives accretion (see e.g. Gammie & Menou 1997) and the inadequate description of the disc emission. These two features are not independent, since the disc temperature stratifications depend on the vertical distribution of the viscous heating.
The disc instability model in its ‘standard’ form predicts an optically thick quiescent accretion disc. In several cases, however, the observed continuum radiation of such discs suggests rather an optically thin disc emission because of the presence of the Balmer jump in emission and, at longer wavelengths, emission dominated by the Paschen continuum (see e.g. Wood et al. 1989; Wood 1990; Wood et al. 1992). The simple (isothermal slab) models of such discs, however, require enormous values () of the viscosity parameter which, according to the model, should be smaller than unity and whose value in quiescence, according to the DIM, should be . Interestingly, modeling Balmer emission lines in such discs also requires very large values of the viscosity parameter, but in this case emission can be attributed to an optically thin chromosphere (Mineshige & Wood 1990). As pointed out by Wood et al. (1992; see also Vrielmann 1997) the very high values of the viscosity parameter most probably result from the simplistic treatment of radiation from an optically thin discs. There exists, however, a self–consistent description of the disc vertical structure developed by Shaviv & Wehrse (1991; hereafter SW) and successfully applied to nova–like cataclysmic variables (Idan & Shaviv 1996).
In this article we apply the SW code to, non-equilibrium, dwarf nova discs and compare the calculated emission with the general properties of observed quiescent accretion discs in such system, in particular, with the multicolour observations of HT Cas in quiescence (Horne et al. 1991; Wood et al 1992).
2 The case of HT Cas
HT Cas is an eclipsing dwarf nova with an orbital period of 106 min. This well–studied system is not a typical dwarf nova: its outbursts are rare (the mean cycle length is 400 according to Wenzel 1987) and although it is an SU UMa–type dwarf nova, only one superoutburst of this system has been observed until now (Zhang et al. 1986). In addition HT Cas also shows low states, i.e. during quiescence it goes to a lower luminosity state. It is an eclipsing X–ray source. King (1997) speculates that it could be a cataclysmic variable that went through the minimum period and Lasota et al. (1995) suggest that its long recurrence time could be due to the low mass transfer rate and a truncated inner accretion disc.
Although HT Cas is an eclipsing system, almost no bright spot modulation is observed in its light curve. This could mean (Smak, private communication) that most of the accretion stream overflows the disc. If this is the case, the validity of models assuming that the observed radiation is emitted by an axially symmetric ‘standard’ disc is questionable. Wood (1990) used a simple models of stream penetration and stripping to show that this does not lead to flat temperature profiles in stationary accretion discs. Modeling multicolour properties of quiescent dwarf-nova disc in such a configuration does not seem, however, to be a tractable problem.
Patterson (1981) called HT Cas ‘the Rosetta Stone of dwarf novae’ but this system might be too atypical to provide the information needed to solve the mysteries of dwarf novae. For the moment, however, HT Cas is the system which provides most observations about quiescent dwarf nova discs.
Accretion disc eclipse light curves are analyzed with the maximum entropy method (MEM) developed by Keith Horne and collaborators (Horne 1993 and references therein). The intensity maps of the disc produced by this technique are used to derive the surface brightness as a function of radius. When the distance to the system is known, the brightness is transformed into flux density and the result is usually represented as a brightness temperature distribution.
The MEM technique was applied to quiescent disc eclipse light curves of Z Cha (Wood el al. 1986), OY Car (Rutten el al. 1992; Wood et al. 1989) and HT Cas (Wood et al. 1992). Only in the case of HT Cas the technique was applied to light curves in four UBVR colours. In all cases, as predicted by the DIM (see e.g. Smak 1984, Fig 4). the radial distribution of temperature is flat, indicating a non–steady disc. The DIM predicts a flat profile of the effective temperature (see below) and the brightness temperature is close to the effective one only if the disc radiates approximatly like a blackbody - which is not the case even for optically thick accretion discs (see e.g. SW) In Z Cha, OY Car and HT Cas, however, the disc colours suggest that it is optically thin so care should be taken when interpreting the MEM results.
The case of HT Cas seem to be more complicated. Zhang et al. (1996) found that the disc (observed between October 1982 and October 1984) is optically thick but the October-November 1983 UBVR observations (with one observation the same night as Zhang et al.) by Horne et al. (1991) show that disc emission is dominated by the U and R fluxes. Such optical continua showing a Balmer jump in emission and stronger emission in R than in B and V, suggest an optically thin emitter.
3 The dwarf–nova disc instability model
3.1 Quiescent disc in the DIM
Quiescent dwarf nova discs are not stationary so most formulae familiar from the ‘standard’ disc model do not apply in this case.
According to the standard version of the DIM a quiescent dwarf nova disc must be entirely in a cold (low) state. This means that its surface density at any point must be lower than the maximum surface density on the cold ‘branch’ . For this maximum surface density can be fitted by the following formulae (Hameury et al. 1998)
| (1) |
The corresponding critical equilibrium accretion rate is
| (2) |
and the critical effective temperature is given by
| (3) |
where is the white dwarf mass in solar units, is the viscosity parameter and is the distance from the center in cm. The fact that the critical effective temperature depends very weakly on the parameters defining disc structure, (for a given convection energy transport prescription) is well known and easy to explain (see e.g. Cannizzo 1993).
The effective temperature profile ( of the quiescent disc is, according to the model, rather flat, much flatter than the stationary disc profile .
Clearly so a DN quiescent disc is not in equilibrium. This is not surprising, since if it were in a stable equilibrium it would have no reason to go into outburst. Matter transferred from the secondary is, therefore, accumulated somewhere in the disc. The location of the accumulation region depends on the values of the mass transfer rate and of the viscosity in the disc.
The quiescent disc is not in a viscous equilibrium but the thermal equilibrium condition is very well satisfied (Hameury et al. 1998). In terms of the S–curve picture it corresponds to the system point moving, on a (long ‘secular’) viscous time, along the lower, cold, branch of the equilibrium curve.
Since the well known stationary state formulae relating viscous heating and effective temperature to the accretion rate are not longer valid. Their equivalents can be easily derived from the standard equations describing non–stationary accretion discs..
The radial velocity in a Keplerian disc can be written as (see e.g. Frank, King and Raine 1992)
| (4) |
so that the accretion rate is
| (5) |
The formula for the viscous heating per unit surface takes then the form
| (6) |
Taking into account the inner boundary condition () one can write as
| (7) |
so that
| (8) |
For one obtains the familiar formula valid in case of viscous equilibrium but in the general, non–stationary case the factor can take values from 2 to 5, say. This is not negligible if one wants to determine the value of the effective temperature because the ratio of its highest to its lowest values defining the instability ‘strip’ is smaller than 1.5.
3.2 The high problem
Attempts to ‘fit’ quiescent dwarf nova discs result in very high ( values of the viscosity parameters. The reason for that can be easily understood.
The energy equation is written in the form:
| (9) |
Scaling to characteristic parameters of a quiescent dwarf nova disc, this can be written as
| (10) |
where is the effective temperature in units of 5000 K, and the distance has been expressed in units of the distance from the white dwarf to the point as used in the MEM maps. It is easy to see that for central temperatures , low values of required by an optically thin model imply ! This especially the case of isothermal slab models in which both the lines and the continuum are emitted by the same medium (Wood et al. 1992). As we see in Section 5, even a more refined model with temperature stratification still requires, in the case of HT Cas, .
4 Models and results
4.1 The ‘-curves’
The SW model of vertical accretion disc structure assumes that the disc is in a steady state. Since quiescent dwarf nova discs are in thermal equilibrium one can use the SW model at each ring of the disc, using the local value of the accretion rate and taking into account non–steady disc relations described in Section 2.2.
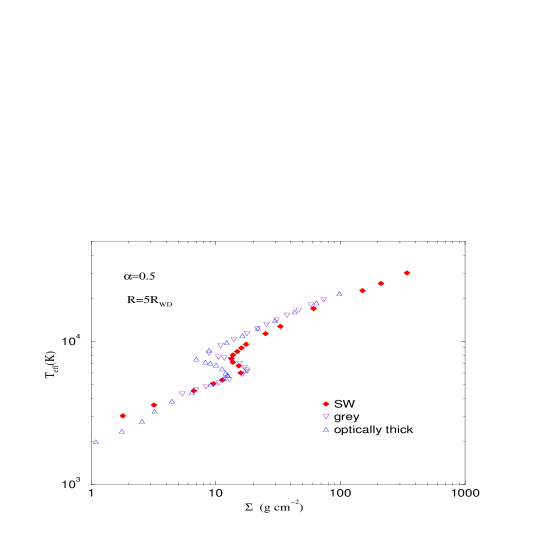
First, we verified that SW thermal equilibrium accretion disc solutions have the same general properties as the disc models used in the DIM. Using the SW model we calculated series of models for several values of the radius and the viscosity parameter . We plotted this solutions on a customary diagramme. An example is shown on Figure (1). We compare the SW models with the ones obtained with the Hameury et al. (1998) code. In this code two approximations can be used: either the transfer is calculated in the diffusion approximation or a (simplified) ‘grey atmosphere’ approach is adopted. Fig. (1) show that there is very good agreement between SW and ‘grey’ models on the cold branch of solutions () but there are deviations on the unstable and hot branches. The SW and Hameury et al. (1998) approach give the same results only for K. This differences are most probably due mainly to different opacity tables used in the two codes (Idan et al. 1998). Since in the standard DIM one has to assume a ‘jump’ in (see e.g. Hameury et al. 1998) the small differences in the upper branches of solutions are of no practical importance for the description of a DN outburst. The excellent agreement on the lower branch makes it consistent to model emission from quiescent dwarf nova discs by using in the SW code obtained from the DIM.
4.2 The quiescent disc in HT Cas
We used the SW code to study emission properties of the quiescent accretion disc in HT Cas. We did not try to fit the brightness temperature distribution obtained by Wood et al. (1992). First, it is not clear what is the sense of a procedure in which one first fits intensity maps to eclipse curves by using MEM, then, in a second step, one fits the physical parameters to the intensities (Horne 1993; Vrielmann 1997). Second, the status of the so-called ‘Physical Parameter Eclipse Mapping’ proposed by Vrielmann (1997) is not well established and its application to HT Cas produced results which are in contradiction both with Wood et al. (1992) and the fundamental assumption of the DIM. In any case using the SW code for the ‘Physical Parameter Eclipse Mapping’ would require a prohibitive amount of computer time.
We adopted, therefore, a simple and pragmatic approach and just tried to find the range of accretion rates and values of the viscosity parameter which gives the best description of the observed properties of the quiescent disc in HT Cas. We used as a guide the total disc colours which are not determined by the MEM fitting procedure (but they are model dependent). We tried to reproduce flux ratios of the U,B,V and R wavelengths (folded through bandpasses response functions of the Stienning photometer). This procedure is independent of the distance to HT Cas. In this way we find a range of and values which correspond to flux ratios of both the total disc emission and the reconstructed radial distribution.
Our main aim was to check if observed properties of the quiescent disc in HT Cas are consistent with the general assumptions of accretion disc models. Results of previous studies (Wood et al. 1992; Vrielmann 1997) were in a flagrant contradiction with the standard disc model (not only with the DIM, so that constraints obtained on critical temperatures etc. do not have much meaning). Here we tried to see if an improved model of the disc vertical structure may help to reconcile models and observations.
The total disc fluxes in UBVR (which are just slightly different form Johnson’s standards) in HT Cas are (Wood et al. 1992): , , , (in millijanskys). Clearly the Balmer jump is in emission and confirms that the continuum is emitted by an optically thin medium. Emission lines apparently contribute to the emission, but even with this contribution subtracted, the emission is still high compared with fluxes in shorter wavelengths. The fluxes given above assume but since the reddening to HT Cas is not well determined, we have also used which, probably, is the maximum value allowed by observations (Wood et al. 1992).
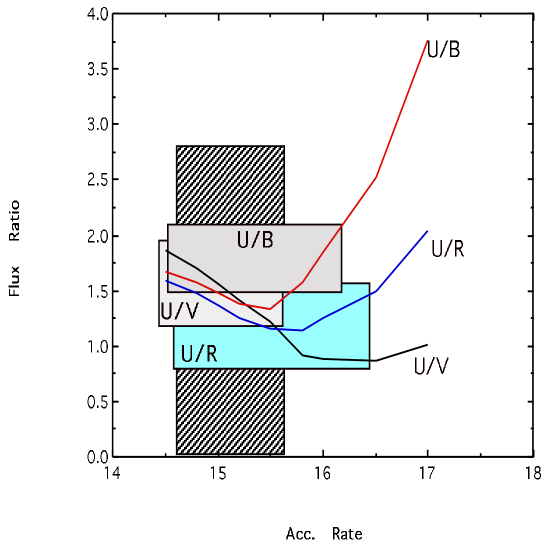
First, we studied the disc flux ratios at given radius as a function of the accretion rate for a given . An example is shown on Figs. (2) and (3) for . We assumed that, the disc effective temperature is constant, parallel to the critical effective temperature (we can neglect in Eq. 3 the weak dependence on and ), so that in the disc . (In what follows we use ). This is a good approximation of the temperature profiles obtained in the framework of the DIM. One can see that the U fluxes ratios all have a minimum at accretion rates g s-1. ( is the accretion rate corresponding to a steady disc, the real accretion rate in this case is 7 times larger - see 3.1. Eq. 5). This feature is almost independent of the value of . At approximatly the same value of accretion rate the , and ratios intersect. Clearly, this range of values of the accretion rates corresponds to the transition between an optically thick (for higher ’s) and optically thin regime (for lower ’s). One can see that observed flux ratio correspond clearly to an optically thin disc. We found that and are the best choice of parameters.
We use then the total disc colours to check if this choice is consistent with this set of observations.
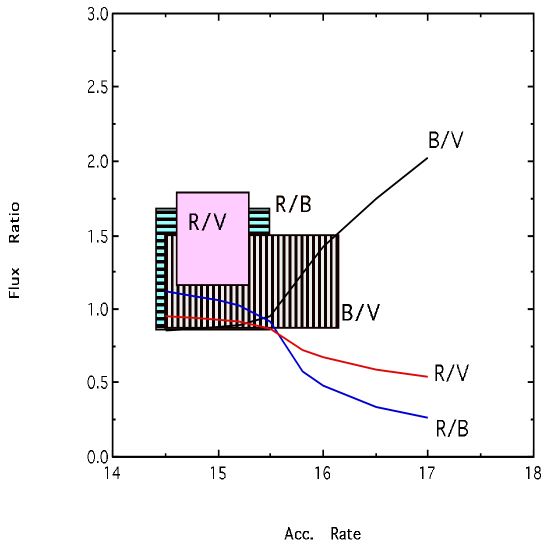
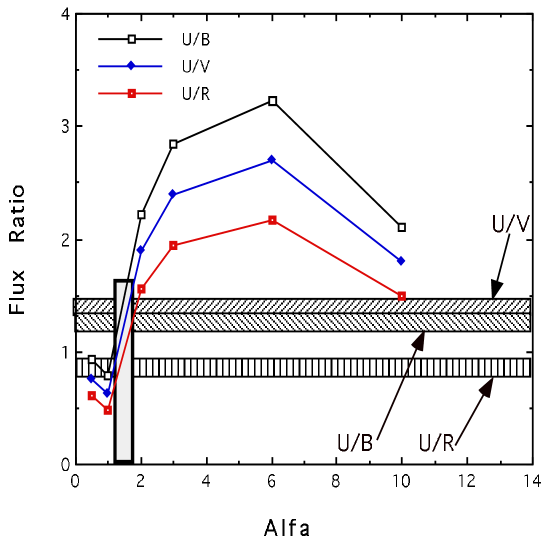
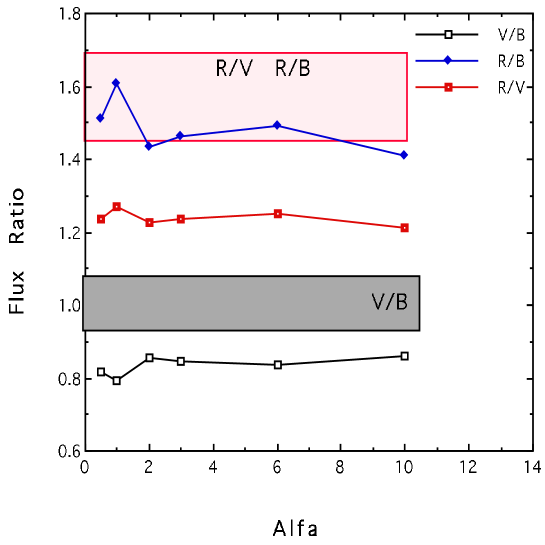
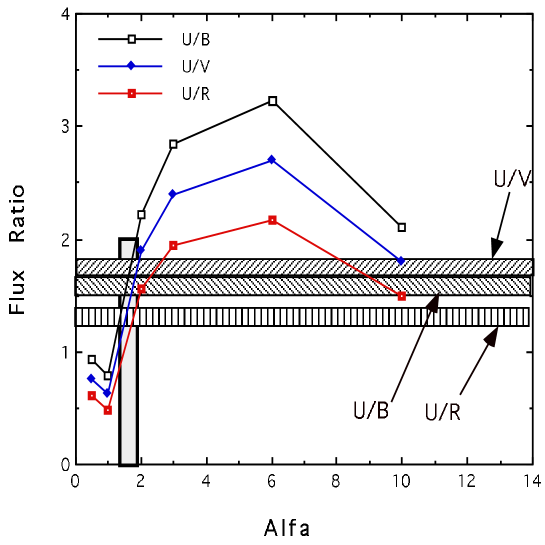
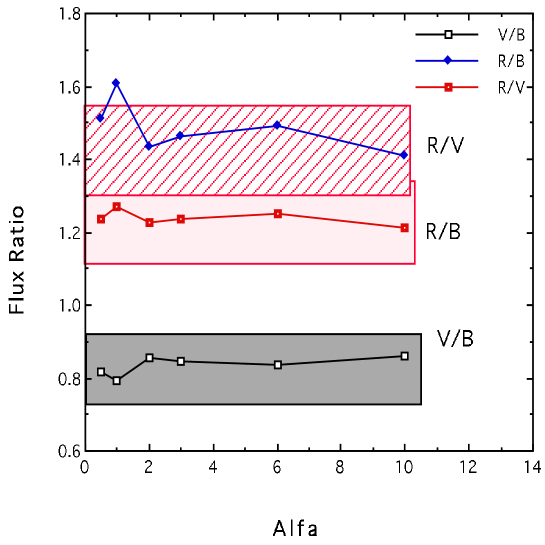
Figures (4),(5),(6) and (7) show the calculated flux ratios as a function of . The , and ratios depend rather strongly on whereas , and show only a weak dependence on this parameter. The maximum in the ratios is due to the fact that with increasing the midplane temperature also increases but the optical depth decreases, so that for some value of the viscosity parameter the latter effect begins to dominate. We increased by 30% in order to account for the line emission that has not been included in the vertical structure model.
One can see that if , calculated and are outside the observed confidence (2) limit. For one gets a very good agreement between the model and observations especially for the , and and ratios, but they depend only weakly on .
We conclude, that if the quiescent disc in HT Cas is unsteady and its effective temperature profile is similar to the one predicted by the DIM, the required value of is marginally consistent with the assumptions of the standard accretion disc model but incompatible with values required to obtain dwarf nova outbursts in this model framework. The value of the mass transfer rate y-1 is consistent with the, very uncertain, distance determinations (Wood et al. 1992).
5 Conclusions
We showed that the properties of equilibrium accretion disc configurations which are the basis of dwarf nova instability model (‘’) are not drastically modified by using the Shaviv & Wehrse radiation transport code to calculate disc equilibria.
The use of this code to describe emission from the quiescent disc of dwarf nova HT Cas leads to values of the viscosity parameter which are larger than unity. They are lower than the large values obtained in some previous studies but still too high to be in agreement with the fundamental assumptions of the standard disc model and it is doubtful that additional refinements would change by more than a factor 2. In any case the main problem, is that quiescent dwarf nova discs seem to be optically thin while the model seem to require optically thick media. The reason is that, according to the model, the ratio between the quiescent and outburst values of the viscosity parameter must be and the outburst values are . The quiescent value should be then , a value which is also suggested by dwarf nova recurrence times (Livio & Spruit 1991). The DIM code with and gives light curves which are rather dissimilar to those of HT Cas. One should remember, however, that such light curves cannot be reproduced by the standard DIM anyway (Lasota et al. 1995). The possibility of truncated disc in HT Cas should be studied in more details. At the first sight, the reconstructed light-curves do not seem to reflect such a feature (Smak 1994) but the significance of reconstructed points near the white dwarf is not clear (see e.g Vrielmann 1997). Observations which suggest a rather small X-ray emitting region (Mukai et al. 1997) are not in contradiction with the existence of a truncated disc.
It has been speculated that the optically thin emission form quiescent dwarf nova disc could have its origin in a ‘chromosphere’ or a ‘corona’. A corona (Shaviv & Wehrse 1986), i.e. a medium at K cannot produce the observed colours. A chromosphere could be responsible for line emission but it is difficult to see how such a narrow structure could emit a continuum with the observed properties.
Finally, one cannot exclude that the picture of a ‘smooth’ homogenous disc is not an adequate description of quiescent dwarf nova accretion flows.
If HT Cas is indeed the ‘Rosetta stone’ of dwarf nova models we have rather small chances to decipher its hieroglyphs.
Acknowledgments
I.I. and JPL thank Joe Smak for very helpful discussions. We thank Janet Wood for useful informations about observations of HT Cas.
References
Cannizzo, J.K. 1993, in Accretion Disks in Compact Stellar Systems, ed. J.C. Wheeler, (Singapore: World Scientific), p. 6
Cannizzo, J.K. 1997, in Cataclysmic Variables and Related Objects, Proceedings of the 13th North-American Workshop; ed. E. Kuulkers et al. , ASP Conference Series, in press
Cannizzo, J.K. & King, A.R. 1998, ApJ, in press
Dumont, A.-M. Collin-Souffrin, S., King, A.R. & Lasota, J.-P. 1991, A&A, 242, 503
Frank, J., King, A.R. & Raine, D. 1992, Accretion Power in Astrophysics, (Cambridge: CUP)
Gammie, C. & Menou, K. 1997, ApJ, 492, L75
Hameury, J.-M., Lasota, J.-P. & Huré, J.-M., 1997, MNRAS
Hameury, J.-M., Menou, K., Dubus, G., Lasota, J.-P. & Huré, J.-M. 1998, MNRAS, in press
Horne, K. 1993, in Accretion Disks in Compact Stellar Systems, ed. J.C. Wheeler, (Singapore: World Scientific), p. 117
Horne, K., Wood, J.H., Stienning, R.F. 1991, ApJ 378, 271
Idan, I. & Shaviv, G. 1996, MNRAS 281, 604
Idan, I. et al. 1998, in preparation
King, A.R. 1997, in Relativistic Gravitation and Gravitational Radiation ed. J.-A. Marck & J.-P. Lasota, (Cambridge: CUP), p. 105
Lasota, J.-P. 1996, in Cataclysmic Variables and Related Objects, IAU Coll. 158, ed. J.H. Wood et al. (Dordrecht: Kluwer), p. 385
Lasota, J.-P., Hameury, J.-M. & Huré, J.-M., 1995, A&A, 302, L29
Lin, D.N.C., Williams, R.E. & Stover, R.J. 1988, ApJ, 327, 234
Livio, M. & Spruit, H. 1991, A&A, 252, 189
Livio, M. & Pringle J., 1992, MNRAS 259, 23p
Marsh, T. R. 1987, MNRAS, 228, 779
Meyer F. & Meyer-Hofmeister E. 1994, A&A 288, 175
Mineshige, S. & Wood, J.H. 1989, MNRAS, 241, 259
Mukai, K., Wood, J.H., Naylor, T., Schlegel, E.M. & Swank, J.H. 1997, ApJ, 475, 812
Patterson, J. 1981, ApJS, 45, 517
Rutten, R.G.M.R., van Paradijs,J. & Tinbergen, J. 1992, A&A, 260, 213
Shaviv, G. & Wehrse, R. 1986, A&A, 169, L5
Shaviv, G. & Wehrse, R. 1991, A&A, 251, 117
Smak J. 1984, Acta astron., 34, 161
Smak J. 1994, Acta astron., 44, 265
Smak J. 1996, in Cataclysmic Variables and Related Objects, IAU Coll. 158, ed. J.H. Wood et al. (Dordrecht: Kluwer), p. 45
Smak J. 1998, this volume
Tylenda, R. 1981, Acta astron., 31, 127
Vrielmann, S. 1997, PhD Thesis, University of Göttingen
Wade, R.A. 1988, ApJ, 335, 394
Warner, B. 1995, Cataclysmic Variable Stars, (Cambridge: CUP)
Wenzel, W. 1987, Astron. Nachr., 308, 75
Williams, G.A. 1991, AJ, 101, 1929
Williams, R.E. 1980, ApJ, 235, 939
Wood, J.H. 1990, MNRAS, 243, 219
Wood, J.H., Horne, K. & Vennes, S. 1992, ApJ 385, 294
Wood, J.H., Horne, K., Berriman, G. & Wade, R. 1989, ApJ, 341, 974
Wood, J.H., Naylor, T., Hassal, B.J.M. & Ramsayer, T.F. 1995, MNRAS, 273, 772
Wood, J.H., Horne, K., Berriman, G., Wade, R. O’Donoghue, D. & Warner, B. 1986, MNRAS, 219, 629
Zhang, E.-H., Robinson, E.L. & Nather, R.E. 1986, ApJ, 305, 740