03(11.04.1; 11.03.1; 11.03.4 A548; 11.03.4 A3367) \offprintsS. Bardelli (bardelli@astrts.oat.ts.astro.it) 11institutetext: Osservatorio Astronomico di Capodimonte, via Moiariello 16, I-80131, Napoli, Italy 22institutetext: Osservatorio Astronomico di Roma, via Osservatorio 2, I-00040, Monteporzio Catone (RM), Italy 33institutetext: Osservatorio Astronomico di Trieste, via G.B. Tiepolo 11, I-34131, Trieste, Italy 44institutetext: Osservatorio Astronomico di Bologna, via Zamboni 33, I-40126, Bologna, Italy
A redshift survey between the clusters of galaxies A548 and A3367 ††thanks: based on observations collected at the European Southern Observatory, La Silla, Chile
Abstract
In this paper we present the results of a spectroscopic survey of galaxies in an area between the two clusters of galaxies A548 and A3367, suspected to be a close and interacting pair. With the use of multifiber spectroscopy, we measured 180 new velocities of galaxies in the central part of A3367 and in the external regions of A548.
The redshift histogram shows the presence of three velocity peaks, at km/s, km/s and km/s, respectively. For these we estimate the density excess, the mean velocity, and the velocity dispersion.
The first clump corresponds to an elongation of A548: in particular we found a correspondence between the features of this peak and the substructures of A548. The second peak has a velocity dispersion which is typical of clusters and the distribution of its members on the plane of the sky corresponds to the highest density peak in A3367. We therefore suggest that the name A3367 has to be attributed to this clump.
Our general conclusion is that, differently from expected, A548 and A3367 do not form a close pair of merging clusters, since the two structures are at significantly different redshifts. Moreover, we found that the complex dynamical structure of A548 has large coherence, with a projected extension in the range of 1-3 h-1 Mpc.
keywords:
Galaxies: clusters: individual: A548, A3367; Galaxies: clusters of; Galaxies: distances and redshifts1 Introduction
The determination of the galaxy distribution in clusters provides information on the status and the history of these structures through the study of their dynamics. Detailed studies spanning the entire range of morphologies of rich clusters of galaxies are important for understanding the formation and evolution of these systems. In a class of current cosmological models (e.g. cold dark matter dominated), rich clusters are formed hierarchically, by accretion of smaller subunits.
Several clusters are indeed known to present very lumpy morphologies (see e.g. Kriessler & Beers 1997 and references therein) revealing that these systems are in a merging process. The best studied examples are A2256 (Briel, Henry & Böhringer 1992), where a small group is detected in the X-ray band nearby the cluster center, and Coma, where a number of substructures are revealed (Biviano et al. 1996). Among the most spectacular cases are the encounters between clusters of similar richness, as for the A3558 complex (Bardelli et al. 1994, 1996, 1998a, 1998b), where the dynamical processes reach unusual intensities, or the cluster A3528, which is actually split into two merging X-ray emitting regions of similar properties (Schindler 1996).
The study of merging clusters is important because this process is thought to be responsible for a wide number of properties of the cluster galaxy population. Radio halos and relicts of radiosources are found in clusters that visually present some degree of disturbance (Feretti & Giovannini 1996) and Burns et al. (1994) explained as a consequence of a merging event the presence of post-starburst galaxies in the large scale X–ray emitting filament connecting Coma with the NGC4839 group.
A good starting point to individuate merging cluster candidates is that to extract close pairs from supercluster catalogues, as f.i. the list of Zucca et al. (1993), which reports groups of ACO clusters (Abell, Corwin & Olowin 1989) as a function of the density contrast. In this catalogue, the cluster pairs individuated by a density excess are very close systems, where often the nuclei are separated by less than one Abell radius ( h-1 Mpc, hereafter h=Ho/100): one of these pairs is formed by A548 and A3367.
The centers of the two clusters in the ACO catalog are separated on the plane of the sky by 77 arcmin, corresponding to h-1 Mpc at the distance of A548. The separation in velocity was less clear: in fact the cluster A548 is reported to have a mean velocity of km/s (determined on 133 redshifts, Davis et al. 1995), while A3367 had reported a value of km/s (based on 6 velocities, Postman, Huchra & Geller 1992). However, Postman & Lauer (1995) reported a velocity of km/s for the brightest member of A3367, clearly inconsistent with the above mean value.
The cluster A548 [; ] is a cluster of richness class 1 and Bautz-Morgan type III. This cluster has been extensively studied both in the optical and X–ray wavelength. Davis et al. (1995) reported a global velocity dispersion of km/s, but this cluster appears dynamically very complex. From the analysis of a mosaic of ROSAT PSPC observations, Davis et al. (1995) found the presence of three extended sources (dubbed S1, S2 and S3) with luminosities in the range erg/s in the keV band. Performing a substructure analysis of the optical sample, they detected three subcondensations: two of these groups (labelled as and in their table 4b) correspond to the extended X–ray emissions S1 and S2 respectively (see their table 2). These optical subclumps were already found by Escalera et al. (1994) with the use of a wavelet decomposition analysis. They described A548 as a binary cluster, when large spatial scales are considered. Moreover, they detected at smaller scales a central subgroup. These three components can be identified with the , and substructures of Davis et al (1995), respectively. Another indication of the complex dynamical situation of this cluster appears from the different behaviour of galaxies with and without emission lines in their spectra: Biviano et al. (1997) in their analysis of the ENACS survey (Katgert et al. 1996, 1998) found a significant offset between the mean velocities of these two types of objects.
On the contrary, the cluster A3367 was little studied so far. It has coordinates ; , is of richness class 0 and is classified as a Bautz-Morgan type I-II. No other relevant date was found in the literature apart the mean velocity reported above.
For these reasons we decided to concentrate our redshift survey on A3367 and on the region between A3367 and A548, and in this paper we present a sample of 180 new radial velocities.
The paper is organized as follows: in Sect. 2 we present the sample and the data reduction, in Sect. 3 we discuss the dynamical properties of the three peaks found in the sample and finally in Sect. 4 we summarize our results.
2 The sample
2.1 The photometric catalogue
The starting photometric catalogue is the COSMOS/UKST galaxy catalogue of the southern sky (Yentis et al. 1992), obtained from automated scans of UKSTJ plates by the COSMOS machine. We extracted a circular region of diameter, centered on and , containing objects to the limiting magnitude .
Fig. 1a shows the isodensity contours obtained binning the data in 2 2 arcmin cells and smoothing with a Gaussian of 6 arcmin of FWHM. For the two clusters circles of one Abell radius have been drawn around their nominal center. Note that it is already evident that A548 is not a smooth cluster with a single central nucleus, but presents multiple condensations. Inside the Abell circle of A3367 we note a single condensation shifted northward with respect to the nominal center. In Fig. 1b the same isodensity contours are shown with superimposed the OPTOPUS fields positions.
The coordinates of the centers of these fields are listed in columns (2) and (3) of Tab. 1, together with the observation date in column (4).


| FIELD | Date | ||
|---|---|---|---|
| f51a | 25/02/93 | ||
| f51b | 26/02/93 | ||
| f52 | 25/02/93 | ||
| f53 | 26/02/93 | ||
| f61 | 16/10/93 | ||
| f62 | 17/10/93 |
2.2 Observations
Spectroscopic measurements were obtained using the ESO 3.6m telescope at La Silla, equipped with the OPTOPUS multifiber spectrograph (Lund 1986), on the nights of 1993 February 25-26 and October 16-17.
The OPTOPUS multifiber spectrograph is formed by a bundle of 50 optical fibres at the Cassegrain focal plane of the telescope; this field has a diameter of 32 arcmin, and each fibre has a projected size on the sky of 2.5 arcsec. We used the ESO grating 15 with 300 lines/mm and a blaze angle of 4o18′. This grating allows a dispersion of 174 Å/mm in our wavelength range (3700–6100) Å. We used the detector Tektronic 512 512 CCD with a pixel size of 27 m, corresponding to 4.5 Å, i.e. a velocity bin of 270 km/s at 5000 Å; the resolution is Å. Four of the 50 fibres were dedicated to sky measurements, leaving 46 fibres available for the objects.
Fields f51a, f51b, f52 and f53 were observed for 1 hour, split into two half-hour exposures in order minimize the presence of cosmic hits. Fields f61 and f62 were observed only for 1/2 hour. The observing sequence was a 30-s exposure of a quartz halogen white lamp, a 60-s exposure of helium vapour lamp for fields f61 and f62, or 60-s exposure of helium + neon vapour lamp for fields f51, f52 and f53; then the scientific field, and again the arc and the white lamp.
2.3 Data Reduction
The extraction of the one-dimensional spectra was performed using the APEXTRACT package as implemented in IRAF111IRAF is distributed by the National Optical Astronomy Observatories, which is operated by AURA Inc. for the NSF..
Positions and tracing solutions of lamps and objects were determined on the flat field exposures. The procedure we adopted to estimate the relative transmission of each fibre is based on the fitting of a Gaussian profile to the [OI]5577 sky line in each spectrum and on computing the continuum-subtracted flux of this line (Bardelli et al. 1994). If we assume that the flux and the shape of the spectrum of the night sky remain constant in the telescope field, this value is the same in each spectrum apart from the transmission of the fiber, which is a multiplicative factor. After having normalized the spectra, we can subtract the ‘mean sky’ obtained as the average of the 4 sky spectra.
2.4 Redshift data
We have obtained a total of 276 spectra: 45 were not useful for redshift determination ( of the total), because of poor signal–to–noise ratio or badly connected fibers, and 51 turned out to be stars ( of the reliable spectra), leaving us with 180 galaxy redshifts. The galaxies whose spectrum presents detectable emission lines are 79, corresponding to a percentage of of the total.
The radial velocities of galaxies with spectra with absorption lines have been determined using the program XCSAO in the IRAF task RVSAO (Kurtz et al. 1992), which is based on the cross-correlation method of Tonry & Davis (1979). The determination of redshift is done by fitting a parabola to the main peak of the cross-correlation function. Sixteen different templates (eight stars and eight galaxies) were used for the determination of the radial velocities, choosing as better estimate the one which gave the minimum cross-correlation error, defined as:
| (1) |
where is the FWHM of the cross-correlation peak and is the ratio between the height of the correlation peak and the of the antisymmetric part of the correlation function (Kurtz et al. 1992).
To estimate the redshift of spectra with strong emission lines we used the EMSAO program in the IRAF task RVSAO.
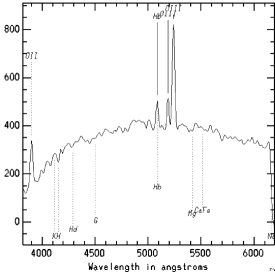
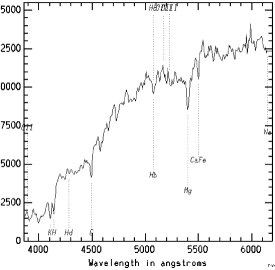
The top panel of Fig. 2 shows an example of a spectrum with strong emission features, with [OII], [H], [OIII], lines, while in the bottom panel of Fig. 2 a spectrum with only absorption lines is presented.
In Tab. 2 - 7 we list the galaxies with redshift determination. Columns (1), (2) and (3) list the right ascension, the declination and the magnitude respectively; column (4) and (5) give the heliocentric velocity () and its internal error (in km/s), from absorption and emission lines respectively. The code in column (6) indicates the presence of emission lines: the symbols a, b, c, d, refer to [OII]3727Å, [H]4861Å, [OIII]4959Å and [OIII]5007Å, respectively.
| (2000) | (2000) | km/s | km/s | notes | |
|---|---|---|---|---|---|
| 05 49 54.0 | -24 23 19.9 | 15.8 | 1310625 | ||
| 05 49 27.0 | -24 46 14.3 | 16.0 | 1336748 | ||
| 05 48 22.7 | -24 33 15.1 | 18.2 | 3043185 | ||
| 05 49 22.2 | -24 35 25.2 | 18.3 | 3077138 | ||
| 05 49 42.6 | -24 41 47.2 | 17.5 | 1378448 | ||
| 05 49 41.1 | -24 34 31.0 | 18.3 | 1964725 | ||
| 05 50 06.4 | -24 23 40.7 | 17.9 | 1380350 | abcd | |
| 05 49 34.6 | -24 30 57.2 | 16.6 | 1963222 | ||
| 05 49 07.6 | -24 34 27.5 | 18.3 | 3059626 | ||
| 05 49 39.7 | -24 25 26.3 | 16.0 | 1223753 | abcd | |
| 05 49 59.8 | -24 28 05.9 | 19.0 | 3079733 | abcd | |
| 05 49 41.3 | -24 32 42.9 | 15.7 | 1336329 | ||
| 05 48 26.6 | -24 42 09.9 | 17.3 | 1336320 | ||
| 05 49 36.3 | -24 30 18.9 | 18.7 | 1983749 | ||
| 05 48 25.5 | -24 41 43.9 | 18.8 | 1395429 | abcd | |
| 05 49 50.8 | -24 39 55.1 | 16.9 | 1328932 | ||
| 05 48 48.6 | -24 22 42.6 | 14.9 | 1189551 | ||
| 05 49 10.2 | -24 38 22.8 | 18.6 | 4206663 | ||
| 05 48 23.1 | -24 32 32.8 | 17.7 | 3026170 | ||
| 05 49 37.5 | -24 32 10.5 | 18.5 | 42783179 | abcd | |
| 05 48 25.5 | -24 43 15.1 | 18.1 | 1395022 | abcd | |
| 05 50 17.9 | -24 28 38.1 | 17.5 | 1189136 | ad | |
| 05 49 37.4 | -24 33 33.2 | 17.9 | 1991321 | ||
| 05 48 50.2 | -24 21 06.9 | 16.2 | 1374130 | ||
| 05 49 39.5 | -24 39 08.2 | 18.8 | 39649105 | ||
| 05 49 26.1 | -24 22 25.5 | 17.4 | 1949820 | ||
| 05 48 37.0 | -24 26 36.8 | 18.6 | 4268862 | ||
| 05 49 14.8 | -24 25 52.1 | 17.8 | 1344759 | bcd | |
| 05 48 22.1 | -24 41 43.7 | 16.8 | 1370677 | ||
| 05 50 12.8 | -24 40 08.6 | 18.9 | 4177415 | abcd | |
| 05 49 41.2 | -24 34 06.4 | 18.1 | 1180360 | ||
| 05 48 48.7 | -24 29 46.0 | 18.6 | 3075828 | ||
| 05 49 53.8 | -24 27 58.7 | 16.6 | 13923110 | ||
| 05 49 20.2 | -24 38 39.2 | 18.6 | 13684136 | ||
| 05 48 42.0 | -24 26 50.3 | 18.7 | 1211969 | abd | |
| 05 50 05.1 | -24 28 47.5 | 16.5 | 1213150 | ||
| 05 49 12.2 | -24 29 59.5 | 18.7 | 5169052 | ||
| 05 49 04.5 | -24 29 01.0 | 17.5 | 13529112 | ||
| 05 50 03.6 | -24 38 14.1 | 15.0 | 1336826 |
| (2000) | (2000) | km/s | km/s | notes | |
|---|---|---|---|---|---|
| 05 49 08.5 | -24 36 49.2 | 20.0 | 5376436 | ||
| 05 49 16.7 | -24 38 47.7 | 20.1 | 4221736 | ||
| 05 48 24.8 | -24 34 23.8 | 20.1 | 3034155 | ||
| 05 50 03.6 | -24 48 00.9 | 20.1 | 4184269 | acd | |
| 05 49 08.4 | -24 44 27.7 | 19.6 | 3003127 | acd | |
| 05 50 16.0 | -24 26 50.6 | 20.1 | 5306080 | a | |
| 05 49 03.4 | -24 19 56.0 | 19.8 | 8012880 | a | |
| 05 50 33.7 | -24 35 35.7 | 19.6 | 4102377 | abcd | |
| 05 48 47.0 | -24 24 14.5 | 19.9 | 4015250 | ab | |
| 05 49 48.0 | -24 26 13.0 | 20.1 | 1726785 | c | |
| 05 49 29.1 | -24 21 22.5 | 20.1 | 1950869 | ||
| 05 50 01.6 | -24 37 33.2 | 19.7 | 1327477 | abcd | |
| 05 48 45.4 | -24 22 12.6 | 19.9 | 6653780 | a | |
| 05 49 58.5 | -24 39 02.4 | 20.0 | 1993217 | acd | |
| 05 48 56.5 | -24 26 15.2 | 19.8 | 8890380 | a | |
| 05 49 30.9 | -24 33 17.8 | 20.2 | 6548328 | abcd | |
| 05 48 36.6 | -24 46 25.4 | 19.8 | 50943120 | ||
| 05 50 33.0 | -24 34 18.7 | 20.0 | 3493022 | ab | |
| 05 48 38.1 | -24 25 11.6 | 19.8 | 3118272 | ||
| 05 50 19.4 | -24 38 06.4 | 19.9 | 8675684 | ||
| 05 49 58.0 | -24 29 21.7 | 20.0 | 8163175 | 8161280 | a |
| 05 48 51.7 | -24 21 40.5 | 19.7 | 6652691 | 6628580 | a |
| 05 48 49.4 | -24 21 49.2 | 19.7 | 1359856 | abcd | |
| 05 49 42.0 | -24 21 14.7 | 20.0 | 6695452 | ||
| 05 49 39.0 | -24 23 46.6 | 19.8 | 5135662 |
| (2000) | (2000) | km/s | km/s | notes | |
|---|---|---|---|---|---|
| 05 49 10.9 | -24 53 17.3 | 17.5 | 1974847 | ||
| 05 49 08.9 | -25 13 50.5 | 19.8 | 13679106 | ||
| 05 49 36.2 | -24 51 09.5 | 17.3 | 1339451 | abcd | |
| 05 48 26.3 | -25 12 47.1 | 17.2 | 11039105 | ||
| 05 48 48.2 | -25 11 48.8 | 18.9 | 1194984 | acd | |
| 05 48 36.7 | -24 54 18.4 | 19.1 | 5087386 | ||
| 05 49 24.5 | -25 02 09.4 | 19.1 | 3009358 | acd | |
| 05 49 33.7 | -25 07 09.6 | 18.3 | 1695981 | 1689049 | acd |
| 05 49 54.5 | -25 03 54.6 | 18.9 | 12048131 | ||
| 05 49 29.6 | -25 00 53.2 | 18.0 | 13255120 | ||
| 05 49 55.1 | -24 56 55.4 | 18.0 | 1344993 | ||
| 05 49 34.4 | -25 04 33.3 | 16.9 | 1435033 | ||
| 05 49 15.3 | -25 07 57.7 | 19.2 | 11727104 | ||
| 05 48 36.3 | -25 01 19.1 | 19.7 | 5054267 | ||
| 05 48 37.5 | -24 53 33.6 | 18.8 | 3036126 | abcd | |
| 05 48 35.9 | -25 10 09.7 | 18.8 | 2240435 | ||
| 05 48 22.7 | -25 12 17.0 | 18.1 | 1318725 | ||
| 05 49 22.9 | -24 58 50.4 | 19.5 | 1272141 | ad | |
| 05 48 41.1 | -25 09 13.4 | 18.0 | 1233291 | ||
| 05 48 58.5 | -25 06 08.5 | 19.7 | 2240073 | abcd | |
| 05 50 01.2 | -24 53 29.7 | 17.6 | 1352193 | ||
| 05 48 04.8 | -24 57 34.5 | 19.4 | 52703124 | abcd | |
| 05 49 09.5 | -25 03 22.5 | 19.3 | 1221354 | abd | |
| 05 48 30.0 | -24 50 20.6 | 18.9 | 11886100 | ac | |
| 05 48 14.5 | -25 07 54.8 | 19.6 | 37211150 | ad | |
| 05 48 58.5 | -24 49 56.1 | 19.4 | 29678129 | abcd | |
| 05 48 47.0 | -25 09 16.8 | 18.6 | 1322966 | ac | |
| 05 49 40.6 | -25 06 27.5 | 18.3 | 4857472 | ||
| 05 49 18.6 | -25 15 22.1 | 19.6 | 1232095 | ||
| 05 49 23.6 | -25 03 36.1 | 19.7 | 2742958 | ac | |
| 05 48 40.0 | -24 59 20.0 | 17.0 | 1352355 | ||
| 05 49 40.8 | -25 10 56.0 | 19.8 | 11483480 | a | |
| 05 48 30.3 | -24 52 08.8 | 19.8 | 1322958 | abcd | |
| 05 48 02.5 | -25 01 20.5 | 16.2 | 12018131 | ac |
| (2000) | (2000) | km/s | km/s | notes | |
|---|---|---|---|---|---|
| 05 49 05.5 | -24 06 43.5 | 19.3 | 3114531 | ||
| 05 48 49.2 | -24 15 18.8 | 17.6 | 2939239 | ||
| 05 50 30.9 | -24 05 50.7 | 19.1 | 3065530 | ||
| 05 48 51.6 | -24 06 45.8 | 19.3 | 3028336 | ||
| 05 48 55.1 | -24 13 17.0 | 18.8 | 3151831 | ||
| 05 49 15.7 | -24 01 41.6 | 18.9 | 1381056 | ad | |
| 05 49 20.8 | -24 03 49.8 | 17.1 | 3005761 | ||
| 05 48 53.5 | -24 02 07.2 | 19.4 | 3050696 | ||
| 05 48 47.5 | -24 10 52.4 | 20.6 | 3058836 | ||
| 05 48 49.4 | -24 09 12.6 | 19.4 | 3107842 | ||
| 05 49 26.7 | -24 17 06.9 | 17.8 | 2925479 | ||
| 05 49 04.8 | -24 04 29.3 | 16.0 | 1361859 | ||
| 05 49 55.3 | -24 05 31.2 | 18.1 | 3008073 | abcd | |
| 05 49 17.3 | -24 18 31.9 | 19.3 | 7734927 | ab | |
| 05 48 45.9 | -24 13 33.4 | 19.1 | 3101449 | ||
| 05 50 03.0 | -24 01 20.0 | 16.5 | 898184 | 891715 | abcd |
| 05 50 20.7 | -24 16 15.4 | 19.4 | 4207363 | ||
| 05 49 55.3 | -24 08 03.3 | 19.2 | 3012123 | abcd | |
| 05 48 38.1 | -24 20 42.8 | 19.4 | 3120629 | ||
| 05 49 13.4 | -24 02 46.0 | 19.3 | 9340460 | ||
| 05 48 50.8 | -24 20 21.1 | 16.5 | 1994425 | ||
| 05 48 58.1 | -24 05 06.7 | 18.9 | 3047228 | ||
| 05 48 57.5 | -24 17 25.1 | 18.1 | 3142943 | ||
| 05 50 29.7 | -24 12 45.1 | 19.1 | 1387037 | abcd | |
| 05 48 41.2 | -24 15 01.2 | 18.1 | 3073632 | ||
| 05 48 36.8 | -24 07 04.5 | 19.5 | 3104071 | ||
| 05 49 02.0 | -24 18 06.2 | 17.1 | 1312065 | abd | |
| 05 49 17.8 | -23 56 52.7 | 19.5 | 2994039 | ||
| 05 49 07.7 | -24 09 30.9 | 18.9 | 3024238 | ||
| 05 48 57.0 | -24 09 53.4 | 17.5 | 29551112 | 29345111 | ad |
| 05 49 25.1 | -24 03 23.5 | 18.7 | 4208669 | 4213680 | a |
| 05 49 43.9 | -24 10 55.1 | 18.3 | 31847110 | ||
| 05 49 01.7 | -24 04 44.3 | 18.3 | 3077633 |
| (2000) | (2000) | km/s | km/s | notes | |
|---|---|---|---|---|---|
| 05 51 23.0 | -25 23 13.8 | 15.9 | 4280644 | ||
| 05 50 15.9 | -25 16 15.4 | 19.0 | 1169668 | ||
| 05 51 28.1 | -25 24 16.9 | 18.3 | 4042692 | 4038380 | a |
| 05 51 23.7 | -25 24 59.0 | 19.9 | 4158398 | ||
| 05 50 22.3 | -25 18 09.2 | 17.2 | 1159528 | ||
| 05 51 18.0 | -25 15 40.8 | 17.9 | 1212440 | abcd | |
| 05 51 55.3 | -25 14 14.2 | 19.6 | 4481120 | ad | |
| 05 50 01.8 | -25 18 49.2 | 19.1 | 1177962 | acd | |
| 05 51 07.9 | -25 09 31.7 | 17.9 | 1176973 | abcd | |
| 05 52 04.2 | -25 12 22.5 | 19.7 | 45116112 | ||
| 05 51 52.9 | -25 12 16.1 | 19.2 | 4578866 | ||
| 05 50 13.7 | -25 20 11.6 | 19.6 | 3035658 | ||
| 05 50 57.1 | -25 01 13.6 | 17.0 | 2627953 | 2622835 | bcd |
| 05 51 16.6 | -25 19 45.4 | 19.6 | 4217261 | ||
| 05 50 17.0 | -24 58 37.4 | 19.9 | 17715106 | ad | |
| 05 50 14.2 | -25 13 55.0 | 18.2 | 1173969 | ||
| 05 51 13.2 | -25 24 22.3 | 18.7 | 1165245 | abcd | |
| 05 50 47.1 | -25 04 50.3 | 20.6 | 2627782 | ||
| 05 50 41.0 | -25 03 56.6 | 19.3 | 5952580 | a | |
| 05 51 14.9 | -25 24 57.3 | 19.6 | 17674123 | abcd | |
| 05 50 15.6 | -25 10 02.8 | 18.7 | 2903534 | abcd | |
| 05 50 42.0 | -25 20 04.4 | 19.7 | 6122056 | ||
| 05 51 19.9 | -25 12 19.8 | 19.1 | 4495880 | a | |
| 05 51 46.0 | -25 18 32.5 | 17.7 | 1342787 | 1342886 | a |
| 05 50 31.0 | -25 01 34.4 | 18.5 | 1181152 | ad | |
| 05 51 28.4 | -25 18 49.0 | 19.8 | 4658596 | ab | |
| 05 49 59.7 | -25 12 48.1 | 19.3 | 1694868 | abcd | |
| 05 50 17.3 | -25 02 05.4 | 18.3 | 4033735 | ||
| 05 50 58.0 | -24 56 24.2 | 17.4 | 2904951 | ||
| 05 50 01.8 | -25 08 04.5 | 19.7 | 12402132 | a | |
| 05 52 03.1 | -25 03 22.1 | 17.2 | 41200105 | ||
| 05 50 46.0 | -25 15 40.7 | 17.7 | 1188364 | ||
| 05 51 31.6 | -25 23 24.6 | 19.4 | 4121044 |
| (2000) | (2000) | km/s | km/s | notes | |
|---|---|---|---|---|---|
| 05 50 39.5 | -24 28 33.7 | 19.7 | 52479121 | ||
| 05 50 56.6 | -24 34 45.0 | 17.8 | 1141739 | abcd | |
| 05 51 38.5 | -24 31 02.5 | 17.5 | 1321928 | ||
| 05 51 01.0 | -24 38 24.4 | 18.9 | 1359465 | ad | |
| 05 51 20.3 | -24 40 20.0 | 20.0 | 5318591 | ||
| 05 50 20.8 | -24 48 31.4 | 18.9 | 4855678 | ||
| 05 50 17.3 | -24 52 30.0 | 20.0 | 1957517 | abd | |
| 05 50 51.9 | -24 52 28.2 | 19.2 | 1953531 | abcd | |
| 05 51 36.5 | -24 46 04.5 | 20.2 | 2614190 | ad | |
| 05 51 46.5 | -24 35 31.4 | 18.1 | 2835761 | 2839876 | a |
| 05 51 02.5 | -24 46 20.4 | 18.8 | 3054947 | ||
| 05 50 30.0 | -24 30 50.5 | 20.3 | 4018360 | abcd | |
| 05 50 13.7 | -24 51 10.4 | 20.0 | 6913080 | a | |
| 05 51 01.4 | -24 49 48.0 | 20.3 | 6647480 | a | |
| 05 51 03.1 | -24 54 17.2 | 18.7 | 1772480 | a | |
| 05 50 38.3 | -24 24 58.4 | 20.1 | 8802298 |
We remember that the cross-correlation errors are only internal formal errors. In order to have true statistical errors, these values have to be multiplied for the factor 1.53 found by Vettolani et al. (1998) comparing multiple observations of the same galaxies: after this correction, the average statistical error on our velocities is 95 km/s. If one wants to take into account also the uncertainties introduced by the different reduction procedures, the factor is slightly larger and has the value of (see Bardelli et al. 1994).
In order to check the zero point precision of our velocity scale, we considered the histogram of the measured velocities of the stars misclassified as galaxies (Fig. 3), which are expected to have a zero mean velocity. Considering only the 41 spectra with the higher signal-to-noise ratio, we found km/s ( km/s): this small systematic effect will be neglected in the following analysis, since the errors associated to the galaxy velocities are larger. However, we can not exclude that the value of is completely due to bulk motions of stars in this region of the sky.

Very recently, Cappi et al. (1998), analysing the ESP survey (Vettolani et al. 1997, 1998), noted a systematic difference between the velocities estimated from the emission lines and the cross-correlation for the same galaxy, with an average difference of km/s (obtained from more than 700 galaxies). Our observations are taken in the same instrumental configuration of the ESP survey and can give an independent estimate of this effect, although with a smaller sample. On the basis of 10 galaxies, we find km/s, consistent within the errors with the result of Cappi et al. (1998).
3 Discussion
In Fig. 4a the histogram of the galaxy velocities is shown. It is clear the presence of at least three peaks (labelled as A, B, C in the figure): the first is at a velocity of km/s, the second and the third at km/s and km/s, respectively. Peak A is at the same velocity of A548 and presents a clear bimodality.


Although no significant differences (through a K-S test) are found between the overall distributions of galaxies with and without emission lines, a more detailed analysis of the three peaks reveals that the two distributions inside the single peaks are in fact different (see Fig.4b). In particular, for peak A it is evident a separation in velocity, being the population of emission line objects dominant in the clump at lower velocity: the percentage of emission line galaxies with respect to the total in this clump is , while it is in the higher velocity clump. Because galaxies with and without emission lines have different luminosity functions (Zucca et al. 1997), it could be suspected that their different distribution is a consequence of a change in the relative values of their selection functions: however, the width of peak A is relatively narrow (less than km/s) and therefore this effect is more likely due to a real variation in morphological composition in the two subclumps.
We estimated the dynamical parameters (mean velocity and velocity dispersion) of the three peaks with the biweight estimators of location and scale (Beers et al. 1990). The advantage of these estimators, with respect to the standard mean and dispersion, is that of minimizing biases from interlopers, giving less weight to data with higher distance from the median. The confidence intervals of the two estimators are calculated boostrapping the data with 100 random catalogs. In order to find the velocity range in which the cluster members lie, we have assumed that the velocity distribution of cluster galaxies is Gaussian, as expected when the system has undergone a violent relaxation (see details in Bardelli et al. 1994).
For the case of peak A, in which the presence of a substructure was suspected on the basis of both a visual inspection of the velocity histogram and the shape estimators , , and (see Bird & Beers 1993), we checked if the distribution is consistent with a single Gaussian or it is bimodal applying the KMM test (Ashman et al. 1994), using the program kindly provided by the authors. This test gives the likelihood ratio between the hypothesis that the dataset is better described by the sum of two Gaussians and the null hypothesis that the dataset is better described by a single Gaussian.
In Tab. 8, we report the dynamical parameters for the velocity excesses found in our sample (see the discussion below). Column (1) refers to the peak identification, column (2) reports the number of velocities used, columns (3) and (4) are the estimated mean velocity and velocity dispersion.
| Peak | N | (km/s) | (km/s) |
|---|---|---|---|
| Peak A | 64 | 12866150 | 869 78 |
| Clump 1 | 28 | 11951116 | 26759 |
| Clump 2 | 36 | 13498111 | 26052 |
| Peak B | 40 | 30477107 | 602148 |
| Peak C | 17 | 41603 215 | 849217 |
3.1 Peak A
Peak A, formed by 64 galaxies, is at the same velocity of A548 and has km/s and km/s. The shape estimators and revealed a significant deviation from the null hypothesis of Gaussianity (at more than significance level). The KMM test revealed that the distribution is significantly better described by two Gaussians, both in the homoscedastic and in the heteroshedastic case. Assigning the objects to the two groups on the basis of the a posteriori probability given by the KMM algorithm (see Ashman et al. 1994) and estimating the dynamical parameters with the biweight estimators, we found km/s and km/s (based on 28 velocities) and km/s and km/s (based on 36 objects). Fig. 5 shows a close up of the velocity distribution of galaxies in peak A, with superimposed the two Gaussians of parameters , and , . No significant differences are found, inside each clump of peak A, between the dynamical parameters of galaxies with and without emission lines.


These mean velocities can be compared with those of the subclumps found by Davis et al. (1995) in A548. Our value of is well consistent with their Clump (see their table 4b). Our is 2.6 different from the mean velocity of their Clump : however assuming that the error on the Davis et al. determination (not reported in their paper) could be similar to ours, the discrepancy may be reduced to less than 1 . Moreover, our values are well in agreement with those reported by Escalera et al. (1994).
More noticeable is the difference in the velocity dispersions. Clumps and have values of km/s and km/s respectively, while we estimated km/s for both groups. This fact could be an indication of a dependence of the velocity dispersion on the distance from the group centers.
The dynamical situation of peak A is therefore very similar to that of A548 and this peak has to be considered an extension of the nearby cluster rather than a separated entity. In particular, the subcondensation of peak A at lower velocity is part of Clump , while the higher velocity group of peak A is associable to Clump .
In order to see the relative distance of the clumps detected in A548 from our galaxies, we plotted on the isodensity contours the positions of their centers and the distribution on the sky of our sample. In Fig. 6 stars represent galaxies with km/s and triangles refer to objects with km/s. The big crosses are the reported centers of the extended emissions found in the ROSAT observations labelled as S1 and S2 in table 2 of Davis et al. and coincident with their optical Clumps and . Their source S3 falls outside the figure. We reported also the position of their Clump as an asterisk. Note the good coincidence between these positions and peaks in the density field.
The extension in A3367 of Clump of Davis et al. seems to have two condensations (see stars in Fig. 6) at , and , , at the distances of and arcmin from the corresponding substructure in A548, respectively.
The extension in A3367 of Clump (see triangles in Fig. 6) is more smooth and spans all the distances between and from its center, corresponding to 2-3 h-1 Mpc.
Finally we note that the mean velocity reported by Postman et al. (1992) for A3367 is consistent with the redshift of peak A. The velocity of the brightest cluster member (Postman & Lauer 1995) reveals that this galaxy is part of the higher velocity clump of peak A: therefore this galaxy is probably associated to A548 rather than to A3367.
3.2 Peaks B and C
The estimated dynamical parameters of the second peak seen in the redshift histogram are km/s and km/s, based on 40 velocities. The percentage of emission line galaxies is . In Fig. 6, the objects belonging to this structure are plotted as black dots and seem to be concentrated around a density peak at and . The shape estimators indicate that the distribution is consistent with being a Gaussian. Given the fact that this density excess is the largest one inside one Abell radius from the nominal center of A3367 and considering that its velocity dispersion is typical of a cluster, we suggest that the name A3367 is in fact to be attributed to peak B.
Finally, the estimated mean velocity and velocity dispersion for peak C are km/s and km/s, determined with 17 objects. The Gaussianity of the distribution can not be excluded.
4 Summary
We have presented the results of a redshift survey in an area between the Abell clusters A548 and A3367. These two clusters have been suspected to be a close pair and therefore candidates to undergo a merging process.
We obtained 180 new galaxy velocities with the use of multifiber spectroscopy, of which presents emission lines. The redshift histogram shows clearly three peaks at km/s, km/s and km/s: for each of them we have estimated the dynamical parameters.
The first structure (peak A) is at the velocity of A548 and could be considered as an extension of this clusters. In particular, this peak is formed by two substructures, corresponding to two subclusters in A548 revealed by Davis et al. (1995) both in the optical distribution of galaxies and in a ROSAT X-ray map. The velocity dispersions of our two clumps in peak A are significantly smaller than those determined in the subclumps of Davis et al., while the mean velocities are in agreement.
Peak B has km/s and a velocity dispersion of km/s; the distribution of its members on the plane of the sky corresponds to the highest density excess of A3367: for this reason we suggest that the name A3367 is in fact to be attributed to this clump. The mean velocity reported for A3367 by Postman et al. (1992) is based on galaxies belonging to peak A, and therefore to an extension of A548 rather than to A3367.
Our general conclusion is that A548 and A3367 is not a close pair of merging clusters, being the two structures at significantly different redshift. However, we found that the complex dynamical structure of A548 has large coherence, with a projected extension in the range of 1-3 h-1 Mpc.
Acknowledgements.
We thank M. Mignoli and D. Maccagni for having observed fields 61 and 62, and H.Böhringer for his help with the photometric catalogue. This research has made use of the NASA/IPAC Extragalactic Database.References
- [1] Abell, G.O., Corwin, H.G., Olowin, R.P., 1989, ApJSS 70, 1 [ACO]
- [2] Ashman, K.M., Bird, C.M., 1994, AJ 108, 2348
- [3] Bardelli, S., Zucca, E., Vettolani, G., Zamorani, G., Scaramella, R., Collins, C.A., MacGillivray, H.T., 1994, MNRAS 267, 665
- [4] Bardelli, S., Zucca, E., Malizia, A., Zamorani, G., Scaramella, R., Vettolani, G., 1996, A&A 305, 435
- [5] Bardelli, S., Zucca, E., Zamorani, G., Vettolani, G., Scaramella, R., 1998a, MNRAS 296, 699
- [6] Bardelli, S., Pisani, A., Ramella, M., Zucca, E., Zamorani, G., 1998b, MNRAS in press
- [7] Beers, T.C., Flynn, K., Gebhart, K., 1990, AJ 100, 32
- [8] Bird, C.M., Beers, T.C., 1993, AJ 105, 1596
- [9] Biviano, A., Durret, F., Gerbal, D., Le Fevre, O., Lobo, C., Mazure, A., Szelak, E., 1996, A&ASS 111, 265
- [10] Biviano, A., Katgert, P., Mazure, A., Moles, M., den Hartog, R., Perea, J., Focardi, P., 1997, A&A 321, 84
- [11] Briel, U., Henry, J.P., Böhringer, H., 1992, A&A 259, L1
- [12] Burns, J.O., Roettiger, K., Ledlow, M., Klypin, A., 1994, ApJ 427, L87
- [13] Cappi, A., et al., 1998, A&A in press
- [14] Davis, D.S., Bird, C.M., Mushotzky, R.F., Odewahn, S.C., 1995, ApJ 440, 48
- [15] Escalera, E., Biviano, A., Girardi, M., Giuricin, G., Mardirossian, F., Mazure, A., Mezzetti, A., 1994, ApJ 423, 539
- [16] Feretti, L., Giovannini, G., 1996, in Extragalactic Radio Sources, IAU Symp. 175, R. Fanti, Fanti, C., Ekers, R., Padrielli, L., eds, Kluwer Ac. Publ., p.333
- [17] Katgert, P., et al., 1996, A&A 310, 8
- [18] Katgert, P., Mazure, A., den Hartog, R., Adami, C., Biviano, A., Pera, J., 1998, A&ASS 129, 399
- [19] Kriessler, J.R., Beers, T.C., 1997, AJ 113, 80
- [20] Kurtz, M.J., Mink, D.J., Wyatt, W.F., Fabricant, D.G., Torres, G., Kriss, G.A., Tonry, J.L., 1992, in Astronomical Data Analysis Software and Systems I, Worrall, D.M., Biemesderfer, C., and Barnes, J., eds., ASP conference series vol.25 p.432
- [21] Lund, G., 1986, OPTOPUS-ESO operating manual N.6
- [22] Postman, M., Huchra, J.P., Geller, M.J., 1992, ApJ 384, 404
- [23] Postman, M., Lauer, T.R., 1995, ApJ 440, 28
- [24] Schindler, S., 1996, MNRAS 280, 309
- [25] Tonry, J., Davis, M., 1979, AJ 84, 1511
- [26] Vettolani, G., et al., 1997, A&A 325, 954
- [27] Vettolani, G., et al., 1998, A&ASS in press
- [28] Yentis, D.J., Cruddace, R.G., Gursky, H., Stuart, B.V., Wallin, J.F. MacGillivray H.T., Collins, C.A., 1992, in Digitized Optical Sky Surveys, MacGillivray, H.T. & Thomson, E.B. eds., Kluwer, Dordrecht, p. 67
- [29] Zucca, E., Zamorani, G., Scaramella, R., Vettolani, G., 1993, ApJ 407, 470
- [30] Zucca, E., et al., 1997, A&A 326, 477