Discovery of KiloHertz Quasi-Periodic Oscillations in the Z source GX 51
Abstract
We discovered two simultaneous kHz quasi-periodic oscillations (QPOs) in the bright low-mass X-ray binary and Z source GX 51 with the Rossi X-ray Timing Explorer. In the X-ray color-color and hardness-intensity diagram a clear Z track is traced out, which shifted between observations. The frequencies of the two kHz QPOs increased from 215 Hz and 500 Hz on the left part of the horizontal branch to 700 Hz and 890 Hz, respectively, on the upper part of the normal branch. With increasing frequency the FWHM and rms amplitude (8.6–60 keV) of the higher-frequency kHz QPO decreased from 300 to 30 Hz , and from 6.6 to 2.4%, respectively. The FWHM and amplitude of the lower-frequency kHz QPO (50–100 Hz and 3–4% rms) did not correlate with the position of the source on the Z track. The kHz QPO separation was consistent with being constant at 29811 Hz. Simultaneously with the kHz QPOs horizontal branch oscillations (HBOs) were detected with frequencies between 18 and 56 Hz.
keywords:
accretion, accretion disks — stars: individual (GX 51) — stars: neutron — X-rays: starsKiloHertz Quasi-Periodic Oscillations in GX 51 \slugcommentSubmitted to ApJ Letters, June 1998
1 Introduction
The bright low-mass X-ray binary (LMXB) and Z source (Hasinger & van der Klis 1989) GX 51 traces out a clear Z track in the X-ray color-color diagram (CD). The limbs of this track are called the horizontal branch (HB), normal branch (NB), and flaring branch (FB). It is thought (e.g., Hasinger & van der Klis 1989) that the mass accretion rate () increases when the source moves from the left end to the right end of the HB, down the NB, and onto the FB. Two types of quasi-periodic oscillations (QPOs) were so far detected in GX 51 : on the HB oscillations called HBO were detected with a frequency between 13 and 50 Hz (van der Klis et al. 1985), and on the NB oscillations called NBO with a frequency of 6 Hz (e.g., Lewin et al. 1992). No QPOs were detected on the FB of GX 51.
Recent, two simultaneously kHz QPOs were discovered in the Z sources Sco X-1 (van der Klis 1996a; 1997), GX 172 (Wijnands et al. 1997b), Cyg X-2 (Wijnands et al. 1998), GX 3400 (Jonker et al. 1998), and GX 3492 (Zhang, Strohmayer, & Swank 1998). The properties of these QPOs are remarkably similar to each other. They are best detected on the HB and the upper part of the NB. So far, Sco X-1 is the only Z sources in which kHz QPOs have been detected on the lower part of the NB and the FB. The frequencies of the kHz QPOs increase from the left end of the HB to the upper part of the NB. In Sco X-1, their frequencies continue to increase as the source moves down the NB and onto the lower part of the FB. Similar kHz QPOs have been detected (e.g. Strohmayer et al. 1996; Berger et al. 1996; Zhang et al. 1996) in the less luminous LMXBs, called the atoll sources (Hasinger & van der Klis 1989). The many similarities (e.g., the frequencies and the dependence of the kHz QPO parameters on inferred ) between the kHz QPOs detected in the Z and atoll sources suggest that these QPOs are produced by the same physical mechanism in both types of LMXBs (see van der Klis 1998 for a review of kHz QPOs).
In this paper we report the discovery of two simultaneous kHz QPOs in the Z source GX 51. A preliminary announcement of the discovery of the kHz QPO was already made by van der Klis et al. (1996b).
2 Observations and Analysis
We observed GX 51 on 1996 November 2, 6, and 16 (the AO1 data), and on 1997 May 30, June 5, and July 25 (the AO2 data) using the proportional counter array onboard the Rossi X-ray Timing Explorer (RXTE). We obtained a total of 102 ksec of good data. During 17 % of the observing time only 3 or 4 out of the 5 detectors were active. In constructing the CD and the hardness-intensity diagrams (HIDs) we used only the data of the three detectors that were always on. For the power spectral analysis we used all available data. Data were obtained in 129 photon energy channels (2–60 keV) with a time resolution of 16 s. Simultaneous data were collected in two photon energy bands (2–8.6 and 8.6–60 keV; the AO1 data) or four (2–5.0, 5.0–6.4, 6.4–8.6, and 8.6–60 keV; the AO2 data) with a time resolution of 122 s. The CD and HIDs were constructed using the 16 s data; power density spectra were calculated using the 122 s data.
To determine the properties of the kHz QPOs, we fitted the 64–4096 Hz power density spectra with a function containing one or two Lorentzians (to represent the kHz QPOs), a constant plus a broad sinusoid (the dead-time modified Poisson level; Zhang et al. 1995), and sometimes an extra Lorentzian with a centroid frequency below 50 Hz to represent the power spectral continuum below 200 Hz. The Very Large Event (van der Klis et al. 1997) window was set to 55 s. Its effect on the Poisson noise was small and could be incorporated in the broad sinusoid. The properties of the HBOs and the NBOs were determined by fitting the 0.125–192 Hz power density spectra with one or two Lorentzians (the HBO and its second harmonic; the NBO), and an extra Lorentzian (with a centroid frequency 0 Hz) to represent the underlying continuum.
The uncertainties in the fit parameters were determined using and upper limits using , corresponding to 95% confidence levels. Upper limits on the kHz QPOs amplitude were determined using a FWHM of 150 Hz. When only one of the kHz QPOs was detected, the upper limit on the other kHz QPO was determined by fixing its frequency to the frequency of the detected kHz QPO plus or minus (depending on which kHz QPO was detected) the mean peak separation. Upper limits on the amplitude of the HBO and its second harmonic were determined using a FWHM of 10 Hz or 20 Hz, respectively, and the frequency of the second harmonic was fixed at twice the frequency of the HBO.
In the CD and the HIDs, the soft color is defined as the logarithm of the 3.5–6.4 keV/2.0–3.5 keV count rate ratio, the hard color as the logarithm of the 9.7–16.0 keV/6.4–9.7 keV count rate ratio, and the intensity is the logarithm of the 2.0–16.0 keV count rate. By using logarithmic values for the colors and the intensity, the parameterization (see Section 3) does not depend on the values of those quantities but only on their variations (Wijnands et al. 1997a). The count rates used in the diagrams are background-subtracted but not dead-time corrected. The dead-time correction is 3–5 %.
3 Results
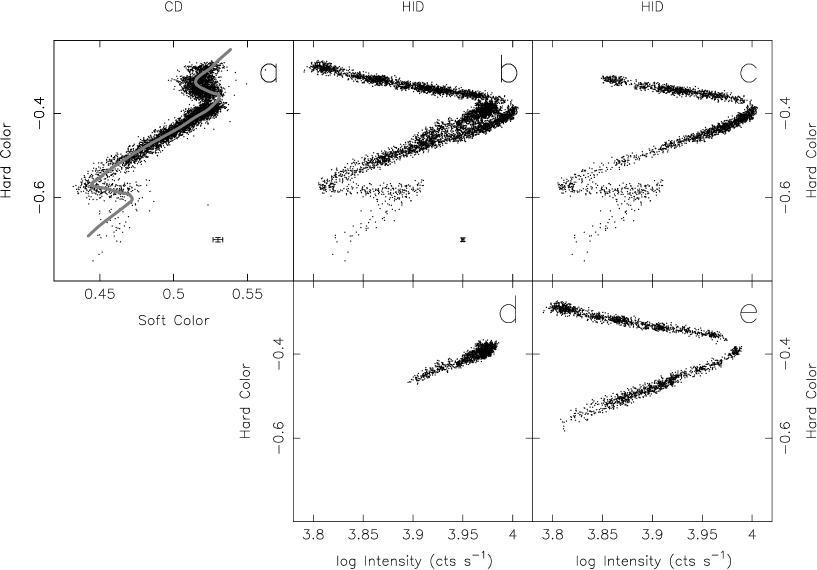
The CD and HID of all data combined is shown in Figures 1a and b, respectively. Clearly, in the HID (Fig. 1b) the Z track is multiple. The reason for this is that it shifted slightly between observations. The AO1 data form one Z track with an extra branch trailing off the FB (Fig. 1c). The AO2 data are located at three different places in the HID. The 1997 July 25 data (Fig. 1e) show a HB and NB which are displaced from the AO1 track to lower count rates. The upper NBs of the AO1 and AO2 data do not fall on top of each other, but the lower NBs do (Fig. 1b), indicating that the NB/FB vertex moved around less than the HB/NB vertex. The 1997 May 30 and June 5 data cover a segment of the NB (Fig. 1d) located slightly to the right of the 1997 July 25 NB. The rapid X-ray variability (see below) confirms that GX 51 was on the upper part of the NB during the 1997 May 30 and June 5 observations. In the CD (Fig. 1a) the Z track is clearly visible with the extra branch trailing the FB and a slight upturn of the HB, which is only marginally visible in the HIDs (Fig. 1b). The motion of the Z track is in the CD obscured by the errors in the X-ray colors.
Because of the motion of the Z track in the HID, we decided to analyse the power spectra of the AO1, the May/June AO2 and the July AO2 data (hereafter referred to as the AO2 data, unless otherwise mentioned) separately. We selected the power density spectra according to the position of GX 51 on the Z track in the HIDs of the AO1 (Fig. 1c) and AO2 (Fig. 1e) data, and measured for each selection the average position of GX 5–1 along the Z track using the parameterization (see e.g. Wijnands et al. 1997a) applied to the combined CD (Fig. 1a). The errors on the values are the standard deviation of each selection.
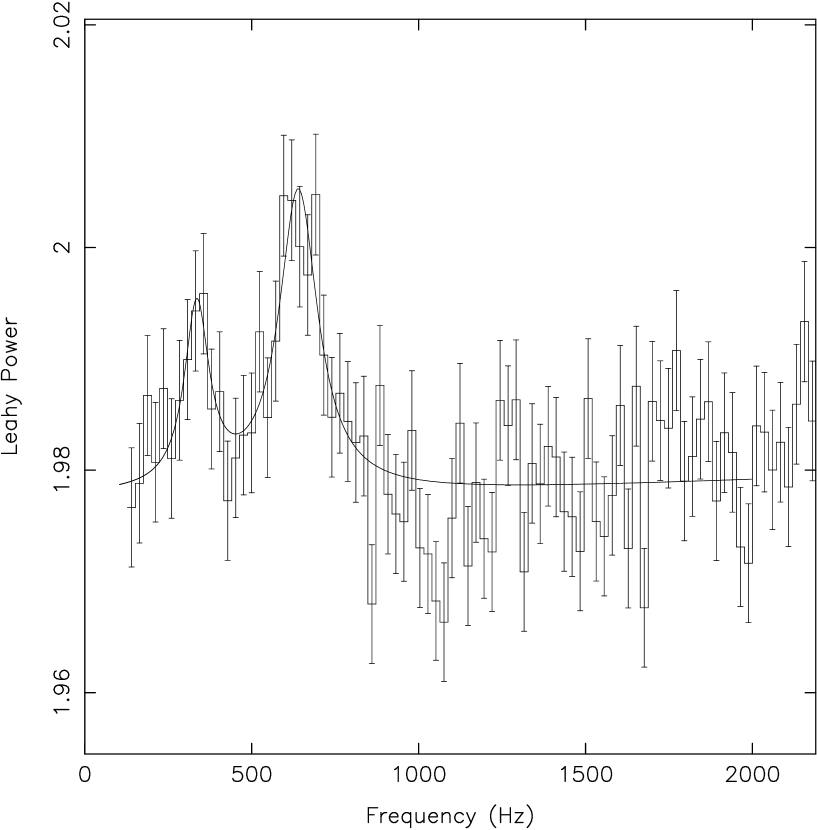
Two simultaneous kHz QPOs were detected in the AO1 and AO2 HB and upper NB data (Fig. 2). These kHz QPOs were most significant in the highest photon energy band (8.6–60 keV). As adding the lower energy data did not improve the significance, we used the 8.6–60 keV energy band throughout our analysis. The rms amplitude upper limits and the detected values of the kHz QPOs at different photon energies are displayed in Table 1. Note, that not all kHz QPO detections were highly significant. For example, the three detections of the kHz QPOs in the AO1 data with the highest value (see Fig. 3a) are only significant at the 1.7–2.3 level.
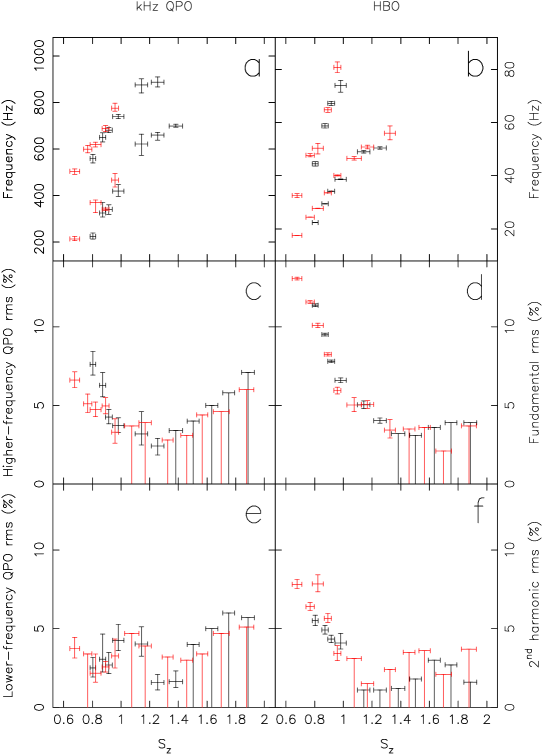
The properties of the kHz QPOs versus are shown in Figure 3. The two simultaneous kHz QPO peaks increased in frequency (Fig. 3a) from the left end of the HB (500 Hz and 215 Hz, respectively) to the HB/NB vertex and the upper part of the NB (890 Hz and 700 Hz). Over this interval the rms amplitude (Fig. 3c) and the FWHM of the higher-frequency peak decreased from 6.6% to 2.4%, and from 300 Hz to 30 Hz, respectively. The rms amplitude (3–4 %; Fig. 3e) and FWHM (50–100 Hz) of the lower-frequency kHz QPO show no clear relation with . In the combined AO2 1997 May 30 and June 5 data kHz QPOs were detected only on the upper part of the NB, with an rms amplitude, FWHM, and frequency of 2.00.4%, 93Hz, and 557Hz for the lower-frequency kHz QPO, and 2.4%, 122Hz, and 856Hz for the higher-frequency kHz QPO, respectively. Lower down the NB, the upper limits on the kHz QPOs were 2.2% rms and 3.4% rms for the lower- and higher-frequency kHz QPOs, respectively. During the AO1, the AO2 May/June and the AO2 July data the peak separation was consistent with being constant at 29717 Hz, 29811 Hz, and 29915 Hz, respectively. The average peak separation for all observations combined was 29811 Hz.
Simultaneously with the kHz QPOs, the HBO and its second harmonic were detected. The frequency of the HBO increased from 18 to 56 Hz as the source moved from the left end of the HB to the HB/NB vertex and onto the upper part of the NB (Fig. 3b). Over this interval the rms amplitude of the HBO fundamental decreased from 11% to 3% (8.6–60 keV; Fig. 3d). The rms amplitude of the second harmonic (detected only below =1) decreased from 8% to 3% (Fig. 3f). The FWHM of the fundamental increased from 5 to 24 Hz, and the FWHM of the second harmonic remained approximately constant at 25 Hz. In the AO2 May/June data the HBO was also detected simultaneously with the kHz QPOs, with an amplitude, FWHM, and frequency of 4.700.9% rms, 16.00.8 Hz, and 50.90.2 Hz, respectively. NBOs with frequencies of 5.7 Hz were detected between 1.1 and 1.8. The NBOs were detected simultaneously with the HBO fundamental on the upper NB, but never simultaneously with the HBO second harmonic. No QPOs were detected further down the NB, on the FB, and on the extra branch.
4 Discussion
We have discovered two simultaneous kHz QPOs on the HB of the Z source GX 51. KHz QPOs have now been discovered in all six of the known Z sources. The frequencies of both peaks increased with inferred . The rms amplitude and the FWHM of the higher-frequency kHz QPO decreased as its frequency increased; the rms and the FWHM of the lower-frequency kHz QPO remained roughly constant. In Sco X-1 the peak separation decreased when the source moved from the upper NB to the lower NB onto the FB. The peak separation for GX 51 is consistent with being constant, but also with being similar to Sco X-1. This is true for the other Z sources as well, so that in the simplest description all peak separations vary, providing a challenge for beat frequency models where the peak separation is identified with the neutron star spin rate (see Psaltis et al. 1998 for a critical discussion of the peak separations).
In the leftmost part of the HB, i.e. at the lowest inferred , during the AO2 observation we detected the lower-frequency kHz QPO at a frequency of 213.6 Hz. The corresponding higher-frequency kHz QPO has also a rather low frequency (504.5 Hz), but not unusually low (see e.g. Strohmayer et al. 1996; Ford et al. 1997; Jonker et al. 1998). The lower-frequency kHz QPO covers a total range in frequency of a factor 3.5. This QPO has the lowest frequency and the largest dynamic range for a kHz QPO so far detected in any LMXB. The frequency range falls in the 200–1000 Hz frequency range expected if the lower-frequency kHz QPO is identified with the beat of the Keplerian frequency at the sonic-point with the neutron star spin frequency (Miller, Lamb, & Psaltis 1998). The corresponding range for the sonic-point radius would be 17–26 km, assuming a neutron star mass of 1.4 M⊙ and that the peak separation is the spin frequency.
Recently, Stella & Vietri (1998) proposed that the low frequency QPOs observed in atoll sources are due to a precession of the innermost disk region, dominated by the Lense-Thirring effect. They also suggested that the HBO in Z sources could arise from the same mechanism. However, the precession frequencies predicted for GX 51 are about a factor 2.5 smaller than that of the HBO frequencies (see also Stella & Vietri 1998), unless I/M (with I the moment of inertia of the neutron star and M its mass) is a factor of 2.5 higher than predicted by neutron star models with realistic equations of state, the kHz QPO peak difference is half the neutron star spin frequency, or the HBOs are not the fundamental frequencies but the second harmonics. For a detailed discussion about the Lense-Thirring interpretation of the HBO in Z sources we refer to Psaltis et al. (1998)
The Z track of GX 51 shifts between observations. The Z track of the AO1 data is at 4.5% higher count rates and 2% softer hard colors than the Z track of the AO2 data. Similar shift were already reported by Kuulkers et al. (1994) using EXOSAT data, although in their observations the variations in count rate and colors were slightly larger (8% and 6%, respectively). When plotting the frequency of the higher-frequency kHz QPO and the HBO versus count rate (Fig. 4a and c) the AO1 data are slightly displaced to higher count rates compared to the AO2 data. If we correct the count rates of the AO1 data for the shifts in count rate derived above the kHz QPOs and HBO frequencies as a function of count rate are consistent with being the same during both epochs (Fig. 4b and d). The same is also true for the frequency of the lower-frequency kHz QPO (not shown here) and the rms and the FWHM of all the QPOs. The only difference could be the rms amplitude of the higher-frequency kHz QPOs at the lowest inferred mass accretion rate, however, the difference is marginal. This demonstrates that not the X-ray count rate determines the properties of the QPOs (both the kHz QPOs and the HBO), but the position of GX 51 on the Z track does. Kuulkers et al. (1994) also reported that the HBO properties were consistent with being the same when the Z track of GX 51 was displaced in the HID. In their observations the tracks were displaced more than our tracks indicating that even for larger shifts the HBO properties do not change. Jonker et al. (1998) found the same for the HBO (the statistics did not allow to conclude anything for the kHz QPOs) in GX 3400. For Cygnus X-2 (Wijnands et al. 1997) it was shown that the NBO properties changed significantly when the Z track of this source moved around in the HID. However, due to limited available data nothing could be concluded for the HBO properties in Cygnus X-2.
Acknowledgements.
This work was supported in part by the Netherlands Foundation for Research in Astronomy (ASTRON) grant 781-76-017 and by NSF grant AST 96-18524. F.K.L acknowledges support from the United States National Aeronautics and Space Administration (NAG 5-2925). M.M. is a fellow of the Consejo Nacional de Investigaciones Científicas y Técnicas de la República Argentina. M.K. gratefully acknowledges the Visiting Miller Professor Program of the Miller Institute for Basic Research in Science (UCB).References
- [1]
- [2] Berger, M., et al. 1996, ApJ, 469, L13
- [3]
- [4] Ford, E., Kaaret, P., Tavani, M., Barret, D., Bloser, P., Grindlay, J., Harmon, B. A., Paciesas, W. S., & Zhang, S. N. 1997, ApJ, 475, L123
- [5]
- [6] Hasinger, G., & van der Klis, M. 1989, A&A, 225, 79
- [7]
- [8] Jonker, P., Wijnands, R., van der Klis, M., Psaltis, D., Kuulkers, E., Lamb, F.K. 1998, ApJ, Letters, in press.
- [9]
- [10] Kuulkers, E., van der Klis, M., Oosterbroek, T., Asai, K., Dotani, T., van Paradijs, J., & Lewin, W. H. G. 1994, A&A, 289, 795
- [11]
- [12] Lewin, W. H. G., Lubin, L. M., Tan, J., van der Klis, M., van Paradijs, J., Penninx, W., Dotani, T., & Mitsuda, K. 1992, MNRAS, 256, 545
- [13]
- [14] Miller, C., Lamb, F. K., & Psaltis, D. 1998, ApJ, submitted
- [15]
- [16] Psaltis, D., Méndez, M., Wijnands, R., Homan, J., Jonker, P. G., van der Klis, M., Lamb, F. K., Kuulkers, E., van Paradijs, J., & Lewin, W. H. G. 1998, ApJ, Letters, in press
- [17]
- [18] Psaltis, D., Wijnands, R., Homan, J., Jonker, P. G., van der Klis, M., Miller, M. C., Lamb, F. K., Kuulkers, E., van Paradijs, J., & Lewin, W. H. G. 1998, ApJ, submitted
- [19]
- [20] Stella, L. & Vietri, M. 1998, ApJ, 492, L59
- [21]
- [22] Strohmayer, T. E., Zhang, W., Swank, J. H., Smale, A., Titarchuk, L., & Day, C. 1996, ApJ, 469, L9
- [23]
- [24] van der Klis, M., Jansen, F., van Paradijs, J., Lewin, W. H. G., van den Heuvel, Trumper, J. E., & Sztajno, M. 1985, Nature, 316, 225
- [25]
- [26] van der Klis, M., Swank, J. H., Zhang, W., Jahoda, K., Morgan, E. H., Lewin. W. H. G., Vaughan, B., & van Paradijs, J. 1996a, ApJ, 469, L1
- [27]
- [28] van der Klis, M., Wijnands, R., Kuulkers, E., Lamb, F. K., Psaltis, D., Dieters, S., van Paradijs, J., & Lewin, W. H. G. 1996b, IAU Circ., 6511
- [29]
- [30] van der Klis, M., In Proceedings of the NATO Advanced Study Institute “The many faces of neutron stars” (eds. Buccheri, R., van Paradijs, J., & Alpar, M. A.) (Kluwer Academic Publisher) in press. 1998 (astro-ph/9710016)
- [31]
- [32] van der Klis, M., Wijnands, R. A. D., Horne, K., & Chen, W. 1997, ApJ, 481, L97
- [33]
- [34] Wijnands, R. A.D., van der Klis, M., Kuulkers, E., Asai, K., & Hasinger, G. 1997a, A&A, 323, 399
- [35]
- [36] Wijnands, R., Homan, J., van der Klis, M., Méndez, M., Kuulkers, E., van Paradijs, J., Lewin, W. H. G., Lamb, F. K., Psaltis, D., & Vaughan. B. 1997b, ApJ, 490, L157
- [37]
- [38] Wijnands, R., Homan, J., van der Klis, M., Kuulkers, E., van Paradijs, J., Lewin, W. H. G., Lamb, F. K., Psaltis, D., & Vaughan, B. 1998, ApJ, 493, L87
- [39]
- [40] Zhang, W., Jahoda, K., Swank, J. H., Morgan, E. H., & Giles, A. B. 1995, ApJ, 449, 930
- [41]
- [42] Zhang, W., Lapidus, I., White, N.E., & Titarchuk, L. 1996, ApJ, 469, L17
- [43]
- [44] Zhang, W., Strohmayer, T. E., & Swank, J. H. 1998, ApJ, Letters, in press
- [45]
| Energy | Lower-frequency peakb | Higher-frequency peakc |
|---|---|---|
| (keV) | (rms) | (rms) |
| 2–5.0 | % | % |
| 5.0–6.4 | % | % |
| 6.4–8.6 | % | 2.60.5% |
| 8.6–60 | 3.1% | 4.70.4% |
 |
 |
 |
 |