Searching for WR stars in I Zw 18 — The origin of He 2 emission 111Based on observations with the NASA/ESA Hubble Space Telescope, obtained at the Space Telescope Science Institute, which is operated by AURA, Inc., for NASA under contract NAS5-26555
Abstract
I Zw 18 is the most metal poor star-forming galaxy known and is an ideal laboratory to probe stellar evolution theory at low metallicities. Using archival HST WFPC2 imaging and FOS spectroscopy we were able to improve previous studies. We constructed a continuum free HeII 4686 map, which was used to identify Wolf-Rayet (WR) stars recently found by ground-based spectroscopy and to locate diffuse nebular emission. Most of the HeII 4686 emission is associated with the NW stellar cluster, clearly displaced from the surrounding shell-like [O 3] and H emission. We found evidence for He 2 sources, compatible with 5–9 WNL stars and/or compact nebular HeII 4686 emission, as well as residual diffuse emission. Only one of them is outside the NW cluster. We have done an extensive comparison between our results and the recent ground-based data used by Izotov et al. (1997) and Legrand et al. (1997) to identify WN and WC stars in I Zw 18. The differences between the various data may be understood in terms of varying slit locations, continuum fits, and contamination by nebular lines. We have calculated evolutionary tracks for massive stars and synthesis models at the appropriate metallicity ( Z⊙). These single star models predict a mass limit 90 M⊙ for WR stars to become WN and WC/WO. For an instantaneous burst model with a Salpeter IMF extending up to 120-150 M⊙ our model predictions are in reasonable agreement with the observed equivalent widths. Our model is also able to fully reproduce the observed equivalent widths of nebular HeII 4686 emission due to the presence of WC/WO stars. This quantitative agreement and the spatial correlation of nebular HeII 4686 with the stellar cluster and the position of WR stars shown from the ground-based spectra further supports the hypothesis that WR stars are responsible for nebular He 2 emission in extra-galactic H 2 regions.
keywords:
galaxies: individual (I Zw 18) — galaxies: stellar content — stars: Wolf-RayetAccepted for publication in ApJ \leftheadde Mello et al. \rightheadI Zw 18
and
Accepted for publication in ApJ
1 Introduction
I Zw 18 (= Mrk 116 = UGCA 166) is described in Zwicky’s catalog of compact galaxies (Zwicky 1971) as a pair of interconnected blue compact, presumably young galaxies. This otherwise unremarkable galaxy attracted immediate attention when Searle & Sargent (1972) established its extremely low oxygen abundance of only 2% the solar value. I Zw 18 became one of the proto-types of the “flashing galaxies” (Searle, Sargent, & Bagnuolo 1973), whose blue colors suggest a brief period of intense star formation. Subsequently this galaxy class was generally referred to as “starburst galaxies” (Weedman 1987), with I Zw 18 belonging to the sub-category of blue compact dwarfs (Thuan 1991). A review of its most pertinent parameters was given by Dufour et al. (1996): It has a radial velocity of 740 km s-1, is at a distance of about 10 Mpc, and has an extinction of .
I Zw 18’s extreme metal deficiency was confirmed in several follow-up studies (e.g., Kunth & Sargent 1986; Campbell 1990; Pagel et al. 1992; Kunth et al. 1994; Stasińska & Leitherer 1996). Although strong efforts to detect other galaxies with very low metal content have been undertaken (e.g. Terlevich, Skillman, & Terlevich 1995), I Zw 18 is still the record holder. Its low metallicity is of particular importance for studies of the primordial helium abundance (Izotov, Thuan, & Lipovetsky 1996; Olive, Skillman, & Steigman 1997; Skillman, Terlevich, & Terlevich 1998), and for properties of chemically unevolved galaxies in general. Despite the low oxygen abundance, however, there is clear evidence for stellar nucleosynthetic processing from its carbon abundance so that I Zw 18 is not a primordial galaxy (Garnett et al. 1997). The same suggestion was made earlier by Thuan (1983) on the basis of surface photometry of its underlying stellar population.
I Zw 18 is an ideal laboratory to probe stellar evolution theory in a low-metallicity environment. The spatial resolution of WFPC2 on the Hubble Space Telescope (HST) allows the detection of individual stars down to the 10 M⊙ range (Hunter & Thronson 1995; Dufour et al. 1996). Analysis of deep WFPC2 images clearly demonstrates ongoing massive-star formation. Additional, indirect evidence for a population of massive stars comes from bubbles and outflows of the interstellar medium, indicative of powerful hot-star winds and supernovae (Martin 1996).
Wolf-Rayet (WR) stars are the evolved, less massive descendants of previously massive O stars (Maeder & Conti 1994). Stellar evolution theory predicts few WR stars to form in a low-metallicity environment such as in I Zw 18 (e.g., Meynet 1995). Therefore recent reports (Izotov et al. 1997, hereafter IFGGT; and Legrand et al. 1997, hereafter LKRMW) of WR star detections in I Zw 18 have far-reaching implications for stellar evolution theory. Furthermore I Zw 18 is probably the best studied object among approximately 50 to 60 extra-galactic H 2 regions showing nebular HeII 4686 emission (Campbell et al. 1986; Izotov, Thuan & Lipovetsky 1994, 1997) whose origin is still poorly known and subject to recent debates. Various mechanisms reaching from photoionization by hot massive stars, photoionization by X-ray binaries to shocks have been put forward to explain the high excitation (Garnett et al. 1991). Understanding the origin of nebular HeII 4686 in low-metallicity galaxies has implications for our knowledge of the far-UV flux of galaxies and may prompt a re-examination of the importance of young galaxies to the ionization of QSO absorption line systems and the ionization of the intergalactic medium (cf. Garnett et al. 1991; Pettini et al. 1997).
WR stars can be recognized, e.g., via their broad (100 Å) emission bump around 4686, which is generally a blend of H, He 2 and several metal lines. I Zw 18 has been known to show narrow, nebular HeII 4686 emission but the broad WR emission bump was not known before the findings of IFGGT and LKRMW. The blending of several stellar and nebular emission lines around 4686 Å and the complex spatial morphology in ground-based data make it challenging to disentangle stars and gas and to derive the WR content and the nebular properties. This is evident in the apparently discrepant results of IFGGT and LKRMW. The superior spatial resolution of HST may prove useful in resolving the discrepancy.
In this paper we report on an HST archival project to study the spatial morphology of the highly ionized gas in I Zw 18, as observed primarily in HeII 4686. Our goals are to reconcile existing ground-based spectroscopic observations, to test stellar evolution models for WR stars in an extreme chemical environment, and to elucidate the nature of nebular He 2 emission in extragalactic H 2 regions. The paper is organized as follows. In §2 and §3 we describe the data used in this work and their analysis. In §4 we discuss the recent spectroscopic detection of Wolf-Rayet stars in connection with the HST imagery. The interpretation and a comparison with Wolf-Rayet star models are presented in §5. Finally, §6 summarizes our conclusions.
2 Data and reduction
2.1 Observation log
We have retrieved HST archival data of I Zw 18 obtained during Cycles 4 and 6. The data consist of both Wide Field/Planetary Camera 2 (WFPC2) images and Faint Object Spectrograph (FOS) spectra. The existence of such an extensive collection of data including images and spectra in several passbands make it possible to improve previous analysis, which were done using the available data at that time and which interpreted each data set individually (e.g. Hunter & Thronson 1995; Dufour et al. 1996). In Table 1 we list the image root names (column 1), proposal identification number (column 2), the epoch of observation (column 3), the configuration (column 4), and the optical element (column 5) for each set of data retrieved from the HST archive. In column 6 we give the spectral range of each optical element. The entry is the full width at half maximum (FWHM) for filters and the free spectral range for gratings. In the following subsections we describe several methods of data reduction which were tested using several different images and spectra.
2.2 Pipeline processing
All data were processed through the standard pipeline calibration. Calibration of the FOS spectra in the Routine Science Data Processing (RSDP) system most notably includes detector background and scattered light subtraction, flatfield corrections, computation of wavelengths, and conversion from count rates to fluxes. The WFPC2 data were processed through the pipeline where bias, dark, and flatfielding corrections were performed and photometry keywords were calculated.
Since the expected flux levels are close to the background and the noise level of the detector, additional data reduction and analysis procedures on top of the standard pipelines processing were required. These are described in the following subsections. All steps were performed using standard tasks in IRAF/STSDAS.
2.3 Cosmic-ray and hot pixel removal
Multiple images were simultaneously co-added and cosmic-rays removed using the IRAF task crrej. We set the algorithm to estimate the initial value to ‘median’ in order to eliminate the possibility of inadvertent rejection of true counts. Our study approaches the limits of HST detection, and high cosmic-ray flux values would bias the mean towards a higher number. Likewise by setting the threshold higher, we ensured the accuracy of the cosmic-ray rejection task. Surface plots of all supposed HeII 4686 emission were visually inspected for the characteristic profile of a cosmic-ray hit. The probability that three cosmic-rays can hit the same pixel in three different images was tested by using dark images taken at the same epoch and with similar exposure time. The dark images were cleaned using the same procedure as described above. We found that only 6 pixels remained contaminated by cosmic-rays (total number of pixels in each image = 6.4 106). Considering that this analysis will be critical when we discuss the HeII 4686 sources in §3, it is important to notice that this number is even lower if we take into account that the area of the CCD where the helium sources are detected is much smaller (total number of pixels = 4.7 103). Therefore, our technique of eliminating cosmic-rays proved to be very efficient and adequate for this study.
All pixels with apparent HeII 4686 emission were also individually inspected and compared with the known coordinates of hot pixels on the chip to eliminate any erroneous detections.
2.4 Background subtraction
Background subtraction was also performed on each image. Automatic background subtraction through crrej which simply subtracts the mode of the image was not used because we determined that this method generally subtracted values much larger than the true background. Instead, the background value was determined by computing the average of the counts calculated from the median of 13 boxes of 100 square pixels placed in relatively blank regions of each image. This procedure was performed on all images and the corresponding background value subtracted.
2.5 Flux calibration
All images were then converted into absolute flux units. Each image was multiplied by the appropriate PHOTFLAM value (erg s-1 cm-2 Å-1) which is defined to be the mean flux density that produces a count rate of 1 per second (DN) with the HST observing mode used in each observation. The final flux calibrated image was created by dividing by the exposure time.
The reliability of this process was exhaustively confirmed through comparisons with several sources of spectral data. Photometry was performed on the WFPC2 images and compared with the flux values obtained from the FOS spectra. Measurements of spectra from proposal 6536 (y39a0304t) indicated line fluxes of erg s-1 cm-2 and erg s-1 cm-2 for H and [OIII] 5007 ([OIII] hereafter), respectively. These values refer to a circular entrance aperture with a diameter of 0.86′′. We placed a synthetic aperture on the H and [OIII] WFPC2 images and measured the encircled fluxes. Photometry was then performed on the H and the continuum subtracted [OIII] WFPC2 images generated from observations of proposal 5434. (See below for the adopted continuum subtraction technique.) We measured erg s-1 cm-2 for H and erg s-1 cm-2 for [OIII]. We consider these values in good agreement, given the inherent uncertainties, most notably the unknown absolute pointing of HST. Typical pointing uncertainties are . Photometry was also performed at offset positions approximately 1′′ away from the assumed spectra locations to test the effect of HST pointing uncertainties. Flux differences on the order of 50% were found.
Total flux levels of H and [OIII] for the entire galaxy as measured from the flux calibrated WFPC2 images were likewise compared with published values from ground-based spectra. In Table 2 we compare our flux measurements with those of several different authors. Our WFPC2 fluxes are for the entire galaxy. The published ground-based measurements have a spread of nearly an order of magnitude, with the extreme values bracketing the WFPC2 values. Most likely, this reflects uncertainties in the calibration of ground-based data, different filter systems, and the difficulty to measure faint extended emission on ground-based data. Our values are closer to Dufour & Hester (1990) values which are based on imaging (see also Martin 1996).
We are mostly concerned about the internal uncertainty of the WFPC2 photometry since we combine different datasets to construct pure, continuum-free line images. To address this concern, flux levels of multiple F555W images were compared. We used a WF3 and a PC image from proposal 5434 and a PC image from proposal 5309. Fluxes at discrete locations as well as the total flux of the main body of I Zw 18 were compared in this filter. The total fluxes from these three images are erg s-1 cm-2 Å-1, erg s-1 cm-2 Å-1, and erg s-1 cm-2 Å-1. We conclude from these cross-checks that the internal WFPC2 flux calibration is accurate to about 3%.
2.6 Continuum subtraction
Pure emission-line images were produced by subtracting the underlying continuum from the appropriate narrow-band image. A pure oxygen map was created by subtracting a scaled continuum image compatible with the wavelength range of the F502N filter. We also created an H map. The H emission was taken as the flux in the F658N filter as the H line is redshifted to 6580 Å, which is within the bandwidth of the F658N filter (FWHM = 28.5 Å). A very conservative upper limit of 10% for the continuum contribution was estimated from FOS spectra. [NII] 6548/83 is outside the passband of the F658N filter. Hence we use the flux calibrated F658N image as an H map without any further correction.
A continuum-free spatial map of HeII 4686 was created using the F336W image since this image contains no significant line emission. Based on the FOS spectra of proposal 6536, the ratio of the continuum fluxes of the F469N and F336W filters at their effective wavelengths is 0.35. The F336W image was scaled by the appropriate factor and then subtracted from the F469N for a pure HeII 4686 map. It is important to notice that the FOS spectra were centered on a small region (diameter = 0.86′′) on the southwest side of the NW region of I Zw 18 and not necessarily represent the entire NW region. In order to check this we have compared FOS fluxes with ground based fluxes (F. Legrand 1997, private communication). We found that the FOS spectra are quite representative of the entire NW region, i.e. larger scales. However, in smaller scales the same cannot be assured. To put the following discussion into perspective, we note that the pure HeII 4686 flux is about 60% of the continuum flux within the F469N filter.
The emission-line images used for the analysis were obtained as described in the previous paragraphs. The adopted continuum subtraction technique was the result of extensive tests using different methods. Ideally, one would like to use a narrow-band image in the adjacent, line-free continuum for the continuum subtraction. Given HST’s filter set, such data do not exist. Errors in the continuum subtraction process are introduced by using (i) continuum images which are contaminated by lines and (ii) continuum images whose effective wavelength is very different from that of the line image. In the following we discuss our experiments to evaluate the trade-offs between (i) and (ii). Since our main interest is in the He 2 map, we restrict our discussion to the continuum correction of the F469N filter.
Continuum maps were created by correcting the F555W images for emission lines. As determined through equivalent width measurements of FOS spectra from proposal 6536 (y2f90402t), the emission lines in this filter contribute about 40% to the total flux of the F555W filter, and so this fraction was subtracted to generate the continuum map. These corresponding continuum images were then subtracted from the F469N image to create a He 2 map. However, the large correction required to account for the line contamination in the F555W filter and its probable spatial dependence introduce a large uncertainty. The resulting He 2 maps turned out to be unreliable.
Other experiments involved various combinations of the F450W and F439W images together with F336W and F555W to inter/extrapolate the continuum level at 4686 Å. Again, we noticed the uncertain line contamination correction for the continuum filters. This was tested by determining the location of the continuum using F336W (no significant contamination), F439W and F450W (some contamination), and F555W (strong contamination). Our tests showed that by far the more important error source in creating a He 2 map is the line contamination in the continuum filters and their spatial variation. In contrast, the stellar continuum slope is not strongly variable. This is immediately obvious: stars contributing to the optical/near-ultraviolet light have spectral types O to early A. Their colors are in the narrow range of –0.3 to +0.1 so that the continuum slope is fairly constant and has little spatial dependence.
We conclude from these simulations that our HeII 4686 map is well-suited to detect any excess He 2 emission but that its absolute flux calibration must be considered with care. We adopt a conservative error of 30%. Next we discuss the H, [OIII], and HeII 4686 maps.
3 Data Analysis
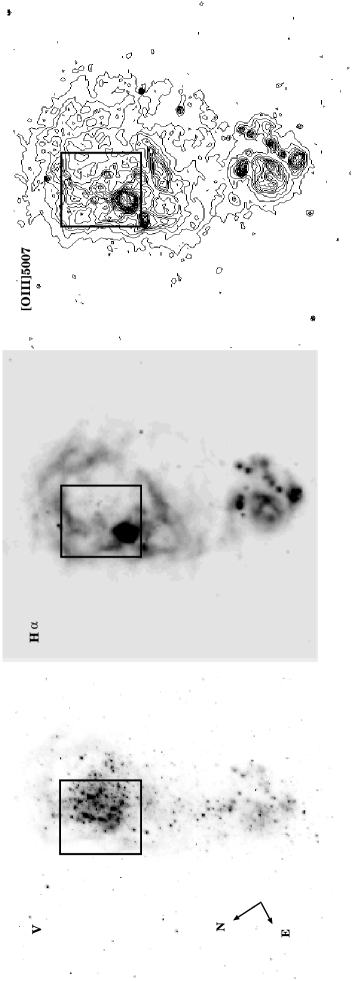
In Fig. 1 we show the WFPC2 V (F555W), H (F658N) and (F502N) images of I Zw 18Ṫhe total H and [OIII] fluxes are given in Table 2, which was described in §2.5. The H and [OIII] maps have a very similar morphology with coincident peaks of emission and similar filamentary structure. The ionized gas distribution is displayed in forms of ‘bubbles’ probably driven by stellar winds and supernovae. The nebular peaks of H and [OIII] are spatially offset from the U, V and I continuum. We refer to Hunter & Thronson (1995) and Martin (1996) for a more detailed analysis of the ionized gas and its relationship to the stars.
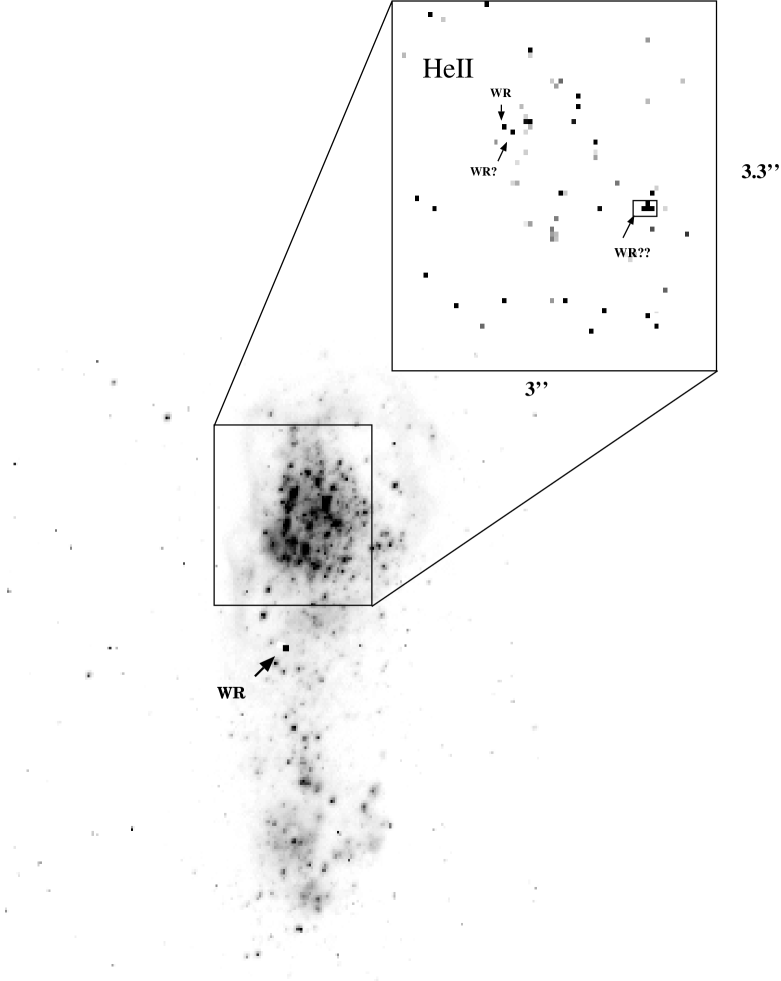
The spatial map of continuum-free HeII 4686 was carefully analyzed and 25 individual pixels of He 2 emission greater than 3 above the ‘background’ level have been identified within an area of 9.9 arcsec2 (62 pixels 2). This area is centered on the NW component of the galaxy and is presented in Fig. 2 together with the V image. The darkest pixels in Fig. 2 have fluxes higher than 3. We have verified that these He 2 sources are neither contaminated by cosmic-rays nor by hot pixels (see §2.3 for more details on cosmic-ray removal). As a final check we identified each HeII 4686 emission in the three individual images used in crrej. Since the probability that three cosmic-rays hit the same pixel in three different images is very low (see §2.3) this procedure guarantees that each emission detected in the three images are not cosmic-rays, i.e. pixels that were not detected in each of the three images were considered contaminated by cosmic-ray.
From the present data we have no direct means of distinguishing nebular from stellar HeII 4686 emission. Stars of the types Of, Ofpe/WN, WNL, and WNE show HeII 4686 emission formed in the expanding stellar wind. A fraction of the broad blended emission of C 3/C 4 4640-4650 and HeII 4686 in WC and WO stars may also be detected in the F469N filter. The average stellar He 2 line luminosity of WR stars of the WN sequence is erg s-1, and erg s-1 (see Schaerer & Vacca 1998 for line luminosities of other types). Placing a WNL star at the distance of I Zw 18 (10.8 Mpc) yields a typical line flux of erg s-1 cm-2. The He 2 filter (F469N) has a width of 24.9 Å and therefore the average line flux of a WNL star detected with F469N would be expected to be of the order of erg s-1 cm-2 Å-1 (average line flux over the FWHM of the filter). However, we should take into account the fact that Galactic WN stars have HeII 4686 13 ÅFWHM63 Å and WN stars in the SMC have 17 ÅFWHM33 Å (Conti & Massey 1989; Conti et al. 1989). Considering that I Zw 18’s stars are more similar to SMC’s stars than to the ones in the Milky Way, we conclude that the average line flux detected with the F469N (FWHM=24.9 Å) contains most of the true emission.
The total He 2 flux coming from helium sources (3) in the region presented in Fig. 2 is erg s-1 cm-2 Å-1, equivalent to 9 WNL stars 222The flux value is not corrected for extinction. Using the values of Hunter & Thronson (1995) for Aλ (0.21, 0.13, and 0.08 for F336W, F555W, and F814W, respectively) and assuming that the Milky Way extinction curve is adequate for dereddening, we find A4686 = 0.18.. However, this flux is distributed over several regions. For instance, 12 individual pixels are above the 5 level and have fluxes higher than erg s-1 cm-2 Å-1. We have identified 6 of these sources as possible WR stars (10). The pixels marked with WR and “WR?” in Fig. 2 have a flux of erg s-1 cm-2 Å-1 ( 3 WNL stars) and erg s-1 cm-2 Å-1 (0.7 WNL star), respectively. The pixels marked with “WR??” have fluxes of 1.7, 3.0, 5.3 and 9.2 erg s-1 cm-2 Å-1, which is equivalent to 0.4, 0.7, 1.2 and 2 WNL stars (4.3 WNL in total), respectively. However, only one of these pixels (0.4 WNL) is classified as an unambiguous detection. The other three pixels are present in two of the images but are seen as faint detections in one of the images. Therefore, we cannot exclude the possibility of contamination by cosmic-rays (see §2.3 for more details on cosmic-ray removal).
Although the fluxes from the individual He 2 sources found are compatible with fluxes of WNL stars, we cannot exclude sources of compact nebular HeII 4686 emission or a combination of stellar and nebular emission. Placed at the distance of I Zw 18 and observed with the F469N filter the 3 nebular HeII 4686 sources DR1, SMC N76, and LMC N44C studied by Garnett et al. (1991) have fluxes between (N76) and erg s-1 cm-2 Å-1 (N44C), comparable to 0.4-3.6 WNL stars. Their angular diameters range from 0.4′′ (DR1) to 0.03 ′′ (N44C) at the distance of I Zw 18. Therefore, our He 2 detections are also compatible with nebular sources similar to Garnett’s objects provided that they have compactness similar to N44C.
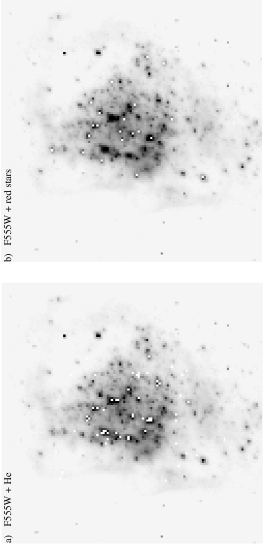
The integrated line flux within the 9.9 arcsec2 region including the helium sources is found to be erg s-1 cm-2 Å-1, i.e. erg s-1 cm-2. For comparison, ground-based observations of the narrow HeII 4686 emission in the NW component of I Zw 18 yield somewhat lower values between and erg s-1 cm-2 (Pagel et al. 1992; Skillmann & Kennicutt 1993, IFGGT; Izotov & Thuan 1998), which is likely explained by the smaller area covered by these observations. In our images the difference between the total flux and the flux from the helium sources is 1.1 erg s-1 cm-2 Å-1. This residual emission is spread over the 9.9 arcsec2 region and is probably nebular. We have also checked for the possibility of contamination by the red stellar objects found by Hunter & Thronson (1995) since these objects may contribute flux at 4690 Å but not in F336W. In Fig. 3 we show the helium sources and all the red stars brighter than F555W=25.0 and redder than F555W–F814W=0.5 (see Hunter & Thronson 1995 for details on magnitude calculation). We find that 5 of these red stars coincide with the position where helium sources were identified. However, these helium sources are very faint with fluxes of erg s-1 cm-2. The total helium emission from these sources contributes less than 6% to the total flux in the entire region.
In order to compare the features of different maps with the HeII 4686 map, Wide Field (WFC) images of H (u2f90205t and u2f90206t) and [OIII] (u2f90203 and u2f90204) were rebinned into Planetary Camera (PC) resolution. We used the task magnify in IRAF to perform the image interpolation. We have used 5 V images (u2cg0201t, u2cg0202t, u2cg0203t, u2f90104t and u2f90105t) taken with the PC and WF3 in order to check the validity of this technique. We conclude that the transformed images preserve enough information on the general morphology of the maps for a qualitative inspection. However, the transformed image loses information during the image interpolation and should be used with caution when comparing detailed features.
The helium peaks are located in the NW cluster, whereas the [O 3] and H emission has its maximum in a shell-like structure surrounding the cluster. Measured in small circular areas around the possible WR stars one finds 0.3-0.1; a fairly constant value of is obtained over the entire region of the cluster. However, these values should be taken with caution since they were obtained using the WF images transformed to PC resolution.
Several stars are identified in the area of the He 2 peaks, including the second brightest V star in the list of Hunter & Thronson (1995). This star is only 4 pixels (1 pixel=0.046′′) to the west of the WR stars and according to those authors it has magnitudes F555W=22.43, F336W=21.67 (see Hunter & Thronson 1995 for details on their photometry).
We have also investigated the presence of helium sources outside the NW cluster. We found that one source has flux 1.5 WNL. It is located in between the NW and the SE condensations. In Table 3 we summarize the helium sources identified in I Zw 18.
From the spatial maps presented in this section we conclude that HeII 4686 emission is clearly associated with the stellar cluster and spatially offset from the maximum nebular H and [OIII] emission. The present data alone do not allow us to distinguish between nebular and stellar HeII 4686 emission.
4 Comparison with ground-based spectroscopy
Two very recent papers have reported different numbers of WR stars in I Zw 18 using ground-based spectroscopy. LKRMW estimated from spectra taken with the 3.6m CFH Telescope that 1-2 WC4 or WC5 and no WN stars are present in I Zw 18. In contrast, IFGGT using the Multi Mirror Telescope found 174 WNL and 52 WC4 stars. Both spectra unambiguously show broad blue and red emission bumps centered at 4645-4686 Å and at 5808 Å, respectively, but differ in the measured line fluxes and the structure of the blue emission bump, as summarized below. There may be several reasons why their results differ. The main reason may be the choice of a different slit position and orientation. The slits were centered approximately on the same region (central knot of NW H 2 region). However, the position angle used by LKRMW is compared to by IFGGT. Therefore, their spectra cover partially different regions of the galaxy.
For the following discussion and for comparisons with theoretical predictions of the massive star population in I Zw 18 (see §5) we complement both sets of measurements of LKRMW and IFGGT with equivalent width measurements kindly provided by F. Legrand (1997, private communication), and with additional H equivalent widths from the literature. The data are summarized in Table 4. Before proceeding we give the following cautionary remarks: (i) LKRMW detect a broad component centered at 4645 Å (cf. “broad 4645” in Table 4) and no broad emission at 4686 Å. A small change in the fit of the continuum level may, however, accommodate the existence of a broad component. (ii) IFGGT detect a broad “WR bump” extending over 4619 – 4740 Å (“broad blue bump” in Table 4). As mentioned by these authors this feature can generally be composed of several broad WR emission lines as well as nebular lines. The presence of [FeIII] 4658, [ArIV]+HeI 4711,4713, and [ArIV] 4740 can be suspected in their spectrum (the latter two lines are present in LKRMW). When present, these nebular emission lines typically have line intensities of 0.01 to 0.03 H in total, as can be seen from the data of Izotov, Thuan & Lipovetsky (1994, 1997). The contribution due to WR stars may therefore be overestimated by up to a factor of two. (iii) Both the intensity of CIV 5808/H and the CIV 5808 line flux integrated over the respective regions differ approximately by a factor of two between LKRMW and IFGGT. This is very likely explained by the complex spatial distribution of the H emission as seen from the HST maps and the different adopted slit positions/orientations. (iv) The observations of the nebular HeII 4686/H intensity (0.040) of LKRMW and IFGGT are in agreement but are slightly larger than previous measurements (HeII 4686/H 0.032; e.g. Pagel et al. 1992; Skillman & Kennicutt 1993). (v) The H equivalent widths measured for the NW HII region differ considerably between various authors. Values between 56 and 127 Å are found by Pagel et al. (1992), Skillman & Kennicutt (1993), LKRMW and IFGGT.
Comparing the ground-based results of LKRMW and IFGGT with our results (see Table 3 for a summary our final numbers) it is possible that LKRMW have underestimated the number of WN stars while IFGGT et al. have overestimated it. The HST helium filter used, F469N, covers the region of 4683-4707 Å and therefore the helium emission line which is redshifted to 4698 Å is well centered in the filter passband. There is no contamination by the lines that are blended in the 4645 Å bump; the two closest lines, [FeIII] 4658, [ArIV] 4711 are redshifted to 4669 Å and 4722 Å, respectively, lying outside the helium filter. Therefore the helium emission detected can be either stellar or nebular in origin. However, we cannot exclude the presence of WC stars since there are no HST data available for the region of the 5808 Å bump.
The absence of WN stars was inferred by LKRMW from the absence of broad 4686 Å emission underlying the narrow 4686 Å. However, a small change in their fit of continuum level would provide enough flux to account for a few WN stars. It is also possible that no WN stars were detected because none were in the region where their spectra were taken; their slit width is 1.52′′ and could be centered just below the region where the stars are (as discussed at the end of this section).
The number of WNL stars derived by IFGGT is most likely overestimated for the following reasons: (i) The contribution of WC stars to the blue WR bump ( Å) has not been accounted for, and (ii) the broad HeII 4686 bump may be contaminated by other nebular emission lines as discussed above. Indeed the observed flux ratio is typical for WC4-5 stars (cf. Smith et al. 1990; Schaerer & Vacca 1998) and the contribution of CIII/IV 4650 from the WC stars to the 4686 Å bump should be subtracted to determine the remaining luminosity from WNL stars. Using the recent compilation of WR line luminosities from Schaerer & Vacca (1998) we obtain: , and . Note that the main difference between the value obtained by IFGGT is due to (i). If (ii) were also taken into account, the inferred number of WNL stars may be even lower. In any case it appears that the differences between the estimates of the number of WR stars derived by IFGGT and LKRMW are not significant if uncertainties are taken into account. Future observations with higher disperion and signal-to-noise will be necessary to address these issues with more accuracy. In absolute terms, the number of WNL stars in particular may be more uncertain given the relatively large spread of HeII 4686 line luminosities of individual WNL stars (Schaerer & Vacca 1998, their Fig. 1).
LKRMW and Izotov & Thuan (1998) have analyzed the spatial location of several emission features in I Zw 18. LKRMW have found that the bumps at 4645 Å and 5820 Å peak between 1′′ and 2′′ SW from the central cluster. They have also found a spatial correlation between WC features and nebular HeII 4686. In order to reproduce their results we have added (IRAF task improject) the flux of the HST images within 1.5′′ (their slit width). In Fig. 4 we present this result for the helium and F555W images (pixel size is 0.046′′). Three helium peaks are easily identified; two of them are the “WR” and “WR?” and the third peak is the one marked with “WR??” in Fig. 2. Comparing the helium peaks with the F555W peaks we conclude that the “WR??” peak is probably the one claimed by LKRMW as the peak located SW of the central cluster. Due to the lack of resolution present in LKRMW spectra, the central cluster is probably centered in between the three peaks in the F555W (around pixel 50). “WR??” is 1′′ away from pixel 50, which agrees with the distance found by LKRMW. However, as we discussed in §3 there is the possibility of cosmic-ray contamination at the “WR??” position. Our results suggest that LKRMW’s slit location probably missed the “WR” and “WR?” peaks, otherwise one bump should have been detected on the NE of the central cluster. The two peaks, “WR” and “WR?”, cannot be resolved with the ground-based telescopes since they are only 0.1′′ apart situated on the NE of the central cluster. The low spatial resolution and uncertainties in pointing of the ground-based spectra limit the comparison with HST data.
The shift between the hydrogen emission and the continuum found by LKRMW agrees well with the HST images. Our spatial maps are also compatible with the spatial distribution found by Izotov & Thuan (1998). The results of IFGGT do not provide information about the position of the WR features.
5 Model comparison and interpretation
In order to compare all the data with appropriate model predictions of massive star population at the low metallicity of I Zw 18 we have first calculated a set of new stellar evolution tracks and then performed evolutionary synthesis calculations using these tracks. Preliminary results have been discussed in Schaerer (1997). The ingredients of the stellar evolution models and a discussion of the results from these calculations are presented in the next subsections.
5.1 Stellar evolution models
Evolutionary tracks for stars between 25 and 150 M⊙ ( at the metallicity Z⊙ have been calculated with the Geneva stellar evolution code adopting the same ingredients as Meynet et al. (1994). These calculations extend the previously available Geneva sets () down to the metallicity of I Zw 18. The adopted mass-loss rate and its metallicity dependence are the main factors determining the evolution of the most massive stars. As shown by Maeder & Meynet (1994) the high mass-loss rates adopted in the models of Meynet et al. (1994) reproduces many observational properties of individual WR stars and O star populations at different metallicities, although direct measurements of WR mass-loss rates at Z⊙ suggest lower values (Leitherer et al. 1997). We have therefore adopted the same mass-loss prescription and scaling with metallicity. In addition we have also computed evolutionary tracks using mass-loss rates for OB stars determined from the recent results of Lamers & Cassinelli (1996), which relies on the observed wind-momentum-radius relation by Kudritzki et al. (1995). This prescription also explicitly includes a metallicity dependence, based on observations of O stars in the Galaxy, the LMC, and the SMC.
Qualitatively, the evolutionary tracks at reproduce the properties found earlier (cf. Meynet et al. 1994). Due to the diminished mass loss only the most massive stars are predicted to evolve to WR stars. The (initial) mass limit of single WR stars is found to be 90 M⊙, compared to 61 M⊙ at (Maeder & Meynet 1994). Both the 120 and 150 M⊙ models evolve through the WN phase prior to becoming WC/WO stars shortly before the end of He-burning. At the entry to this phase the ratio of the surface abundances is (C+O)/He 1 by number since the core is revealed in the late stage of He-burning. Following Smith & Maeder (1991) these stars would be classified as WO. For stars with initial masses 80 M⊙ the use of the mass-loss prescription of Lamers & Cassinelli (1996) leads to essentially identical mass loss during the main-sequence (MS) evolution as with the adopted high mass-loss rates. This reflects the weak metallicity dependence of mass loss at high luminosity (see Lamers & Cassinelli 1996). The subsequent evolution, the WR mass limit, and other relevant properties are therefore nearly identical to the high mass loss case, although they are of course still subject to uncertainties in post-MS mass-loss rates. In summary, our models predict WNL stars, a short WNE phase, and highly evolved WC/WO stars for single stars with initial masses 90 M⊙ at the metallicity of I Zw 18.
5.2 Evolutionary synthesis models – comparisons with observations
Subsequently we have calculated evolutionary synthesis models using the stellar tracks described above. The calculations are done with the models of Schaerer & Vacca (1998) where a detailed description of the input physics can be found. The most relevant features are the use of spherically expanding non-LTE atmospheres to describe the ionizing fluxes and the synthesis of WR emission features in the optical spectrum based on the recent compilation of line luminosities by Schaerer & Vacca (1998). We consider a power-law IMF (e.g. Salpeter) with a variable upper mass cut-off , and instantaneous star-formation at time (“instantaneous burst”). If the evolution of the observed WR stars in I Zw 18 is described by the new single star models, 90 M⊙ is required. Such a high value is very well compatible with observations of massive stars in the Magellanic Clouds (Puls et al. 1996). The choice of the lower mass cut-off does not affect our results.
In Fig. 5 we show the predicted WR/(WR+O), WNL/(WR+O) and WC+WO/(WR+O) number ratios for 150 M⊙ as a function of the age of the burst. WR stars appear after 2.5 Myr and their presence lasts approximately 1 Myr. The maximum WR/(WR+O) ratio is 0.02. As expected from models at , WN stars dominate the WR population; the predicted WC/WN ratio is . The predicted WR lines (line intensities with respect to H and equivalent widths) and the prediction for the nebular HeII 4686 emission are plotted in Fig. 6 as a function of time. Also shown are the observed quantities from IFGGT and LKRMW summarized in Table 4. It is evident that the spatial complexity of the gas and the displacement between stars and gas cause strong variations in the stellar and nebular emission strengths. This also explains the large variations of shown in Table 4. On the other hand, the WR features and, interestingly, also nebular HeII 4686, follow fairly closely the spatial distribution of the continuum emission (see IFGGT, LKMRW, and the HST images). Therefore, we prefer to use the equivalent widths of the WR features as the physically most meaningful quantity for quantitative comparisons. Taking the largest value (127 Å) from the literature, a lower limit of 3 Myr can be estimated for the age of the NW region from our instantaneous burst models.
Fig. 6b shows that the observed line intensities exceed all predicted values by a large factor. This is expected due to the complex morphology of the interstellar gas. In contrast, the predicted equivalent widths fall in the range of the observed values from LKRMW. We have plotted the prediction for the CIII/IV 4650 + He 2 4686 bump using the calibration from Smith (1991) (curves with larger values in Fig. 6a), and the sum of NIII 4640 and CIII/IV 4650 from the compilation of Schaerer & Vacca (1998) (curves with lower values in Fig. 6a). These predictions bracket the observed value of LKRMW and could even marginally explain the larger flux measured by IFGGT. The predicted is generally somewhat lower than the observations. Using the line luminosities of Smith (1991) for WC/WO stars we predict 1 Å; lower values are obtained using the values from the compilation of Schaerer & Vacca, which accounts for differences between WC and WO subtypes. In view of the observational uncertainties (see discussion in §4) we conclude that the present single star models are able to reproduce the WR features in I Zw 18 discussed so far with an instantaneous burst and a Salpeter IMF extending to 120–150 M⊙.
Interestingly, the predicted equivalent width of nebular HeII 4686 reproduces the observed value very well (Fig 6a). The total nebular He 2 emission in I Zw 18 is consistent with the derived number of WC stars if one assumes that their spectrum has the same hardness (i.e., identical ratio of He++/H+ continuum photons) as the well studied WO star DR1 (Garnett et al. 1991, Kingsburgh et al. 1995), and that the Lyman continuum luminosity corresponds to that of an average WR star at low (Schaerer & Vacca 1998, their Fig. 6). Both facts support the hypothesis of Schaerer (1996) that WC/WO stars are responsible for nebular HeII 4686 features observed in extragalactic HII regions. This is in contrast to the result of IFGGT and LKRMW, who conclude, based only on the comparison of the observed He 2/H line intensity, that the nebular He 2 emission in I Zw 18 cannot be explained quantitatively by WC/WO stars. The apparent contradiction is simply explained by the different spatial extension of the He 2 and H emission seen in the HST imagery (cf. §4). The spectroscopic He 2/H values in IFGGT and LKRMW probably overestimate the true nebular L(He 2)/L(H ) ratio because H is emitted over a larger region than the He 2. The need for such a geometric correction was pointed out by Garnett et al. (1991). An additional argument from I Zw 18 in favor of the existence of an intimate link between WC/WO stars and nebular He 2 emission is the spatial correlation between the WC features and HeII 4686 found by LKRMW.
5.3 WC and/or WO stars in I Zw 18
As mentioned in §5.1 the stellar models predict a very high C+O and a low helium abundance in the WC/WO phase, which would likely lead to a WO instead of WC classification of these stars. Are WC and/or WO stars present in I Zw 18? A classification of the WC and WO subtypes observed in I Zw 18 requires more than the mere detection of CIV 5808 and the 4650 bump (Smith et al. 1990; Crowther et al. 1998). However, as discussed by LKRMW, the observed FWHM of these lines is compatible with WC4 or WC5 types (cf. Smith et al.). The width of CIV 5808 given by both IFGGT and LKRMW and the structure of the 4650 bump observed by the former authors are also compatible with those of the WO3-4 star DR1 (Kingsburgh et al. 1995; Crowther et al. 1998). If the entire CIV 5808 emission were attributed to WO3-4 stars, one would expect I(OV 5590)/I(CIV) (Schaerer & Vacca 1998), too weak to be detected in the current observations. A detection of the broad OIV 3400, OVI 3811, or OV 5590 lines is required for an unambiguous detection of WO stars. At this time the presence of WO stars, expected in low metallicity environments, cannot be excluded in I Zw 18, and the classification of the observed WC stars is presently not certain.
If the fraction of evolved WR stars with (C+O)/He 1 (“WO”) is low among the observed WC/WO stars, the present evolutionary scenario may not apply and other channels leading to an earlier appearance of He-burning products on the stellar surface might be required. Two (non-exclusive) processes may be invoked: higher mass loss on the main sequence and/or the WNL phase or additional mixing leading to upward transport of processed elements. Given the uncertainties of the mass-loss rates of very massive stars and their metallicity dependence (cf. Heap et al. 1994; Schaerer 1998) the evolutionary scenarios of single stars are still uncertain. Extreme mass loss may also occur through Roche-lobe overflow in a binary system. Indeed as shown by Schaerer (1998) Case A binaries (Roche-lobe filled during MS phase) may be an important channel to form WR stars from high mass stars ( 40 M⊙) in low environments. Rotational induced mixing can lead to an earlier entry in the WR phase (e.g. Meynet 1997; Meynet & Maeder 1997). New observations of both individual massive stars or integrated populations in low metallicity environments will provide crucial information to guide our understanding of massive stars in extreme environments.
6 Summary
We have used an extensive collection of archival HST data to study the stellar content and gaseous distribution in I Zw 18. Continuum subtraction and cosmic-ray removal were found to be critical for the search for faint sources. Using WFPC2 imaging and FOS spectra we were able to improve previous studies and construct a continuum free HeII 4686 map, which was used to search for stellar sources (WR stars) recently found by ground-based spectroscopy and to locate diffuse nebular emission. The HeII 4686 emission is associated with the NW stellar cluster, clearly displaced from the surrounding shell-like [O 3] and H emission. We found evidence for He 2 sources, compatible with 5–9 WNL stars and/or compact nebular HeII 4686 emission, as well as residual diffuse emission. Only one of these sources is not located in NW cluster but in the region in between the NW and SE condensation.
We have done an extensive comparison between our results and the recent ground-based data of IFGGT and LKRMW which allowed them to identify WN and WC stars in I Zw 18. The differences between the various data may be understood in terms of varying slit locations, continuum fits and contamination by nebular lines. Ground-based spectra taken with better resolution and larger telescopes will allow one to probe the massive star content more accurately, to provide more stringent constraints on evolution models, and to study the interaction between the stars and their surrounding ISM in more depth. In order to avoid the difficulties in correlating spectra and image location, Fabry-Perot interferometry or other imaging spectrocopy would be the technique of choice.
We have calculated evolutionary tracks for massive stars and synthesis models at the appropriate metallicity ( Z⊙). These single star models predict a mass limit 90M⊙ for WR stars which may become WN and WC/WO. For an instantaneous burst model with a Salpeter IMF extending up to 120-150 M⊙ our model predictions are in reasonable agreement with the observed equivalent widths. The WR population in I Zw 18 has properties consistent with those predicted by single-star evolution models for this metallicity. The WR/O ratio forms an extension of the trend observed in WR galaxies (Maeder & Conti 1994) towards very low . Our model is also able to fully reproduce the observed EW of nebular HeII 4686 emission due to the presence of WC/WO stars. This quantitative agreement and the spatial correlation of nebular HeII 4686 with the stellar cluster and the position of WR stars further supports the hypothesis by Schaerer (1996) that WR stars are responsible for nebular He 2 emission in extra-galactic H 2 regions.
Acknowledgements.
We thank the anonymous referee for valuable comments which helped improving our paper. We are grateful to Stefano Casertano, Bill Vacca and Rosa Gonzalez-Delgado for helpful discussions. D.S. is grateful to Yuri Izotov and François Legrand for helpful discussions and for providing us with additional information from their spectra. Deidre Hunter kindly sent us her original images for comparison purposes. J.H. acknowledges support from STScI summer student program. D.S. acknowledges support from the Swiss National Foundation for Scientific Research and partial support from the Director’s Discretionary Research Fund of the STScI.References
- [1]
- [2] Campbell, A. 1990, ApJ, 362, 100
- [3]
- [4] Campbell, A., Terlevich, R., & Melnick, J. 1986, MNRAS, 223, 811
- [5]
- [6] Conti, P.S., & Massey, P. 1989, ApJ, 337, 251
- [7]
- [8] Conti, P.S., Massey, P., & Garmany, C.D. 1989, ApJ, 341, 113
- [9]
- [10] Crowther, P.A., De Marco, O., Barlow, M.J. 1998, MNRAS, in press
- [11]
- [12] Dufour, R.J., Garnett, D.R., Skillman, E.D. & Shields, G. 1996, in From Stars to Galaxies, ASP Conf. Series, Vol. 98, eds. C. Leitherer, U. Fritze-v. Alvensleben, and J. Huchra, 358
- [13]
- [14] Dufour, R.J., & Hester, J.J. 1990, ApJ, 350, 149
- [15]
- [16] Garnett, D.R., Kennicutt R.C., Chu, Y.-H., & Skillman, E.D. 1991, ApJ, 373, 458
- [17]
- [18] Garnett, D. R., Skillman, E. D., Dufour, R. J., & Shields, G. A. 1997, ApJ, 481, 174
- [19]
- [20] Heap S.R., Ebbets, D., Malumuth, E.M., Maran, S.P., de Koter, A., & Hubeny, I. 1994, A&A, 435, L39
- [21]
- [22] Hunter, D., & Thronson, H. 1995, ApJ, 452, 238
- [23]
- [24] Izotov, Y.I., Foltz, C.B, Green, R.F., Guseva, N.G., & Thuan, T.X. 1997, ApJ, 487, L37 (IFGGT)
- [25]
- [26] Izotov, Y.I., & Thuan, T.X. 1998, ApJ, 497, 227
- [27]
- [28] Izotov, Y.I., Thuan, T.X., & Lipovetsky, V.A. 1994, ApJ, 435, 647
- [29]
- [30] ——– 1997, ApJS, 108,
- [31]
- [32] Kingsburgh, R.L., Barlow, M.J., & Storey, P.J. 1995, A&A, 295, 75
- [33]
- [34] Kudritzki, R.P., Lennon, D.J., & Puls, J. 1995, in Science with the VLT, eds. J.R. Walsh, I.J. Danzigers, 246
- [35]
- [36] Kunth, D., Lequeux, J. Sargent, W.L.W., & Viallefond, F. 1994, A&A, 282, 709
- [37]
- [38] Kunth, D., & Sargent, W.L.W. 1986, ApJ, 300, 496
- [39]
- [40] Lamers, H.J.G.L.M., & Cassinelli, J.P. 1996, in From Stars to Galaxies, ASP Conf. Series, Vol. 98, eds. C. Leitherer, U. Fritze-v. Alvensleben, and J. Huchra, 162
- [41]
- [42] Legrand, F., Kunth, D., Roy, J.-R., Mas-Hesse, J.M., & Walsh, J.R. 1997, A&A, 326, L17 (LKRMW)
- [43]
- [44] Leitherer, C., Chapman, J.M., & Koribalski, B. 1997, ApJ, 481, 898
- [45]
- [46] Maeder, A., & Conti, P. 1994, ARA&A, 32, 227
- [47]
- [48] Maeder, A., & Meynet, G. 1994, A&A, 287, 803
- [49]
- [50] Martin, C. 1996, ApJ, 465, 680
- [51]
- [52] Meynet, G. 1995, A&A, 298, 767
- [53]
- [54] —— 1997, Boulder Munich Workshop II: in Properties of Hot Luminous Stars, Vol. 131, ed. I. Howarth, ASP Conf. Series, 96
- [55]
- [56] Meynet, G., Maeder, A., Schaller, G., Schaerer, D., & Charbonnel, C. 1994, A&AS, 103, 97
- [57]
- [58] Olive, K.A., Skillman, E.D., & Steigman, G. 1997, ApJ, 489, 1006
- [59]
- [60] Pagel, B.E.J., Simonson, E.A., Terlevich, R.J., & Edmunds, M.G. 1992, MNRAS, 255, 325
- [61]
- [62] Pettini, M., Smith, L., King, D.L, & Hunstead, R.W. 1997, ApJ, 486, 665
- [63]
- [64] Puls, J., Kudritzki, R.P., Herrero, A., Pauldrach, A.W.A., Haser, S.M., Lennon, D.J., Gabler, R., Voels, S.A., Vilchez, J.M., Wachter, S., & Feldmaier, A., 1996, A&A, 305, 171
- [65]
- [66] Schaerer, D. 1996, ApJ, 467, L17
- [67]
- [68] —— 1997, in Dwarf Galaxies: Probes for Galaxy Formation and Evolution, ed. J. Andersen, Highlights of Astronomy, in press
- [69]
- [70] —— 1998, A&A, in preparation
- [71]
- [72] Schaerer, D., & Vacca, W.D. 1998, ApJ, 497, 618
- [73]
- [74] Searle, L., & Sargent, W. L. W. 1972, ApJ, 173, 25
- [75]
- [76] Searle, L., Sargent, W.L.W., & Bagnuolo, W.G. 1973, ApJ, 179, 427
- [77]
- [78] Skillman, E.D., & Kennicutt, R.C.Jr. 1993, ApJ, 411, 655
- [79]
- [80] Skillman, E.D., Terlevich, E., & Terlevich, R. 1998 in Primordial Nuclei and their Galatic Evolution, eds. N. Prantzos, M. Tosi, & R. van Steiger, Kluwer, in press
- [81]
- [82] Smith, L.F. 1991, in Wolf-Rayet Stars and Interrelations with Other Stars in Galaxies, IAU Symp. 143, eds. K. A. van der Hucht & B. Hidayat, (Dordrecht: Kluwer), p. 601
- [83]
- [84] Smith, L.F., & Maeder, A. 1991, A&A, 241, 77
- [85]
- [86] Smith, L.F., Shara, M.M., & Moffat, A.F.J. 1990, ApJ, 348, 471
- [87]
- [88] Stasińska, G., & Leitherer, C. 1996, ApJS107, 661
- [89]
- [90] Terlevich, E., Skillman,E.D., Terlevich, R., 1995, in The Interplay between Massive Star Formation, the ISM, and Galaxy Evolution, eds. D. Kunth, B. Guidernoni, M. Heydari-Malayeri, T.X. Thuan, Editions Frontières, Gif-sur-Yvette, 395
- [91]
- [92] Thuan, T.X. 1983, ApJ, 268, 667
- [93]
- [94] —— 1991, in Massive Stars in Starbursts, eds. C. Leitherer, N. Walborn, T. Heckman, & C. Norman (Cambridge: CUP), 183
- [95]
- [96] Weedman, D. W. 1987, in Star Formation in Galaxies, ed. C. J. Lonsdale (Washington: NASA), 351
- [97]
- [98] Zwicky, F. 1971, in Catalogue of selected compact galaxies and of post-eruptive galaxies Publ. F. Zwicky, Gümligen (BE), Switzerland-388
- [99]
| Root Name | Proposal ID | Epoch | Configuration | Optical Element | (Å) |
|---|---|---|---|---|---|
| y2f90403t | 5434 | 27 Oct 1994 | FOS/RD | G190H | 722 |
| y2f90404t | 5434 | 27 Oct 1994 | FOS/RD | G190H | 722 |
| y2f90402t | 5434 | 27 Oct 1994 | FOS/RD | G570H | 2249 |
| u2cg0101t | 5309 | 29 Oct 1994 | PC | F336W | 371 |
| u2cg0102t | 5309 | 29 Oct 1994 | PC | F336W | 371 |
| u2cg0103t | 5309 | 30 Oct 1994 | PC | F336W | 371 |
| u2cg0301t | 5309 | 30 Oct 1994 | PC | F814W | 1758 |
| u2cg0302t | 5309 | 30 Oct 1994 | PC | F814W | 1758 |
| u2cg0303t | 5309 | 30 Oct 1994 | PC | F814W | 1758 |
| u2cg0401t | 5309 | 31 Oct 1994 | PC | F469N | 25 |
| u2cg0402t | 5309 | 31 Oct 1994 | PC | F469N | 25 |
| u2cg0403t | 5309 | 31 Oct 1994 | PC | F469N | 25 |
| u2cg0201t | 5309 | 31 Oct 1994 | PC | F555W | 1223 |
| u2cg0202t | 5309 | 31 Oct 1994 | PC | F555W | 1223 |
| u2cg0203t | 5309 | 31 Oct 1994 | PC | F555W | 1223 |
| u2f90203t | 5434 | 02 Nov 1994 | WF3 | F502N | 27 |
| u2f90204t | 5434 | 02 Nov 1994 | WF3 | F502N | 27 |
| u2f90205t | 5434 | 02 Nov 1994 | WF3 | F658N | 29 |
| u2f90201t | 5434 | 02 Nov 1994 | WF3 | F702W | 1481 |
| u2f90202t | 5434 | 02 Nov 1994 | WF3 | F702W | 1481 |
| u2f90101t | 5434 | 03 Nov 1994 | WF3 | F702W | 1481 |
| u2f90102t | 5434 | 03 Nov 1994 | WF3 | F450W | 925 |
| u2f90103t | 5434 | 03 Nov 1994 | WF3 | F450W | 925 |
| u2f90104t | 5434 | 03 Nov 1994 | WF3 | F555W | 1223 |
| u2f90105t | 5434 | 03 Nov 1994 | WF3 | F555W | 1223 |
| u2cg0501t | 5309 | 03 Nov 1994 | PC | F656N | 22 |
| u2cg0502t | 5309 | 03 Nov 1994 | PC | F656N | 22 |
| u2cg0503t | 5309 | 03 Nov 1994 | PC | F656N | 22 |
| u2f90206t | 5434 | 03 Nov 1994 | WF3 | F658N | 29 |
| u2f90303t | 5434 | 01 Mar 1995 | PC | F439W | 464 |
| u2f90304t | 5434 | 01 Mar 1995 | PC | F439W | 464 |
| u2f90301t | 5434 | 01 Mar 1995 | PC | F555W | 1223 |
| u2f90302t | 5434 | 01 Mar 1995 | PC | F555W | 1223 |
| u2f90305t | 5434 | 01 Mar 1995 | PC | F675W | 889 |
| u2f90306t | 5434 | 01 Mar 1995 | PC | F675W | 889 |
| y39a0305t | 6536 | 08 Jun 1996 | FOS/RD | G190H | 722 |
| y39a0306t | 6536 | 08 Jun 1996 | FOS/RD | G190H | 722 |
| y39a0303t | 6536 | 08 Jun 1996 | FOS/RD | G400H | 1546 |
| y39a0304t | 6536 | 08 Jun 1996 | FOS/RD | G570H | 2249 |
| Authors\tablenotemarka | H Flux | [OIII] 5007 Flux |
|---|---|---|
| (erg s-1 cm-2) | (erg s-1 cm-2) | |
| This work | ||
| DH | ||
| DKF | ||
| IFGGT | ||
| PSTE | ||
| SK\tablenotemarkb | 1.1 |
aDH: Dufour & Hester (1990); DKF: Davidson et al. (1989); IFGGT: Izotov et al. (1997); PSTE: Pagel et al. (1992); SK: Skillman & Kennicutt (1993) \tablenotetextbNote that only SK fluxes are reddening corrected
| Identification | Position\tablenotemarka | Fluxes\tablenotemarkb | Comments |
|---|---|---|---|
| (WNL) | |||
| WR | 403, 465 | 3.0 | in NW cluster |
| WR? | 405, 464 | 0.7 | in NW cluster |
| WR?? | 437, 449 | 0.4 | SW of the NW cluster |
| WR?? | 436, 450 | 0.7 | cosmic-ray contamination? |
| WR?? | 435, 449 | 1.2 | cosmic-ray contamination? |
| WR?? | 436, 449 | 2.0 | cosmic-ray contamination? |
| WR | 406, 407 | 1.5 | between NW and SE clusters |
| 1–2 WC | LKRMW | ||
| 174 WNL | IFGGT | ||
| 52 WC4 | IFGGT |
ax,y coordinates of each pixel in the F469N image \tablenotetextbThe average line flux of 1 WNL star observed with the F469N filter at the distance of I Zw 18 is 4.6erg s-1 cm-2 Å-1
| Feature | Wλ | Authors\tablenotemarka | |
|---|---|---|---|
| (Å) | |||
| Broad 4645 | 0.029 | 1.8 | LKRMW, L97 |
| Broad blue bump (4686) | 0.062 | IFGGT | |
| Broad 5808 | 0.012 – 0.031 | 1.3 | LKRMW, IFGGT, L97 |
| Nebular HeII 4686 | 0.04 | 2.2 | LKRMW, IFGGT, L97 |
| H | 1.00 | 56 – 127 | IFGGT, PSTE |
aLKRMW: Legrand et al. 1997, L97: Legrand (1997; private communication), IFGGT: Izotov et al. 1997, PSTE: Pagel et al. (1992)