Soft X-ray emission of VY Scl stars during optical high state
Abstract
I have collected all available ROSAT observations of VY Scl stars including those during the all-sky survey to investigate the presence, strength and spectrum of soft X-ray emission (0.1–2.4 keV) of this group of nova-like variables. A total of 9 out of the 14 VY Scl stars are detected with ROSAT, mostly during optical high states. Interestingly, all detections during the optical high state have very similar X-ray spectral characteristics. I find that a simple blackbody model gives a reasonably good fit in all cases, with temperatures falling in the narrow range between 0.25–0.5 keV. Possible emission mechanisms are discussed.
Key Words.:
cataclysmic variables — accretion disks — instabilities — X-rays: stars — binaries: close — stars: individual (PX And, TT Ari, KR Aur, BZ Cam, BH Lyn, DW UMa, LX Ser, V442 Oph, MV Lyr, V794 Aql, V751 Cyg, V425 Cas, VY Scl, VZ Scl)1 Introduction
VY Scl stars are a subclass of nova-like, cataclysmic variables which are bright most of the time, but occasionally drop in brightness at irregular intervals (e.g. Warner 1995). The transitions between the brightness levels occur on a time scale of days to weeks. These variables are typically found at 3 hrs and with large mass transfer rate (upper right corner of the diagram of Osaki 1996), and thus are thought to be steady accretors (or dwarf novae in a state of continuous eruption as suggested by Kraft 1964) with hot disks. Their disks are thus assumed to be thermally and tidally stable.
Evidence for high is based on measures of the absolute magnitude of VY Scl stars during their high state. The accretion disks then are assumed to be optically thick and can be approximated by models of quasi-steady disks (see e.g. Warner 1987 for a summary). Absolute magnitudes can be determined in various ways, and range between = 3–6 mag for VY Scl stars (Warner 1987, see also Tab. 1), corresponding to mass transfer rates of up to 510-8 /yr.
An interesting, partly overlapping group of high cataclysmic systems are the so-called SW Sex stars (three of the five SW Sex stars belong to the VY Scl group) which all are eclipsing systems but show single-peaked emission lines remaining largely unobscured during primary eclipse. This has been explained in terms of a combination of an accretion stream which is overflowing the initial impact onto the disk with the effect of a strong accretion disk wind (e.g. Hellier 1996). The observations of these properties in eclipsing systems only is certainly a selection bias, and it remains to be seen whether other VY Scl stars also exhibit some or all of the properties which presently make up the SW Sex classification criteria.
Based on the fact that VY Scl stars have similar low states like AM Her binaries which have no disks, low states are thought to involve drops in the mass transfer rate from the secondary. Livio & Pringle (1994) proposed a model for the optical brightness drops of VY Scl stars in which the reduced mass transfer rate is caused by a magnetic spot covering temporarily the region. This mechanism works predominantly at short orbital periods because the level of magnetic activity increases with the rotation rate of the star (which in turn is coupled to the orbit). The same idea has recently been expanded and applied to detailed disk instability modelling (King & Cannizzo 1998). It was shown that a simple reduction in mass transfer rate from the secondary is not sufficient because then, after the transition of the disk to a cool state, the disk should show outbursts like in dwarf novae. Since such outbursts have never been observed from VY Scl stars during optical low-state, King & Cannizzo (1998) concluded that all disk mass must be drained away after the transition of the system into the optical low state.
| Name | R.A. | Decl. | bII | Mag. | Porb | d | M/M | i(3) | MWD | MD |
|---|---|---|---|---|---|---|---|---|---|---|
| (2000.0) | (2000.0) | range | (min) | (pc) | (mag) | (∘) | () | () | ||
| PX And | 00h30m059 | +26∘17′26′′ | –36 | 14.8–17.0 | 211 | 180 | 9/7 | 74ecl | 0.2(4) | 0.32 |
| TT Ari | 02h06m531 | +15∘17′42′′ | –43 | 9.5–14.5 | 198 | 180–200 | 9/4 | 30–40 | 1 | 0.35 |
| KR Aur | 06h15m440 | +28∘35′08′′ | +6 | 11.3–19.0 | 234 | 180 | 12/5 | 40 | 0.7 | 0.48 |
| BZ Cam | 06h29m341 | +71∘04′36′′ | –24 | 12.5–14.1 | 221 | 500(5) | 6/4(5) | 40 | 0.1–1.0 | 0.3–0.35 |
| BH Lyn | 08h22m361 | +51∘05′24′′ | +35 | 13.7–17.2 | 224 | 79ecl | 0.37–1.4 | 0.22–0.5 | ||
| DW UMa | 10h33m531 | +58∘46′54′′ | +50 | 13.8–18.1 | 197 | 850 | 7.5/3 | 72ecl | 0.15–0.6 | 0.15–0.3 |
| LX Ser | 15h38m002 | +18∘52′02′′ | +51 | 13.3–17.4 | 228 | 250–460 | 9/5 | 75ecl | 0.32–0.48 | 0.32–0.39 |
| V442 Oph | 17h32m152 | –16∘15′23′′ | +9 | 12.6–15.5 | 202 | 80 | 10/7 | 65 | 0.35–0.45 | 0.3–0.37 |
| MV Lyr | 19h07m164 | +44∘01′07′′ | +16 | 12.2–18.0 | 193 | 320 | 10.2/6.0 | 9–14 | 0.4–1.4 | 0.17 |
| V794 Aql | 20h17m340 | –03∘39′52′′ | –21 | 13.7–20.2 | 240-330 | 200 | 14/7 | 22–56 | 0.5–1.2 | 0.46–0.6 |
| V751 Cyg | 20h52m129 | +44∘19′25′′ | –0 | 13.2–17.8 | 360 | 430 | 8.2/3.6 | |||
| V425 Cas | 23h03m467 | +53∘17′14′′ | –6 | 14.5–18.5 | 216 | 16–34 | 0.55–1.2 | 0.29–0.33 | ||
| VY Scl | 23h29m005 | –29∘46′47′′ | –72 | 12.9–18.5 | 239 | 500 | 9/4 | 25–40 | 0.8–1.4 | 0.23–0.42 |
| VZ Scl | 23h50m092 | –26∘22′53′′ | –76 | 15.6–20.0 | 208 | 530 | 11.4/3 | 76ecl | 0.3–1.0 | 0.32 |
(1) The coordinates and most of the optical magnitudes are taken from
Downes & Shara (1993). Note that
the Simbad coordinates are sometimes less accurate.
(2) References for table values:
PX And: Thorstensen et al. 1991, Still et al. 1995,
TT Ari: Cowley et al. 1975, Shafter et al. 1985,
KR Aur: Shafter 1983a, Antov et al. 1996,
BZ Cam: Lu & Hutchings 1985, Krautter et al. 1987,
BH Lyn: Richter 1989, Andronov et al. 1989, Dhillon et al. 1992,
Hoard & Szkody 1997,
DW UMa: Hessmann 1990, Honeycutt et al. 1993, Dhillon et al. 1994,
LX Ser: Young et al. 1981, Eason et al. 1984,
V442 Oph: Shafter & Ulrich 1982, Szkody & Shafter 1983,
MV Lyr: Schneider et al. 1981,
V794 Aql: Shafter 1983b,c, Honeycutt & Schlegel 1985,
V751 Cyg: Robinson et al. 1974, Bell & Walker 1980,
Greiner et al. 1998,
V425 Cas: Shafter & Ulrich 1982, Shafter 1983c, Wenzel 1987,
VY Scl: Hutchings & Cowley 1984,
VZ Scl: Schaefer & Patterson 1982, Sherrington et al. 1984,
O’Donoghue et al. 1987
(3) Eclipsing systems are marked by “ecl”.
(4) The formal best-fit result of M0.2 has
been regarded as implausible because it implies mass transfer
on a dynamical time scale (Thorstensen et al. 1991).
(5) MV=4 has been assumed in deriving the distance
(Krautter et al. 1987).
Previously (pre-ROSAT) known X-ray emission from VY Scl stars include V794 Aql (Szkody et al. 1981), TT Ari during the optical high state (Jensen et al. 1983), KR Aur during the optical high state (Mufson et al. 1980, Singh et al. 1993), LX Ser (Szkody 1981). These investigations have consistently concluded that the high X-ray luminosity expected from the boundary layer (10 erg/s), based on the high MV and thus accretion rate of the order of 10-8 /yr) was not detectable.
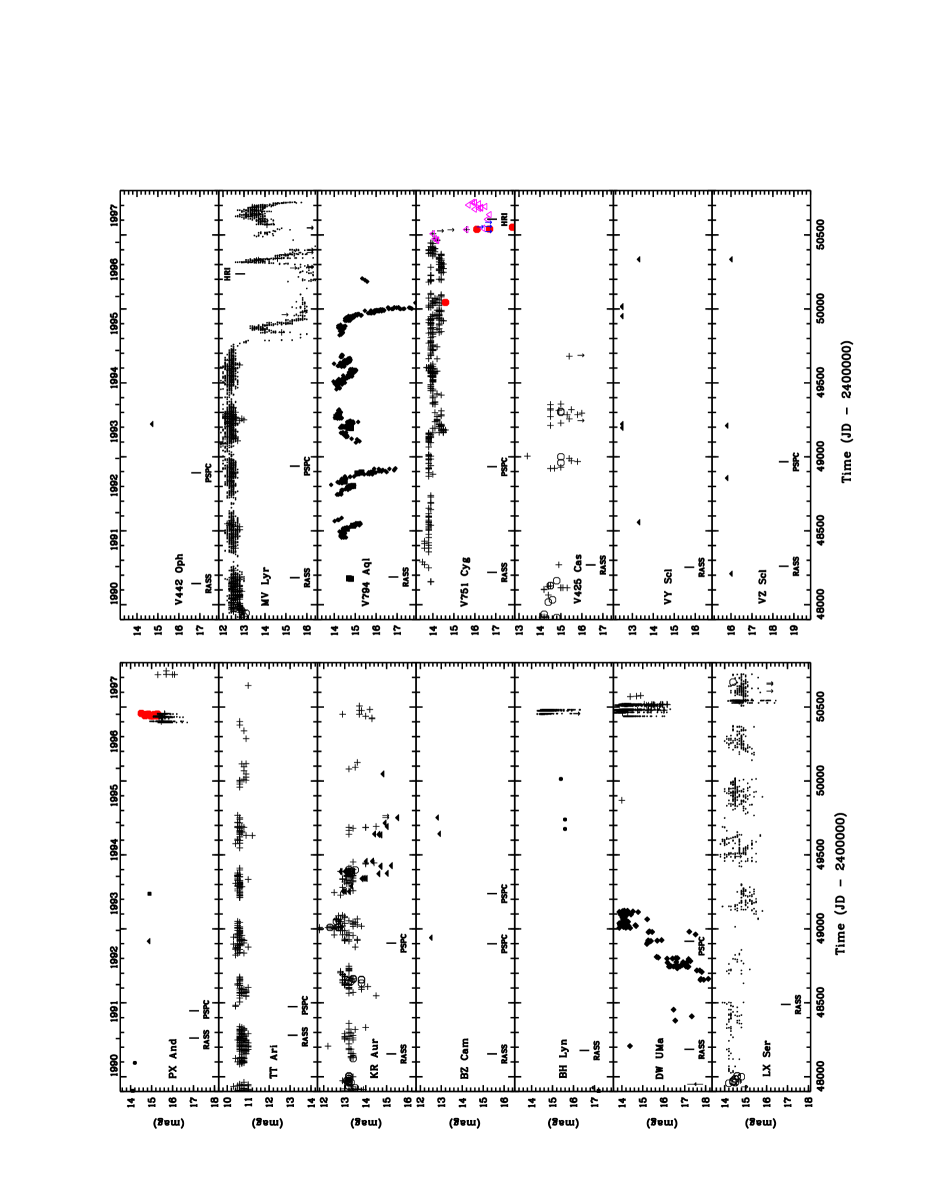
In order to relate the findings of this X-ray survey of VY Scl stars to some possibly underlying physical quantities, I have compiled some important system parameters like the apparent magnitude range, orbital period, distance, inclination and mass of the binary components from the available literature (Tab. 1). Also, I have collected the brightness estimates of the VY Scl stars over the last seven years from various sources in order to determine the optical state during which the ROSAT observations have been performed (Fig. 1). Many of the VY Scl stars are monitored by various amateur astronomers around the world and thus a substantial amount of monitoring data was available from the AAVSO, AFOEV and VSNET databases.
In the following I present a complete overview of the ROSAT observations of VY Scl stars during the all-sky survey as well as in subsequent pointed observations. Results for some of the ROSAT observations have been reported already earlier: on MV Lyr and KR Aur during their optical high state (Schlegel & Singh 1995; Richman 1996), on TT Ari (Baykal et al. 1995; Richman 1996), on BZ Cam (van Teeseling & Verbunt 1994), and on VZ Scl and DW UMa (van Teeseling et al. 1996). The results of the ROSAT all-sky survey detections of V794 Aql and BZ Cam have already been mentioned in Verbunt et al. (1997).
| Name | Date | Texp | offaxis | CR(2) | HR1 | HR2 | log L | opt. | D(4) |
|---|---|---|---|---|---|---|---|---|---|
| (sec) | angle | (cts/s) | (erg/s) | state | |||||
| PX And | Dec. 31, 1990–Jan. 1, 1991 | 350 | 0–55′ | 0.022 | – | – | –(5) | – | |
| Jul. 4/5, 1991 | 26 294 | 03 | 0.00520.0005 | 0.790.08 | 0.240.09 | 29.7 | 5′′ | ||
| TT Ari | Jan. 20/21, 1991 | 275 | 0–55′ | 0.3600.037 | 0.800.06 | 0.340.09 | 31.4 | high | 4′′ |
| Aug. 1/2, 1991 | 24 465 | 03 | 0.3660.006 | 0.820.01 | 0.340.01 | 31.4 | high | 1′′ | |
| KR Aur | Sep. 14/15, 1990 | 360 | 0–55′ | 0.0650.014 | 1.000.00 | 0.750.14 | 30.7 | high | 7′′ |
| Sep. 28–Oct. 6, 1992 | 17 255 | 03 | 0.0640.002 | 0.940.01 | 0.520.03 | 30.7 | high | 2′′ | |
| BZ Cam | Sep. 14/16, 1990 | 430 | 0–55′ | 0.0770.014 | 1.000.00 | 0.170.18 | 31.9 | 17′′ | |
| Sep. 29, 1992 | 6 117 | 02 | 0.0740.004 | 0.900.02 | 0.300.05 | 31.8 | high | 4′′ | |
| Sep. 3, 1993 | 4 591 | 02 | 0.0620.004 | 0.890.03 | 0.370.06 | 31.6 | 4′′ | ||
| BH Lyn | Oct. 7–9, 1990 | 460 | 0–55′ | 0.006 | – | – | –(6) | – | |
| DW UMa | Oct. 25–28, 1990 | 370 | 0–55′ | 0.033 | – | – | high | – | |
| Oct. 15, 1992 | 3 395 | 01 | 0.0110.002 | 0.280.14 | 0.310.16 | 31.3(7) | rise | 4′′ | |
| Oct. 15, 1992 | 1 710 | 01 | 0.0130.003 | 0.420.20 | 0.440.20 | 31.2(7) | rise | 6′′ | |
| LX Ser | Aug. 8–10, 1991 | 345 | 0–55′ | 0.037 | – | – | 31.1(7) | high | – |
| V442 Oph | Sep. 4/5, 1990 | 315 | 0–55′ | 0.014 | – | – | –(5) | – | |
| Sep. 22/23, 1992 | 11 385 | 41 | 0.0064 | – | – | –(5) | – | ||
| MV Lyr | Oct. 11–15, 1990 | 722 | 0–55′ | 0.0790.011 | 0.820.09 | 0.690.10 | 31.3 | high | 6′′ |
| Nov. 4–8, 1992 | 20 250 | 02 | 0.0690.002 | 0.840.02 | 0.450.02 | 31.2 | high | 4′′ | |
| May 28, 1996 | 2 218 | 01 | 0.0008(1) | – | – | 29.7 | low | – | |
| V794 Aql | Oct. 18, 1990 | 240 | 0–55′ | 0.0930.021 | 0.870.11 | 0.440.19 | 30.8(7) | high | 11′′ |
| V751 Cyg | Nov. 19/20, 1990 | 370 | 0–55′ | 0.019 | – | – | 30.3(7) | high | – |
| Nov. 3, 1992 | 3637 | 52 | 0.0058 | – | – | 30.8(7) | high | – | |
| Jun. 3, 1997 | 4663 | 03 | 0.110.02(1) | – | – | –(1) | low | 2′′ | |
| Dec. 2–8, 1997 | 10813 | 02 | 0.080.02(1) | – | – | –(1) | low | 7′′ | |
| V425 Cas | Dec. 30/31, 1990 | 380 | 0–55′ | 0.019 | – | – | –(6) | high | – |
| VY Scl | Nov. 23–25, 1990 | 85 | 0–55′ | 0.13 | – | – | 31.7(7) | – | |
| VZ Scl | Nov. 29–Dec. 1, 1990 | 290 | 0–55′ | 0.014 | – | – | high | – | |
| Dec. 5, 1992 | 3 354 | 02 | 0.0040.001 | 0.350.25 | 0.030.27 | 30.3(7) | high | 7′′ | |
| Dec. 5, 1992 | 2 237 | 02 | 0.0060.002 | 0.700.24 | 0.120.29 | 30.5(7) | high | 6′′ |
(1) All observations except the May 1996 pointing on MV Lyr and the
1997 pointings on V751 Cyg have been performed with the ROSAT
PSPC. For MV Lyr the HRI count rate has been transformed into a
PSPC rate by using the spectral fit parameters of the PSPC
observation. For V751 Cyg see Greiner et al. (1998).
(2) Count rates are calculated for the 0.1–2.4 keV range (= channels
11-240). Upper limits are 3 confidence level.
(3) The distances of Tab. 1 have been used, in particular
200 pc for TT Ari and 460 pc for LX Ser.
(4) Distance between best-fit X-ray position and optical position of
presumed counterpart.
(5) The upper limit of the count rate has not been combined with the
lower limit in distance.
(6) No distance known.
(7) A temperature of 0.4 keV has been assumed for the conversion of the
upper limit count rates or when the number of counts was below 100.
2 Observations
2.1 ROSAT all-sky survey and pointed observations
The ROSAT all-sky survey was performed between July 1990 and January 1991 and typically reached 300–400 sec exposure time near the ecliptic equator. Each position on the sky is scanned for 2 days (at the ecliptic equator) or more, and bright X-ray sources can be localized to about 10′′–20′′ accuracy. A total of 5 out of the 14 VY Scl stars are detected within the ROSAT all-sky survey, and upper limits are derived for the others. Tab. 2 gives the date and total duration of the exposure, the count rate in the position-sensitive proportional counter (PSPC), the two hardness ratios HR1 and HR2, and the distance between the best-fit X-ray position and the nominal optical position. The hardness ratio HR1 is defined as the normalized count difference (N50-200 – N10-40)/(N10-40 + N50-200), where Na-b denotes the number of counts in the PSPC between channel a and channel b. Similarly, the hardness ratio HR2 is defined as (N91-200 – N50-90)/N50-200 (note that HR1 is sensitive to the absorbing column).
A total of 8 out of 14 VY Scl stars have been the target of pointed ROSAT PSPC observations, and in all cases there have been positive detections. In 2 cases (V442 Oph and V751 Cyg), ROSAT PSPC pointings towards other prime targets led to serendipituous coverage, but yield only upper limits.
Furthermore, two VY Scl stars (MV Lyr and V751 Cyg) have been observed with the ROSAT high-resolution imager (HRI) as target-of-opportunity during times of optical low states, and results of these observations are reported elsewhere (Greiner et al. 1998).
A summary of all ROSAT observations of the 14 VY Scl stars is given in Tab. 2.
| Name | free parameter fit | fit with = | fit with kT=500000 K | |||||||||
|---|---|---|---|---|---|---|---|---|---|---|---|---|
| PX And | 137 | 0.387 | 2.501.10 | 180180 | 1.5 | 0.70 | 24080 | 0.51 | 0.71 | 328 | 2109 | 0.8 |
| TT Ari | 8955 | 0.619 | 0.120.02 | 32515 | 37.8 | 1.67 | 29030 | 47.2 | 3.75 | 2.20.1 | 5104 | 75 |
| KR Aur | 1105 | 4.042 | 0.19 | 51050 | 6.2 | 1.57 | 28520 | 16.1 | 2.8 | 322 | 21010 | 16 |
| BZ Cam | 737 | 0.788 | 1.2 | 27060 | 10.5 | 1.15 | 28530 | 8.8 | 1.12 | 352 | 81010 | 3.8 |
| DW UMa | 60 | 0.070 | 11.43.0 | 10080 | 940 | 0.32 | 28090 | 1.2 | 0.76 | 257 | 1109 | 1.6 |
| MV Lyr | 1397 | 0.575 | 0.03 | 49050 | 6.9 | 1.21 | 43040 | 7.6 | 2.4 | 412 | 31011 | 24 |
| V794 Aql | 22 | 0.640 | 3.53.0 | 220200 | 54.1 | 0.65 | 310170 | 16.8 | 0.58 | 1.10.8 | 1610 | 2.3 |
| VZ Scl | 27 | 0.166 | 0.01 | 220110 | 0.6 | 1.75 | 210110 | 0.73 | 1.64 | 1.20.9 | 308 | 2.0 |
(1) Note that photon statistics is very poor in several
cases, and fit results are an order of magnitude
estimate for .
is in units of 1021 cm-2,
in units of eV and
in units of 10-4 ph/cm2/s. The fit
with the most reasonable values (weighting absorbing
column and luminosity versus reduced ) is
printed
bold (except for DW UMa – see section 3.2.).
(2) Dickey & Lockman (1990)
2.2 Optical data
In order to evaluate the optical state of each VY Scl star during the time of the ROSAT X-ray observation all available brightness measurements have been collected. Most of the data, especially of the well sampled objects, were either supplied by the AAVSO (courtesy J. Mattei; PX And, BH Lyn, DW UMa, LX Ser, MVLyr) or taken from VSNET (http://www.kusastro.kyoto-u.ac.jp/vsnet/; PX And, DW UMa, V751 Cyg). In some cases (PX And, BH Lyn and DW UMa) dense CCD observations during the end of 1996 were included in the otherwise visual brightness estimates obtained from AAVSO, and the faint phases of the eclipses of all these three objects have not been taken out, so that the apparent scatter is large. Further data were supplied from Roboscope observations (courtesy K. Honeycutt), the UK Schmidt plates (courtesy S. Tritton), and the Sonneberg Observatory sky patrol (courtesy G. Richter). All these optical data are plotted in Fig. 1 together with the times of the ROSAT observations. Since the main emphasis is on the correlation with ROSAT observations, no attempt has been made to maintain fine structures in the individual light curves. Also, no color corrections have been applied to account for measurements in different photometric bands because these are usually rather small in VY Scl stars (typically B–V 0).
3 Results
3.1 X-ray spectral analysis
A comparison of the times of ROSAT observations with the optical state of the respective VY Scl star shows that in all cases of ROSAT PSPC observations (with the exception of DW UMa, see below) in which the optical state is known (80%) it has been the high state during the ROSAT observation (Fig. 1). Thus, in the following I will exclusively talk about X-ray emission of VY Scl stars during their optical high state.
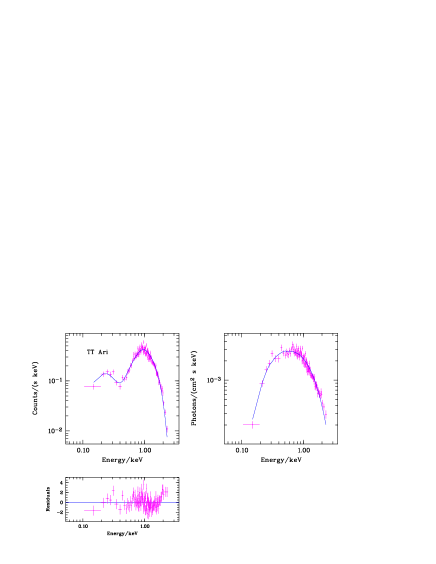
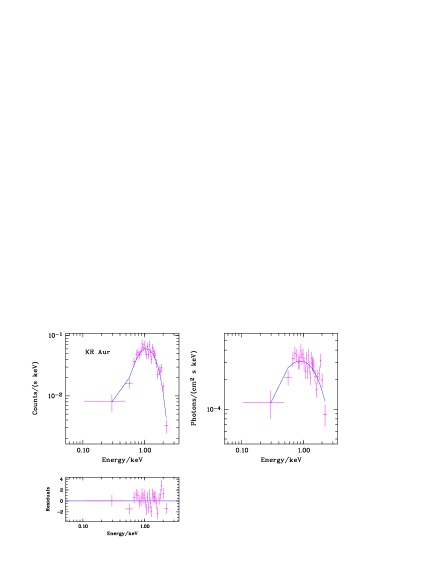
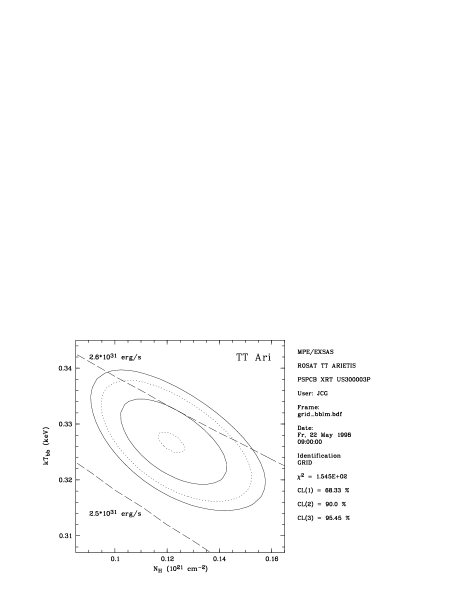
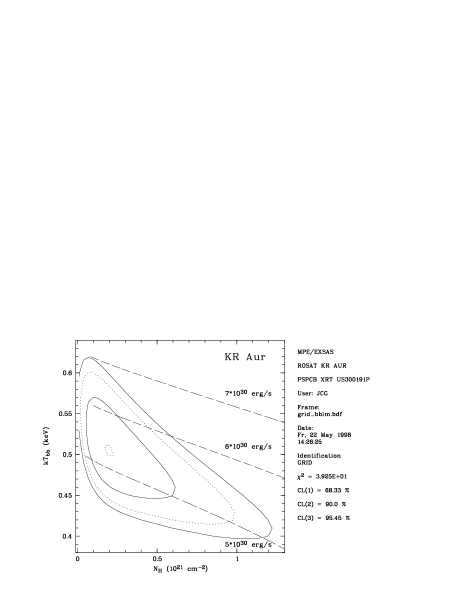
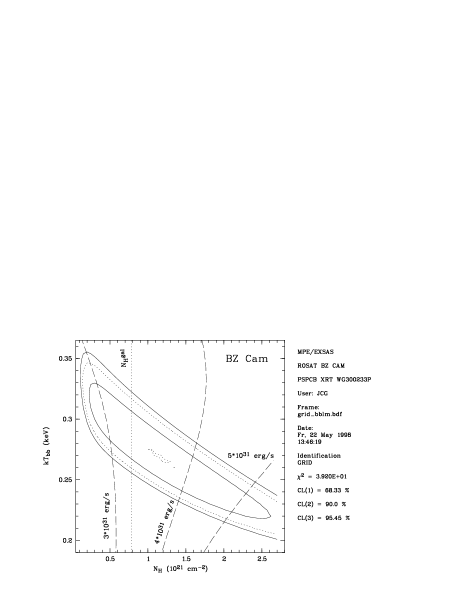
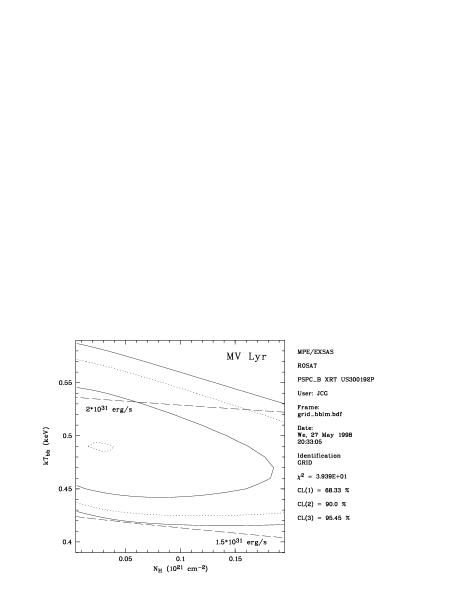
All VY Scl stars detected with the ROSAT PSPC show a surprising uniformity in their hardness ratios, i.e. their global spectral shape. Spectral fits to the objects with more than 100 photons consistently result in the fact that power law, thermal bremsstrahlung or Raymond-Smith models give worse results than blackbody fits (this has already been noted earlier by van Teeseling et al. 1996 for two objects), and that the range of blackbody temperatures is rather narrow (between 0.25–0.5 keV). As an example, the best-fit of a thermal bremsstrahlung spectrum to the high signal-to-noise ratio spectrum of TT Ari results in a reduced =1.99, the best-fit Raymond-Smith thermal plasma model in a reduced =1.87 and the best-fit power law model in a reduced =2.23 as compared to the reduced =1.67 of a blackbody model (see below for an explanation why the reduced values are such high). Fig. 3 shows the significance contours in the -plane for the 4 objects with 500 photons demonstrating the rather tight constraints on both the temperature and luminosity.
As the high signal-to-noise spectra show (Fig. 2), they deviate systematically from a simple blackbody model (see the bad reduced values of the best-fits of TT Ari, KR Aur and MV Lyr in Tab. 3 and the residuals in Fig. 2). In the cases of MV Lyr and KR Aur this has been noted already by Schlegel & Singh (1995) who speculated about the presence of Fe L-shell emission. I will not elaborate on this any further, and only note that this could be a generic property of VY Scl stars which has to be investigated with the next generation X-ray telescopes with high sensitivity and spectral resolution.


Given the poor knowledge of the distance and the effect of the absorbing column in a few systems it is worth noting that besides the spectral parameters also the X-ray luminosities are in a narrow range between log LX = 30.7–31.5 erg/s. (This is independent of the interpretation as blackbody emission and has been noted also for other non-magnetic cataclysmic variables by van Teeseling et al. 1996). A different notion of the same fact is that the implied blackbody radii of the emitting region are within the narrow range of 50–120 m.
3.2 X-ray temporal analysis
A detailed X-ray temporal analysis is only possible for the four brightest objects, and is beyond the subject of this paper. For the purpose of showing the degree of short-term variability two examples are given in Fig. 4 (TT Ari at the top and MV Lyr). It consists of two time short stretches out of the total exposure and demonstrates that the X-ray emission of TT Ari and MV Lyr are strongly variable by factors of about 3–5 on time scales of 20–100 sec.


3.3 Notes on individual objects
TT Ari pointed observations with ROSAT have been investigated in detail by Baykal et al. (1995). My spectral fit result is in agreement with their findings (except for the normalization which seems to be a misprint of their exponent given the nearly exact coincidence in figure). In particular, as can be seen from their Tab. 1, they also find that the blackbody model gives the lowest reduced though they do not comment on this. Baykal et al. (1995) find in addition that the X-ray emission is strongly modulated with orbital period and, based on the phasing, relate the X-ray emission to an extended region around the impact site of the accretion stream onto the disk.
BZ Cam has been investigated already by van Teeseling & Verbunt (1994) and nothing new is reported here. Our results are in perfect agreement in all respects.
DW UMa is the only source in the present sample which deviates substantially from the rather tight range of hardness ratios, i.e. being much softer. Looking at the optical light curve during the PSPC observation shows that DW UMa was recovering from a minimum at the time of the X-ray observation. Unfortunately, the low number of counts does not allow to quantify this effect (Tab. 3).
MV Lyr: The X-ray emission of MV Lyr during the optical high state is similar to that of all other VY Scl stars described here. However, when I observed MV Lyr on 28 May 1996 at the end of the 9 week optical low state, no X-rays were detected at all. The upper limit imposed by this observation (based on the assumption of a hard X-ray source and thus a PSPC/HRI conversion factor of about 3) is a factor 30 lower than the flux measured during the optical high state in 1990 and 1992.
V751 Cyg has by purpose been observed twice during its recent optical low state. The detection of strong X-ray emission during these observations and its interpretation using also additional archival IUE and quasi-simultaneous optical observations will be given in a separate paper (Greiner et al. 1998).
VY Scl has been marginally detected (7 photons) at a position 50′′ off the nominal optical position during the ROSAT all-sky survey. Given the few photons and the ROSAT all-sky scanning mode, these photons could be related to VY Scl though the distance between X-ray and optical position for all other detections is less than 17′′ (see Tab. 2). If the detection is true, VY Scl would be the second brightest X-ray emitter among its class (based on its X-ray count rate), suggesting either a rather small distance or a high intrinsic luminosity. While this can be verified in future X-ray observations, I conservatively take the measured flux at 50′′ off the nominal position as an upper limit for VY Scl (see Tab. 2).
4 Discussion
4.1 Comparison between VY Scl stars and dwarf novae
Not much is known on the systematics of X-ray behaviour of VY Scl stars. It may therefore be helpful to compare the properties of VY Scl stars to other non-magnetic cataclysmic variables, in particular dwarf novae. The general picture (of dwarf novae) is that the X-ray intensity follows the optical brightness though sometimes with considerable delays. At a closer look is appears that during quiescence dwarf novae are only detectable at hard (few keV) X-rays while at outburst an additional strong soft component emerges. The standard interpretation is that during quiescence a hot and optically thin boundary layer produces hard X-rays while during outburst the boundary layer becomes optically thick thus producing the soft component.
The nature of the X-ray emission in dwarf novae during quiescence has been demonstrated by using X-ray eclipse measurements to arise very close to the white dwarf (Mukai et al. 1997, van Teeseling 1997). The lack of correlation between X-ray temperature or luminosity with accretion rate (van Teeseling et al. 1996) and the evidence of orbital modulation of the X-ray intensity from some non-eclipsing systems (van Teeseling & Verbunt 1994, Baykal et al. 1996) argue against the simple boundary layer picture. On the other hand, the evidence for an anti-correlation between observable emission measure and orbital inclination suggests that the X-rays are emitted close to the white dwarf and not by an optically thin cloud much larger than the white dwarf radius (van Teeseling et al. 1996).
Given the high accretion rate in VY Scl stars during optical high state one would naively expect that their X-ray spectra should be softer than those of dwarf novae during quiescence and similar to dwarf novae in outburst. This is not born out by observations. Dwarf novae during quiescence have typically softer hardness ratios than high accretion rate systems including VY Scl stars (Patterson & Raymond 1985, van Teeseling et al. 1996). Moreover, the finding that VY Scl stars during their optical high state are consistently described by blackbody models with temperatures in the narrow range of 250–500 eV extends an earlier finding of van Teeseling et al. (1996) that VY Scl stars and non-SU UMa systems either are intrinsically absorbed or do not have simple bremsstrahlung spectra.
These differences in X-ray behaviour between dwarf novae during outburst and VY Scl stars are not surprising because there are several other distinct differences other than at X-rays. These can be summarized as follows (Hack & la Dous 1993, Warner 1995):
-
•
The rise and decline times are not similar. In dwarf novae a surprisingly tight correlation was found between the decline time from outburst and the orbital period (Bailey 1975), suggesting that the size of the disk is somehow related to its cooling time after outburst. In VY Scl stars the rise and decay times are much longer than this relation would imply.
-
•
In contrast to dwarf nova there are no traces of outburst behaviour during the long low-state behaviour of VY Scl stars.
-
•
In many VY Scl stars the hump in the orbital light curve (usually interpreted as being due to the hot spot where the accretion stream hits the disk) has a significantly shorter length (0.3 ) than in dwarf novae (0.5 ). It has been argued that this is no physical difference but just due to the smaller intensity contrast between hot spot and disk continuum emission in VY Scl stars. However, in some VY Scl stars the hump occurs after eclipse which has never been observed in dwarf novae.
-
•
Flickering may cease during the optical low states in VY Scl stars whereas this has never been found in dwarf novae.
-
•
The optical/UV spectra of VY Scl stars show signs of higher excitation than in dwarf novae, most notably HeII 4686 and CIII/NIII 4650.
-
•
The UV spectra of VY Scl stars are quite different from those of dwarf novae, the majority of them showing even cooler continua than in dwarf novae. It has been suggested that this may be caused by a systematic difference in the masses of the white dwarfs.
-
•
The transitions between high and low states manifest themselves in completely opposite color changes: in dwarf novae the flux changes are largest in the UV and only marginal at IR wavelengths whereas in VY Scl stars mostly the optical and IR emission changes.
Given these differences between VY Scl stars and dwarf novae and the systematic difference of the X-ray spectra of VY Scl stars from those of dwarf novae in outburst, one may ask how the generally discussed X-ray emission regions in non-magnetic cataclysmic variables compare with the X-ray spectral characteristics of VY Scl stars. This will be discussed in turn in the following sections.
4.2 Is a blackbody model reasonable?
As noted in section 3.1. a blackbody model gives the lowest reduced values among the single component models tested. In the blackbody model interpretation the combination of best-fit parameters and distances results in an estimate of the size of the emitting area of only 50–120 m. This inferred size is much smaller than anything we know of in a cataclysmic binary system. One therefore may be inclined to doubt the fit results.
However, as Fig. 3 shows the cross-relation between temperature and absorbing column is such that the variations compensate in the sense that the resulting luminosity is in a very narrow range (see the overplotted lines of constant luminosity in Fig. 3). This is due to the fact that the maximum of the blackbody emission is well within the energy range of the ROSAT PSPC. Thus, even with the larger uncertainties in the fit parameters of the sources with 500 photons the luminosity is still rather well constrained. Therefore, the uncertainties due to low photon numbers imply only a small uncertainty in the size of the emitting area.
One is therefore left to either adopt a blackbody model (with the parameters as given in section 3.1.) or to reject a blackbody model interpretation at all. The latter option finds additional support in the strength and location of the fit residuals around 1 keV mentioned earlier. Schlegel and Singh (1995) have suggested Fe L-shell emission as a possible explanation of these residuals. Oxygen K-shell emission would be an at least similarly appropriate alternative. If line emission is indeed present then the best continuum model to compare with would actually be a hot plasma Raymond-Smith model. As noted earlier, a Raymond-Smith model with solar abundances gives a poorer fit to the ROSAT data than a blackbody model. While it maybe possible to achieve reasonably low reduced values by tuning the relative metal abundances or by introducing multi-temperature components, the anticipated results will be quite uncertain due to the given energy resolution of the PSPC. Thus, I leave such an exercise for a future investigation and continue with the discussion of possible emission sites.
4.3 The classical boundary layer picture
The high and the optical spectra of VY Scl stars during the optical high state imply an optically thick accretion disk. According to standard theory the accretion disk dominates the optical-UV-X-ray luminosity in most non-magnetic cataclysmic variables. That is, the observed features mostly relate to the disk properties which in turn are governed by the mass transfer rate .
A very early prediction of non-magnetic cataclysmic variable theory was for the existence of a hot boundary layer (Pringle 1977, Pringle & Savonije 1979, Tylenda 1981). The matter at the inner edge of the accretion disk rotates with 1000 km/s (Keplerian) and will shear on to the surface of the slowly rotating white dwarf (assumed to rotate below its break-up rate) thus dissipating its kinetic energy in the so-called boundary layer (Lynden-Bell & Pringle 1974). Thus, the boundary layer luminosity should equal that of the disk, i.e. GMWDacc/2RWD 1034–1035 erg/s with MWD and RWD being the mass and radius of the white dwarf, respectively and acc being the mass accretion rate. Depending on the accretion rate the boundary layer is expected to be either optically thin (at low ) with temperatures of 108 K (Pringle & Savonije 1979, Tylenda 1981) or to form an optically thick ring around the white dwarf equator (at high ) with temperatures of 200000–500000 K (Pringle 1977, Kley 1989).
This picture of an optically thick boundary layer has been elaborated in more detail by Popham & Narayan (1995) by exploring the parameter space of temperatures and luminosities depending on the mass and rotation of the white dwarf, the accretion rate and the viscosity parameter. Their predictions are in line with the earlier estimates and yield maximum temperatures of about 800000 K and X-ray luminosities always larger than 1034 erg/s.
Thus, the observed X-ray characteristics of VY Scl stars (Tab. 3) during the optical high state with temperatures in the 3–5106 K range and luminosities of 10 erg/s are distinctly different from those expected in the classical boundary layer picture in that the temperature is intermediate between the two types of boundary layer models and the luminosity is lower than either type of model.
4.4 Heavily absorbed classical boundary layer emission
The UV observations with IUE over the last 2 decades have accumulated much evidence that high accretion rate cataclysmic variables possess strong stellar winds as revealed by the P Cygni profiles of UV resonance lines, predominantly CIV1549, NV1240 and SiIV1397. It has consequently been argued that the lack of detecting the expected luminous and soft boundary layer emission is due to the fact that the wind is strong enough to either absorb the boundary layer emission considerably or even be optically thick for soft X-rays.
In the first case, one therefore would expect a heavily absorbed 200000–500000 K emission. I have tested this possibility by fitting the X-ray spectra with a fixed blackbody temperature of eV (500000 K). Though it is difficult to distinguish for some low signal-to-noise spectra an unabsorbed high-temperature model from an absorbed low-temperature model, it can be seen from Tab. 3 (last column) that applying this model generally results in much worse reduced . The fits are generally so bad that it seems unlikely that this could be affected by the systematic deviations from a smooth spectrum around 1 keV (as discussed above). For lower temperatures the fits get even worse. I tentatively conclude that a heavily absorbed classical boundary layer emission is not a promising explanation of the observed X-ray spectrum of VY Scl stars.
4.5 X-ray emission from an optically thick wind
If, as explained in the previous section, the wind is completely optically thick for the boundary layer emission, one would only see the thermal emission from the wind itself (Mauche & Raymond 1987, Hoare & Drew 1993). However, its size is expected to be much larger than the derived value of 50–120 m, and secondly its temperature is not expected to be considerably higher than that of the boundary layer, and therefore thermal emission from the wind is not a likely candidate for the observed 0.2–0.5 keV emission in VY Scl stars. Independent of the blackbody model interpretation the seemingly periodic variation of the X-ray intensity in TT Ari (Baykal et al. 1995) as well as the short-term variability on 20–100 sec scales argues against a wind interpretation.
Alternatively, if the winds are radiation driven then one may expect that shocks will be present in the wind. This could give rise to hard X-ray emission similar to the one observed in the winds of O stars (Berghöfer & Schmitt 1994).
4.6 Coronal region above the accretion disk
There is extensive observational evidence for the existence of hot, low-density coronae above accretion disks. Various processes may lead to the formation and heating of such a corona, e.g. X-ray illumination of the disk (Begelman et al. 1983), thermal instabilities in the disk atmosphere due to the density dependence of the opacity (Shaviv & Wehrse 1986) or the vertical propagation of sound waves in the disk (Murray & Liu 1992). The common feature of all these models is that the emission is optically thin and extended to approximately the size of the binary system. The evidence of superior spectral fits of blackbody models as opposed to optically thin emission argues against a hot corona as the origin of the 0.25-0.5 keV emission in VY Scl stars during their optical high state. As noted in the previous subsection, independent of the blackbody model interpretation the seemingly periodic variation of the X-ray intensity in TT Ari (Baykal et al. 1995) as well as the short-term variability on 20–100 sec scales argues against a large emission area interpretation.
4.7 Coronal emission of the late-type companion star
For a few of the VY Scl stars the spectral type of the companion has been determined. Given the small range in orbital period of the VY Scl stars the small range in spectral type of M3–M5 is not unexpected, and also coincides with the relation between period and secondary spectral type found for other cataclysmic variables (Echevarria 1983). Typical X-ray luminosities of the coronal emission of M dwarfs (Fleming et al. 1993, Pye et al. 1994) range between 1027–1028 erg/s. Though the secondaries in cataclysmic variables are expected to be rapidly rotating and magnetically active, and thus their X-ray emission could be somewhat larger than that of field stars, it seems unlikely that it would be larger by an order of magnitude or more. Also, the temperature of the observed X-ray emission of late-type field stars are of order a factor 10 lower than those presented here for VY Scl stars during optical high state. Finally, the drop of the X-ray emission from MV Lyr during the optical low state by a factor of 5–7 as compared to the optical high state emission would be difficult to reconcile with coronal emission from the secondary. Thus, the secondaries in VY Scl stars are not expected to be responsible for the observed X-ray emission during optical high state.
4.8 Evaporation of the accretion disk
The disk instability model successfully explains dwarf novae outbursts except of two observational features, namely the UV lag behind the optical rise and the appearance and gradual decline of hard (few keV) X-ray emission during the optical decline after an outburst. Meyer & Meyer-Hofmeister (1994) have shown that above a cool disk a coronal siphon flow exists which evaporates mass from the disk into the corona and accretes it onto the white dwarf. While during outburst the X-ray radiation of dwarf novae is thought to originate from shocks connected with radiation driven winds, X-rays during quiescence are caused by either the white dwarf boundary layer (higher temperature and thus harder X-rays) or the corona in connection with the evaporation process (lower temperature, i.e. softer X-ray emission). The temperature in the corona scales as K (with r cm) and thus typically is in the few keV range (Meyer & Meyer-Hofmeister 1994). While this scenario produces a long delay between X-ray and optical outburst emission (as observed) and also explains the change in the X-ray spectrum along the outburst of dwarf novae, it is not clear whether or not the whole picture is applicable also to VY Scl stars which spend most of their time in the high state and thus during this state should have appreciable accretion via the corona. Estimates of the spherical accretion onto the white dwarf via the corona range around 10-11 /yr (Meyer & Meyer-Hofmeister 1994) as opposed to the 10-8 /yr deduced for VY Scl stars during their optical high states. Also, the size of the corona is much larger than the deduced 50–120 m emission size from the blackbody spectra.
4.9 Stream impact region
The region where the stream impacts on the outer rim of the accretion disk could have a size which is comparable to that derived from the blackbody fits. Also, since the accretion rate in VY Scl stars is high, the stream impact is expected to have substantial effects on the local dynamics, e.g. heating up the impact point, overflowing the outer disk or significant splashing leading to expansion of material in all directions (Armitage & Livio 1998, Hellier 1998, Spruit & Rutten 1998). However, both observations and modelling consistently result in temperatures of 100000 K at maximum, a factor of more then 10 below the values derived from the ROSAT PSPC spectral fits.
5 Conclusions
The X-ray emission of VY Scl stars during optical high states is characterized by 0.25–0.5 keV blackbody emission from a 50–120 m sized region. In the case of MV Lyr I found evidence for a drop in X-ray flux by a factor of 5–7 during an optical low state observation suggesting that the emission is related to the change in accretion rate (which is thought to accompany the high/low state transitions) and not to the secondary coronal emission. At this time, I cannot offer a simple explanation for this emission. I cannot exclude the possibility that with the spectral resolution of the ROSAT PSPC the X-ray continuum determination is in error, and one may be fooled by emission which is not optically thick. Future X-ray observations with higher spectral resolution are thus clearly demanded.
It seems worth investigating the properties of other nova-like cataclysmic variables which do not belong to the VY Scl class to check whether the X-ray properties found for VY Scl stars are unique to this sub-class or are related to the high accretion rate in nova-like CVs in general.
Acknowledgements.
I’m grateful to R. Di Stefano for very fruitful discussions and thank R. Popham, A. van Teeseling and S. Komossa for helpful comments on an earlier version of this paper. Much of the optical data presented in Fig. 1 were taken from the VSNET. Additional data were provided by Janet Mattei (AAVSO), Kent Honeycutt (Indiana Univ.), Sue Tritton (UK Schmidt plates), and Gerold Richter (Sonneberg Observatory) which I greatfully acknowledge. JG is supported by the German Bundesministerium für Bildung, Wissenschaft, Forschung und Technologie (BMBF/DLR) under contract No. FKZ 50 QQ 9602 3. The ROSAT project is supported by BMBF/DLR and the Max-Planck-Society. This research has made use of the Simbad database, operated at CDS, Strasbourg, France.References
- (1) Andronov I.L., Kimeridze G.N., Richter G.A., Smykov V.P., 1989, IBVS 3388
- (2) Antov A.P., Konstantinova-Antova R., Semkov E., Borissov N., Georgiev T., Umlenski V., 1996, IBVS 4315
- (3) Armitage P.J., Livio M., 1998, ApJ 493, 898
- (4) Bailey J., 1975, Journ. Brit. Astr. Ass. 86, 30
- (5) Baykal A., Esendemir A., Kiziloglu U., Alpar M.A., Ögelman H., Ercan N., Ikis G., 1995, A&A 299, 421
- (6) Begelman M.C., McKee C.F., Shields G.A., 1983, ApJ 271, 70
- (7) Bell M., Walker M.F., 1980, BAAS 12, 63
- (8) Berghöfer Th., Schmitt J.H.M.M., 1994, Science 265, 1689
- (9) Burrell J.F., Mould J.R., 1973, PASP 85, 627
- (10) Cowley A., Crampton D., Hutchings J.B., Marlborough J.M., 1975, ApJ 195, 413
- (11) Crampton D., Hutchings J.B., Cowley A.P., Schmidtke P.C., McGrath T.K., O’Donoghue D., Harrof-Allin M.K., 1996, ApJ 456, 320
- (12) Dhillon V.S., Jones D.H.P., Marsh T.R., Smith R.C., 1992, MNRAS 258, 225
- (13) Dhillon V.S., Jones D.H.P., Marsh T.R., 1994, MNRAS 266, 859
- (14) Dickey J.M., Lockman F.J., 1990, ARAA 28, 215
- (15) Dobashi K., Bernard J.-P., Yonekura Y., Fukui Y., 1994, ApJS 95, 419
- (16) Downes R.A., Shara M.M., 1993, PASP 105, 127
- (17) Eason E.L.E., Worden S.P., Klimke A., Africano J.L., 1984, PASP 96, 372
- (18) Echevarría J., 1983, Rev. Mex. Astron. Astrofis 8, 109
- (19) Fleming T.A., Giampapa M.S., Schmitt J.H.M.M., Bookbinder J.A., 1993, ApJ 410, 387
- (20) Greiner J., Tovmassian G., DiStefano R., Prestwich A., González-Riestra R., Szentasko L., 1998b (in prep.)
- (21) Jensen K.A., Cordova F.A., Middleditch J., Mason K.O., Grauer A.D., Horne K., Gomer R., 1983, ApJ 270, 211
- (22) Hack M., la Dous C., 1993, Cataclysmic Variables and Related Objects, NASA Monograph Series, NASA SP-507, Washington, USA
- (23) Hellier C., 1996, ApJ 471, 949
- (24) Hellier C., 1998, PASP 110, 420
- (25) Hessmann F.V., 1990, IAU Circ. 4971
- (26) Hoard D.W., Szkody P., 1997, ApJ 481, 433
- (27) Hoare M.G., Drew J.E., 1993, MNRAS 260, 647
- (28) Honeycutt R.K., Schlegel E.M., 1985, PASP 97, 1189
- (29) Honeycutt R.K., Livio M., Robertson J.W., 1993, PASP 105, 922
- (30) Honeycutt R.K., Cannizzo J.K., Robertson J.W., 1994, ApJ 425, 835
- (31) Hutchings J.B., Cowley A.P., 1984, PASP 96, 559
- (32) King A.R., Cannizzo J., 1998, ApJ (in press)
- (33) Kley W., 1989, A&A 222, 141
- (34) Kraft R.P., 1964, in “First Conf. on Faint Blue Stars”, ed. W.J. Luyten (Minneapolis: Univ. of Minnesota), p. 100
- (35) Krautter J., Klaas U., Radons G., 1987, AA 181, 373
- (36) Livio M., Pringle J.E., 1994, ApJ 427, 956
- (37) Lu W., Hutchings J.B., 1985, PASP 1997, 990
- (38) Lynden-Bell D., Pringle J.E., 1974, MNRAS 168, 603
- (39) Meyer F., Meyer-Hofmeister. E., 1994, A&A 288, 175
- (40) Mouche C.W., Raymond J.S., 1987, ApJ 323, 690
- (41) Mufson S.L., Wisniewski W.Z., McMillian R.S., 1980, IAU Circ. 3471
- (42) Mukai K., Wood J.H., Naylor T., Schlegel E.M., Swank J.H., 1997, ApJ 475, 812
- (43) Murray S.D., Lin D.N.C., 1992, ApJ 384, 177
- (44) O’Donoghue D., Fairall A.P., Warner B., 1987, MNRAS 225, 43
- (45) Osaki Y., 1996, PASP 108, 39
- (46) Patterson J., Raymond J.C., 1985, ApJ 292, 535
- (47) Patterson J., Patino R., Thorstensen J.R., Harvey D., Skillman D.R., Ringwald F.A., 1996, AJ 111, 2422
- (48) Popham R., Narayan R., 1995, ApJ 442, 337
- (49) Pringle J.E., 1977, MNRAS 178,195
- (50) Pringle J.E., Savonije G.J., 1979, MNRAS 187, 777
- (51) Pye J.P., Hodgkin S.T., Stern R.A., StaufferJ.R., 1994, MNRAS 266, 798
- (52) Richman H.R., 1996, ApJ 462, 404
- (53) Richter G.A., 1989, IBVS 3287
- (54) Richter G.A., 1998 (priv. comm.)
- (55) Robinson E.L., Nather R.E., Kiplinger A., 1974, PASP 86, 401
- (56) Schaefer B.E., Patterson J., 1982, IAU Circ. 3756
- (57) Schlegel E.M., Singh J., 1995, MNRAS 276, 1365
- (58) Schneider D.P., Young P., Shectman S.A., 1981, ApJ 245, 644
- (59) Shafter A.W., Ulrich R.K., 1982, BAAS 14, 880
- (60) Shafter A.W., 1983a, ApJ 267, 222
- (61) Shafter A.W., 1983b, IBVS 2377
- (62) Shafter A.W., 1983c, Ph.D. thesis, UCLA
- (63) Shafter A.W., Szkody P., Liebert J., Penning W.R., Bond H.E., Grauer A.D., 1985, ApJ 290, 707
- (64) Shakhovskoy N.M., Kolesnikov S.V., Andronov I.L., 1995, in Abano-Padova Conf. on Cataclysmic variables, eds. A. Bianchini, M. Della Valle, M. Orio, ASSL 205, 187
- (65) Shaviv G., Wehrse R., 1986, AA 159, L5
- (66) Sherrington M.R., Bailey J., Jameson R.F., 1984, MNRAS 206, 859
- (67) Singh J., Vivekanandra Rao P., Agrawal P.C., Apparao K.M.V., Manchanda R.K., Sanwal B.B., Sarma M.B.K., 1993, ApJ 419, 337
- (68) Spruit H.C., Rutten R.G.M., 1998, AA (in press)
- (69) Still M.D., Dhillon V.S., Jones D.H.P., 1995, MNRAS 273, 863
- (70) Szkody P., 1981, PASP 93, 456
- (71) Szkody P., Crosa L., Bothun G.D., Downes R.A., Schommer R.A., 1981, ApJ 249, L61
- (72) Szkody P., Shafter A.W., 1983, PASP 95, 509
- (73) Thorstensen J.R., Ringwald F.A., Wade R.A., Schmidt G.D., Norsworthy J.E., 1991, AJ 102, 272
- (74) Tylenda R., 1981, Acta Astr. 31, 267
- (75) van Teeseling A., Verbunt F., 1994, A&A 292, 519
- (76) van Teeseling A., Beuermann K., Verbunt F., 1996, A&A 315, 467
- (77) van Teeseling A., 1997, A&A 319, L25
- (78) Verbunt F., Bunk W.H., Ritter H., Pfeffermann E., 1997, A&A 327, 602
- (79) Warner B., 1987, MNRAS 227, 23
- (80) Warner B., 1995, Cataclysmic Variable Stars, Cambridge Univ. Press
- (81) Wenzel W., 1987, IBVS 3086
- (82) Young P., Schneider D.P., Schectman S.A., 1981, ApJ 244, 259