A Technique for Narrowband Time Series Photometry: the X-ray Star V2116 Oph
Abstract
We have used innovative features of the Taurus Tunable Filter instrument on the 3.9-m Anglo-Australian Telescope to obtain nearly-continuous, high-throughput, linear photometry of V2116 Oph in a 7 Å bandpass at the center of the O I 8446 emission line. This instrumental technique shows promise for applications requiring precise, rapid, narrowband photometry of faint objects.
The spectrum of V2116 Oph, the counterpart of GX 1+4 (=X1728–247), is exotic, even among the unusual spectra of other optical counterparts of compact Galactic X-ray sources. The second strongest emission line is an unusual one, namely extremely prominent O I 8446, which is likely to result from pumping by an intense Ly radiation field. As the X-radiation from GX 1+4 is steadily pulsed, with typical pulsed fractions of 0.4, the O I 8446 emission in V2116 Oph may also be strongly modulated with the current 127 s period of the X-ray source. If so, this may well allow us to obtain high signal-to-noise radial velocity measurements and thus to determine the system parameters. However, no such pulsations are detected, and we set an upper limit of % (full-amplitude) on periodic 8446 oscillations at the X-ray frequency. This value is comparable to the amplitude of continuum oscillations observed on some nights by other workers. Thus we rule out an enhancement of the pulsation amplitude in O I emission, at least at the time of our observations.
Accepted for publication in PASP
To appear in volume 110, August 1998
received 1998 March 4; accepted 1998 May 25
1 INTRODUCTION
GX 1+4 (=X1728–247), a classical, luminous X-ray binary observed for 25 years, is projected very close to the galactic center and probably is at a distance of kpc, as the inferred X-ray luminosity is then erg s-1, near the Eddington limit. The spectrum of the optical counterpart, first identified by Glass & Feast (1973) and now known as V2116 Oph, has at times shown higher excitation emission lines than any other known X-ray star; for example, [Fe X] (I. P. = 235 eV) and [Ar XI] appeared (Davidsen et al. 1977). The spectrum appears to be markedly time variable on scales from minutes to years; in recent epochs, the highest excitation lines have disappeared (Chakrabarty & Roche 1997), but enormously strong H emission remains.
The symbiotic-like optical spectrum of V2116 Oph directly shows the presence of a red giant, of type near M5 III (Chakrabarty & Roche 1997), and suggests that we may be viewing the system at a very special, short-lived stage, when the normal primary is passing through a quite brief phase of its evolution. This point is made even more vivid by the X-ray behavior. GX 1+4 is an X-ray pulsar with a coherent X-ray period of about 130 s, a pulse amplitude 0.4, and an enormous X-ray period derivative of s yr-1 (Laurent et al. 1993 and references therein). While the period is slow, although not inordinately slow for X-ray binaries, the spin-up rate is the fastest for any known X-ray pulsar. The characteristic age, yr, confirms that this is an amazingly rapidly evolving object. More recent X-ray observations show that the X-ray has reversed sign, although the modulus remains very large (Laurent et al. 1993, Chakrabarty et al. 1997). It seems clear that in GX 1+4 we have the chance to observe an X-ray pulsar undergoing rapid evolution.
Yet even the orbital parameters of this system remain unknown, and the detection of an optical analogue to the X-ray pulses could yield an elegant and accurate radial velocity solution (§3). Recently broadband optical flickering and pulsations at the X-ray period have indeed been reported from V2116 Oph, at an amplitude of a few percent (Jablonski et al. 1997, Jablonski & Pereira 1997). These data seem to indicate a complex and/or erratic dependence of pulse amplitude on wavelength, optical brightness of the system, etc., and further observations will clearly be needed to sort out the situation.
The second strongest emission line after H in the optical spectrum of V2116 Oph is a remarkable one, namely extremely prominent O I 8446, which can be readily seen in our low-resolution spectrum in Fig. 1. This line has been reported in a small number of interesting objects ranging from Seyfert galaxies to occasional odd stars. In some objects, the great observed strength relative to other common species must be explained by some type of preferential emission mechanism. Grandi (1975, 1976) suggested that pumping by an intense Ly radiation field, in a wavelength coincidence (Ly) not dissimilar to the famous Bowen mechanism in which He II Ly pumps O III and N III in nebulae and mass-exchange binaries, may be responsible. O I 8446 has been reported at great strength in the symbiotic star V1016 Cyg (Rudy et al. 1990), and the presence there of the OI line at the expected strength confirms that Ly pumping is the mechanism.
As V2116 Oph is exposed to erg s-1 of pulsed ionizing radiation, it seems possible that pulsed Lyman photons may trigger coherent 127 s pulsations in O I 8446, possibly at quite large amplitudes. Here we report on a search for these pulsations using an innovative technique with applicability to a variety of other problems.
2 OBSERVATIONS AND DATA REDUCTION
The Taurus Tunable Filter (TTF) is a narrowband interference filter consisting of a red “arm” covering 6300 Å 9600 Å and a blue “arm” covering 3700 Å 6500 Å, with an adjustable passband of between 6 Å and 60 Å. It is now available for use on the Anglo-Australian Telescope (AAT) and William Herschel Telescope and is described in detail by Bland-Hawthorn & Jones (1998). Frequency switching of the etalon can be synchronized with the movement of charge (charge shuffling) up or down the CCD columns. When combined with an arbitrary mask, the instrument can expose only part of the CCD, leaving the rest to act as a charge storage device. This provides many different observing configurations of narrowband imaging, applicable to studying a wide range of astrophysical problems.
An elegant way to obtain continuous, high-throughput, linear photometry in a narrow bandpass at arbitrary wavelength is to use the charge-shuffle mode of the TTF. Here we discuss an attempt at the AAT to determine if O I 8446 pulsations in V2116 Oph can be used to obtain high signal-to-noise radial velocity measurements and thus to elucidate the system parameters.
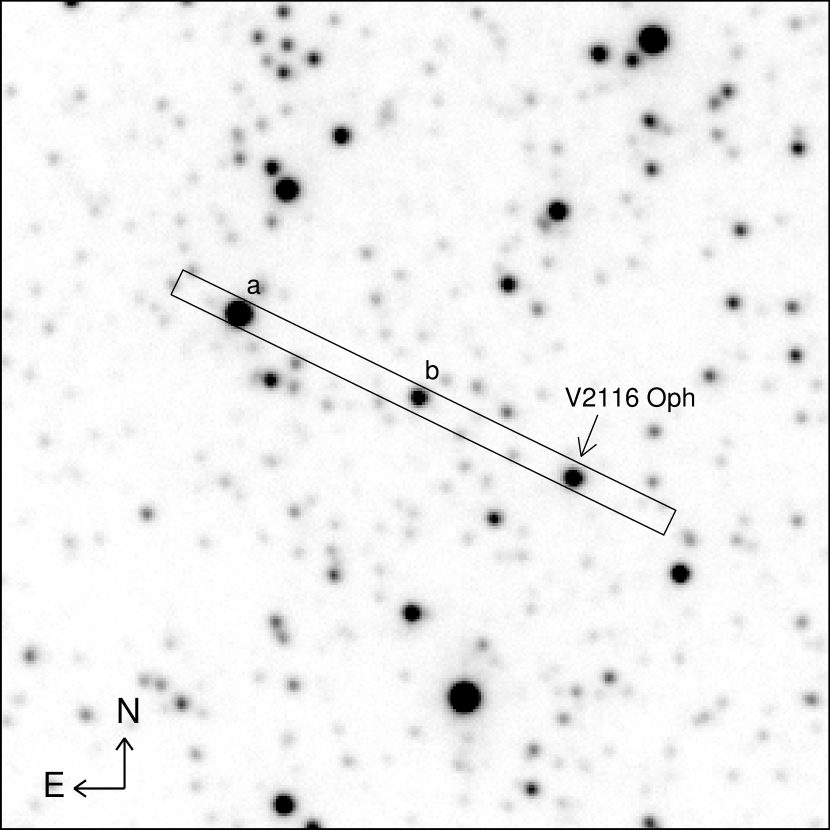
On 1997 July 10, we repeatedly imaged V2116 Oph using the TTF on the AAT through a slit, rotated to position angle 64∘ to include the X-ray star plus one brighter and one fainter nearby companion. Figure 2 shows a 33′ region near V2116 Oph and includes the outline of this slit superposed. To tune the TTF bandpass to the center of the emission line, we step the etalon in wavelength across the line. Figure 3 shows the result of the scan and demonstrates that the O I 8446 emission line is well-detected; we set the etalon to step 180 and a width of 7 Å. In this configuration, TTF yields 90% filter transmission, and we achieved 500 detected photons s-1 during cloudbreaks.
Each slit image is then exposed for 12 s before charge is shuffled 10 pixels (6′′) down the CCD. This is repeated 102 times before the chip becomes full and is read out, a quite efficient protocol as each shuffle consumes only 1 s, a delay time selected to avoid burning out the shutter. There is only about a 100 s delay between the start of a new series of exposures and the end of the previous series, as the CCD is read out and written to disk. The virtues of this technique over alternatives such as time-resolved dispersive spectroscopy include significantly higher throughput (important given the narrow wavelength band of interest in this faint object) and excellent photometric accuracy due to the lack of a narrow slit.
A new mode of the instrument, not available at the time of these observations, now allows the charge to be read out as it is shuffled down the chip, eliminating the need to read the entire chip at once and the time lost while doing so. In addition, the charge can be shifted quickly, eliminating the need to close and open the shutter between each exposure. The shuffle speed is about 50 s per row, and the read out speed is about 40 ms per row. These new modes now allow TTF to obtain a truly continuous time series dataset.
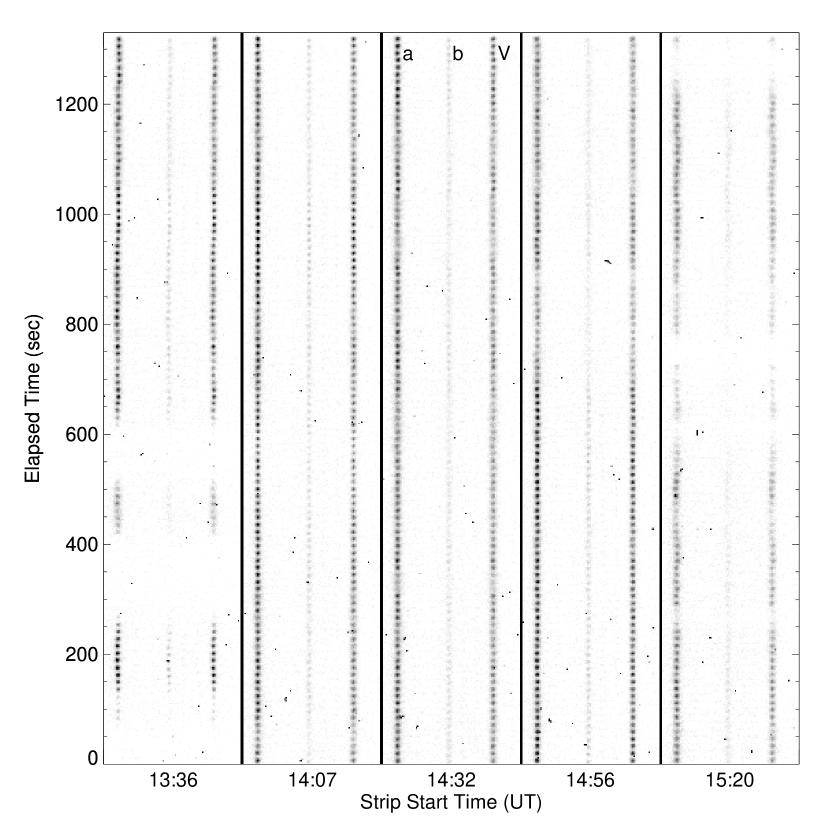
Figure 4 displays the five separate exposures (each totaling 20 min of integration) obtained on the partly-cloudy night of seeing. Within each strip, V2116 Oph is the bright object to the right; the brighter reference star (a) is the object on the left of each strip.
Each image is first inspected and manually cleaned of charged-particle hits, and then aperture photometry is used to measure a magnitude for the program and reference stars in each subframe. In this case aperture photometry performed better than profile fitting software, as poor seeing conditions caused the stellar profile to vary considerably between the short exposures. Due to the cloudy conditions, the direct measured magnitudes vary considerably, but differential photometry effectively removes this effect and allows us to achieve 2% relative photometry on V2116 Oph during times of average obscuration. From these measurements we derive a light curve which is nearly continuous over 2.1 hr. The standard deviation is consistent with that expected from count-rate uncertainties and shows no obvious periodic or aperiodic variation. The power spectrum of the best single series of exposures reveals no significant power down to a level of 3% (full-amplitude) at the s period of GX 1+4, as determined by Chakrabarty (1997) using BATSE data from the week of our TTF observations. This upper limit is determined by adding artificial sinusoidal oscillations (with proper counting and cloud obscuration uncertainties added) and measuring when the signal becomes significant in the power spectrum. When the light curves from all five frames are combined into a power spectrum and also averaged into 10 phase bins using the BATSE period, no significant oscillations are detected to a level of 1% (full-amplitude).
3 DISCUSSION
With a giant primary and any reasonable assumption for the mass of the secondary (presumably a neutron star), the system orbital period must be of order one year. Although we would very much like to understand even the basic parameters of this unusual system, simply extracting even the period will not be easy. Searches for periodic variations in the X-ray pulse timing residuals are foiled by large, irregular torque derivatives (Chakrabarty et al. 1997, Bildsten et al. 1997). Normal radial velocity spectroscopy of the optical lines will be difficult; the expected variations are very small compared at least to the very broad H emission. Searches for periodic variations in the H intensity (Greenhill et al. 1995) and H profile (e.g., Sood et al. 1995) have not revealed a significant orbital period component in the large variations, presumably due to accretion rate fluctuations.
In principle the detection of an optical analogue to the X-ray pulses could yield an accurate radial velocity solution. If the ionizing radiation is reprocessed to visible light at a location in the system fixed with respect to the barycenter, and the recombination times are short compared to the pulse period, the resulting optical pulses can be searched for periodic modulation due to orbital motion. If the reprocessing surface is physically larger than the light travel distance in one pulse cycle, phase mixing may dilute the pulse amplitude greatly, but working in the Fourier domain provides far more potential sensitivity than standard radial velocity spectroscopy. This technique has of course been applied decades ago, with great success, to the X-ray pulsar HZ Her/Her X-1 (Middleditch & Nelson 1976).
We have conducted a first search for pulsations of O I 8446 in GX 1+4, in the hope of establishing if measurement of the periodic modulation of this strong emission line may be used to obtain high signal-to-noise radial velocity measurements, and thus to determine the system parameters. Despite less than optimal observing conditions, we are able to rule out an enhancement of the pulsation amplitude in O I at the time of our observations; our combined data do not reveal any pulsation at the X-ray period, with a upper limit of 1% (full-amplitude). Krzeminski & Priedhorsky (1978) report similar limits to H periodic variations. Chakrabarty et al. (1998) report upper limits of 5% and 9% for pulsation in infrared He I and Pa , respectively, at the time of their observations. Broadband optical pulsations up to % have been observed, but only on certain occasions, and broadband pulsation upper limits of 0.1% have also been documented (Jablonski et al. 1997). Those authors have reported a correlation where these pulsations are stronger during brighter optical states. However, our data do not allow us to determine the absolute brightness of V2116 Oph during the observations.
The lack of pulsation enhancement in O I 8446 allows several possible interpretations. If the Ly photons responsible for pumping the O I are indeed created by reprocessed X-rays, the reprocessing region must be sufficiently large to completely dilute the pulse amplitude. A circumstellar nebula such as discussed by Chakrabarty & Roche (1997) is one such possibility. A second possible interpretation follows a suggestion of Chakrabarty & Roche (1997) based on other optical emission lines: the Ly photons are excited by the thermal emission of the accretion disk instead of reprocessed X rays.
Substantial further observations of this complex system are needed to unravel its nature. Optical pulsations in HZ Her are well-known to be detected only during a highly restricted subset of orbital and precessional phases in the system. Nonetheless, the unique utility of TTF in charge shuffle mode for narrow band time-series photometry of faint objects is clear.
References
- (1) Bildsten, L., et al., 1997, ApJS, 113, 367
- (2) Bland-Hawthorn, J., & Jones, H. 1998, PASA, in press (preprint astro-ph/9707315)
- (3) Chakrabarty, D. 1997, private communication
- (4) Chakrabarty, D., et al., 1997, ApJ, 481, L101
- (5) Chakrabarty, D., & Roche, P. 1997, ApJ, 489, 254
- (6) Chakrabarty, D., van Kerkwijk, M. H., & Larkin, J. E. 1998, ApJ, 497, L39
- (7) Davidsen, A., Malina, R., & Bowyer, S. 1977, ApJ, 211, 866
- (8) Glass, I. S., & Feast, M. W. 1973, Nature Phys. Sci., 245, 39
- (9) Grandi, S. 1975, ApJ, 196, 465
- (10) Grandi, S. 1976, ApJ, 206, 658
- (11) Greenhill, J. G., Watson, R. D., Tobin, W., Pritchard, J. D., & Clark, M. 1995, MNRAS, 274, L59
- (12) Jablonski, F. J., Pereira, M. G., Braga, J., & Gneiding, C. D. 1997, ApJ, 482, L171
- (13) Jablonski, F., & Pereira, M. G. 1997, MNRAS, 289, L17
- (14) Krzeminski, W., & Priedhorsky, W. C. 1978, PASP, 90, 434
- (15) Laurent, P. et al. 1993, A&A, 278, 444
- (16) Middleditch, J., & Nelson, J. E. 1976, ApJ, 208, 567
- (17) Rudy, R. J., Cohen, R. D., Rossano, G. S., & Puetter, R. C. 1990, ApJ, 362, 346
- (18) Sood, R. K., James, S. D., Lawson, W. A., Sharma, D. P., Grey, D. G., & Manchanda, R. K. 1995, Adv. Space Res., 16, 3, 131