UNSWIRF: A Tunable Imaging Spectrometer for the Near-Infrared
Abstract
We describe the specifications, characteristics, calibration, and analysis of data from the University of New South Wales Infrared Fabry-Perot (unswirf) etalon. unswirf is a near-infrared tunable imaging spectrometer, used primarily in conjunction with IRIS on the AAT, but suitable for use as a visitor instrument at other telescopes. The etalon delivers a resolving power in excess of 4000 (corresponding to a velocity resolution km ), and allows imaging of fields up to in diameter on the AAT at any wavelength between 1.5 and 2.4 m for which suitable blocking filters are available.
1 School of Physics, University of New South Wales, Sydney 2052, Australia.
sun, mcba, mgb, lea, jwvs@newt.phys.unsw.edu.au
2 Current address: Joint Astronomy Centre, 660 N. A’Ohoku Place,
Hilo HI 96720, U.S.A.
sryder@jach.hawaii.edu
Keywords: instrumentation: miscellaneous – methods: data analysis – infrared: ISM: lines
1 Introduction
The desire for high spectral resolution observations in the near-infrared has been met with three main types of instrument. The traditional way of mapping an object at high spectral resolution is to use a long-slit cooled grating spectrograph, and step the slit across the sky. Although this technique records data at every spectral point simultaneously, it is highly inefficient on extended objects if only a single wavelength (or a small number of wavelengths) are of interest. The Fourier Transform Spectrometer (FTS) works by Fourier transforming an interferogram produced by a two-beam interferometer, and can perform measurements over a large wavelength range (e.g., 0.9 – 5.5 m in the case of the CFHT FTS; Bohlender 1994). The FTS tends, however, to be mechanically large, complex, and expensive, and is also not very efficient for monochromatic applications. Furthermore, every pixel has the noise from the entire continuum in it, and this noise is correlated from pixel to pixel. The Fabry-Perot interferometer, by contrast, is small, has a high throughput (compared to a grating of comparable size and resolving power; Jacquinot 1954), and can deliver consistently high spectral resolution over a wide field, which is imaged directly with an infrared array.
Fabry-Perot etalons have been successfully employed for narrow-band imaging in the optical for many years (e.g., Atherton et al. 1982; Bland & Tully 1989; Jones & Bland-Hawthorn 1997). However, it is only the recent advent of low-noise, large-area detector arrays that has made their use as tunable narrow-band filters for the near-infrared particularly advantageous. There is clearly much to be gained by observing emission lines in the infrared; for example, aside from the reduction in extinction relative to the optical regime, many rotational and vibrational transitions of molecules (such as H2) also become accessible. Although many of the brighter Galactic sources can be imaged using filters with fixed, narrow (%) bandpasses, the use of a Fabry-Perot etalon with resolving power confers a number of advantages, including
-
•
the ability to resolve closely spaced lines, or resolve the line of interest from adjacent OH airglow or atmospheric absorption lines;
-
•
the ability to reveal velocity gradients, or even a complete velocity field, when Doppler motions exceed a few tens of km ;
-
•
the reduced sky background and continuum flux passed to the detector. The resultant increase in the line-to-continuum ratio improves the measurement stability, and allows the sky to be sampled less often.
In this paper, we describe one such system, named unswirf (University of New South Wales Infrared Fabry-Perot), which is intended to complement the existing near-infrared imaging and spectroscopic capabilities of IRIS111IRIS uses a HgCdTe array manufactured by Rockwell International Science Centre, CA. (Allen et al. 1993) at the Anglo-Australian Telescope (AAT), but which could also function as a visiting instrument at other facilities (e.g., MSSSO 2.3 m, UKIRT). In the next section, we give a brief overview of Fabry-Perot systems, and unswirf in particular. We then describe some of the novel approaches taken to calibrate unswirf and process the resultant data, and give illustrations of some of the early scientific results obtained with unswirf.
2 Overview of the Instrument
2.1 The Fabry-Perot Interferometer
Thorough discussions of the principles underlying the Fabry-Perot interferometer, and its use in astrophysics, can be found elsewhere (e.g., Vaughan 1989; Bland & Tully 1989), and only a few important definitions will be given here. In essence, the Fabry-Perot interferometer consists of a pair of identical transparent plates, having plane-parallel internal faces of reflectivity , separated by a uniform spacing . Peak transmission is attained over a series of orders when
| (1) |
where is the refractive index of the medium between the plates, and is the angle relative to the normal of the incident beam with wavelength . The spectral distance between two adjacent orders and is called the Free Spectral Range (FSR), and is given by
| (2) |
For a “perfect” Fabry-Perot etalon, the Full Width at Half-Maximum (FWHM) of each order is
| (3) |
Thus the resolving power can be described as
| (4) |
where is called the reflection finesse. In practice, the true “effective” finesse of a Fabry-Perot system is always less than the reflection finesse, due to surface defects in the coatings, departures from plate parallelism, and the use of a converging, rather than a parallel, incident beam. Replacing with in equation 4 then allows the resolving power to be estimated in the general case.
2.2 The unswirf etalon
Table 1 summarises the specifications of some currently available near-IR imaging Fabry-Perot systems. As can be seen, various combinations of resolving power, field of view, and tuning range are available. The unswirf etalon was specifically intended to meet the following goals:
-
1.
a high resolving power (); this was a trade-off between the amount of spectral scanning required at high resolution to fully sample the line, and the reduced line-to-continuum contrast and velocity information available at lower resolution;
-
2.
a choice of pixel scales (e.g., pixel-1 or pixel-1, depending on the imaging optics selected within IRIS) matched to the seeing conditions and the clear aperture of the etalon;
-
3.
the ability to cover lines in both the band (e.g., [Fe ii] at 1.6440 m) and in the band (e.g., H at 2.1218 m, H at 2.2477 m, and Br at 2.1655 m).
| Instrument | Telescope | Band | Resolving | Maximum | Sensitivityb | Referencec |
|---|---|---|---|---|---|---|
| Power | Field | |||||
| Cornell | Various | 3300 | 7 | 1 | ||
| FAST | Various | ; | 1000; 2700 | circle | 5 | 2 |
| FINAC | CRL 1.5 m | ; ; | 680; 1250; 12000 | 50 | 3 | |
| IRAC | ESO 2.2 m | 1400 | circle | 5 | 4 | |
| IRCAM3 | UKIRT | 860 | 4 | 5 | ||
| NASM/NRL | WIRO | ; | 800; 800 | 6 | ||
| UNSWIRF | AAT | 4000 | circle | 5 | 7 |
aCharacteristics of individual etalons used in each instrument are separated by semi-colons.
detection in 1000 s on-line integration in band, in units of ergs cm-2 s-1 arcsec-2, surmised from the given reference.
c1) Herbst et al. 1990; 2) Krabbe et al. 1993; 3) Sugai et al. 1994; 4) Lidman et al. 1997; 5) Geballe 1997; 6) Satyapal et al. 1995; 7) This paper.
At the heart of unswirf is a model ET-70WF etalon, manufactured by Queensgate Instruments (UK) Ltd., with a clear aperture diameter of 70 mm. The plates are made from water-free fused silica, with a matched surface quality of (for nm, before coating). A series of multilayer dielectric coatings gives the plates a reflectivity % all the way from 1.5 to m. The outer surface of each plate has a broad-band anti-reflection coating applied.
As with most modern Fabry-Perot etalons, the separation and parallelism of the plates is controlled to very high accuracy by piezoelectric actuators, and servo-stabilised with capacitance micrometers incorporated into the etalon itself. The Anglo-Australian Observatory’s Queensgate CS-100 servo-controller is capable of maintaining the etalon spacing and parallelism to better than . An IBM-compatible 286 PC rides in the Cassegrain cage, along with an auxiliary electronics rack for communication with both the CS-100 and an etalon translation slide. Commands from the AAO MicroVAX 4000 computer to change the etalon spacing as part of an observing sequence are relayed to the PC by one of the AAO Sun workstations, and thence to the CS-100 via a direct TTL logical level interface, with a typical response time shorter than 1 ms.
A special mounting box has been constructed to go between the Acquisition and Guide unit and IRIS at the Cassegrain focus of the AAT. One side of this box holds a slide, controlled by a stepper motor, which permits remote switching of the etalon in or out of the beam with a positional accuracy of 1 m. The other side of the mounting box holds the polarimetry modules for IRISPOL (Hough et al. 1994), making it possible for polarimetry to be performed in conjunction with the Fabry-Perot if desired. The etalon sits 140 mm above the focal plane of the AAT, in an beam. This results in a 5% reduction in the unvignetted field of view (compared to placement in the focal plane), but no significant reduction in the spectral resolution, owing to the small beam convergent angle (see also the discussion in Greenhouse et al. 1997).
Besides making access to the etalon easier, the main benefit of placing the etalon close to the focal plane (rather than close to the pupil plane) is that each pixel “sees” only a very small part (just 12 mm2) of the Fabry-Perot. Operation in this “pseudo-telecentric” mode also results in a smaller change in central wavelength across the field, as compared with operation in the pupil plane. Any variations in plate spacing (i.e., departures from flatness) translate into a variation in peak wavelength for that region, rather than an overall decrease in finesse. Any such variations in peak wavelength can be removed in the calibration process. The main drawbacks of placing unswirf outside the IRIS dewar are the increased susceptibility to dust and to changes in the ambient temperature and pressure, and a higher thermal background.
In direct-imaging mode, two optical configurations are available, depending on the choice of re-imaging lens selected within IRIS itself. The “wide” mode field of view is a circle in diameter, with pixels, though the pixel array size of IRIS limits the usable field to just under . In the “intermediate” mode, the pixel scale is pixel-1, and the full field is available. One limiting factor on the capabilities of unswirf is the availability of blocking filters within IRIS. The standard narrow-band filters are listed in Table 2. Since unswirf is designed to work in order , equation 2 shows that any of these filters having bandwidths are adequate for ensuring that only a single order is passed from the etalon to the detector. Provided neither the continuum nor the night-sky emission is too strong, the broader filters can still be used, though with a corresponding reduction in signal-to-noise relative to a narrower filter.
| Central | Bandwidth | Principal |
|---|---|---|
| Wavelength (m) | () | Line |
| 1.64 | 0.01 | [Fe ii] (Galactic) |
| 1.65 | 0.01 | [Fe ii] () |
| 1.74 | 0.01 | Br6 (n=10–4); H |
| 2.12 | 0.01 | H |
| 2.16 | 0.01 | Br (n=7–4) |
| 2.21 | 0.04 | Continuum |
| 2.25 | 0.01 | H |
| 2.34 | 0.04 | CO and bands |
Finally, it is also possible to insert the échelle grating and a slit in IRIS, and by scanning with unswirf, build up a much higher resolution spectrum of a source placed on the slit than would be possible with the échelle alone. Such a system could be used (with or without the telescope), for example, to investigate the detailed structure of the OH airglow emission spectrum.
3 Observing with unswirf
3.1 Wavelength Calibration
The first step in commissioning unswirf was to calibrate the relationship between etalon spacing and peak transmitted wavelength . This is complicated by a number of factors:
-
•
the actual order being passed by the blocking filter is not necessarily known in advance;
-
•
the relationship between etalon spacing , and the analog-to-digital units () employed by the control computer and CS-100 must first be calibrated;
-
•
because of the wide tuning range demanded, and the multiple layer coatings involved, the effective depth where reflection occurs within the etalon coatings will change with wavelength, and so too will the apparent physical spacing of the plates. This manifests itself as a change in with respect to an assumed value of the physical plate spacing (or equivalently, by a non-integral order number ). Let us define such that when the angle of incidence , and the interplate medium is air at 1 atmosphere pressure, equation 1 becomes
(5) and thus
(6) Thus, measurements of the FSR over the full range in wavelength and for multiple orders allows us to derive the order number and the wavelength variation of apparent plate separation .
We now outline a novel calibration procedure that deals with these issues, and replicates the actual observing configuration as closely as possible, without the need for external calibration in the laboratory.
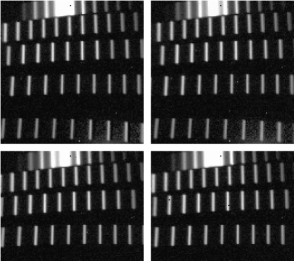
First, the etalon and all blocking filters are withdrawn from the light path, and IRIS configured with the narrow () slit and its band échelle grism. Images of the emission-line spectra produced by four separate lamps (Ar, Kr, Hg, and Xe) are then taken in order to wavelength-calibrate the four complete échelle orders (covering the range m after straightening) produced by this grism. Next, the Fabry-Perot is inserted into the beam, the plate spacing set to , and a continuum source (such as a quartz-iodine lamp) used to illuminate the system. Since there are no blocking filters in place, all orders passed by the etalon are imaged, resulting in the “picket-fence” appearance of Figure 1. Since wavelength as a function of position on the array is already known, the position of each peak, and their separations (i.e., ) can be determined. For improved accuracy, these measurements are repeated with etalon settings , which causes the etalon orders to shift position on the array, as illustrated in Figure 1.
As Figure 2 shows, the of unswirf is indeed more complex than equation 2 would suggest for a simple dielectric coating. From equations (1) and (2), it follows that for normal incidence in air
| (7) |
The upper dashed line in Figure 2 corresponds to for a constant physical etalon spacing of 52.0 m, while the lower dashed line is for m. For m, the effective spacing between the plates () is 52.0 m, but this grows rapidly at around 2 m due to the nature of the coatings, and is more like m out to the long wavelength cutoff of unswirf.

The same data, analysed using equation 5, indicate that the change in spacing resulting from one step in is
| (8) |
Having determined over the full wavelength range of unswirf, the accuracy of this calibration has been tested by comparing the predictions of equation 5 for the wavelengths of the arc-lines measured earlier with their known wavelengths. We find an r.m.s. accuracy of 0.04 nm, or % of the instrumental resolution.
3.2 Parallelism, Resolving Power, and Finesse
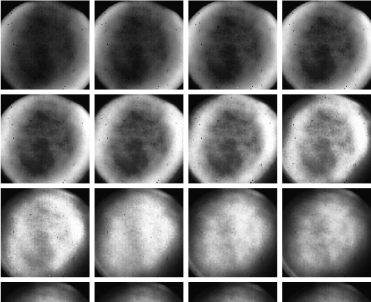
Having calibrated the relationship between , , and , it now becomes possible to set the etalon spacing for the peak transmission of any required wavelength. The next step is to make the plates as parallel as possible, and maintain this parallelism over the full wavelength range, given the residual non-flatness of the plates and/or their coatings. This can most easily be done by scanning in wavelength across an unresolved emission line (e.g., from a discharge lamp or from the OH airglow) and building up a “cube” of images, with the third axis representing etalon spacing . For each spatial pixel in the cube, the spectrum of intensity is analysed with the unswfit routine (Section 3.4) to determine the position and intensity of the emission peak. Owing to the dependence on of the condition for peak transmission (equation 1), should be a maximum near the centre of the array, and decrease towards the edges, as shown in Figure 3. From analysing such images, we find that the etalon surfaces are flat to at a wavelength of 1.65 m, well within the specification.
The way we have chosen to monitor the parallelism is to fit a tangent plane to this surface, and then use the measured - and -slopes to correct the parallelism settings passed to the etalon from the CS-100. The parallelism has been found to be weakly, but repeatably, dependent on (and thus on , due to the fact that the effective reflection at different wavelengths comes from different depths within the coatings, and the coating thicknesses vary slightly), and this is now accounted for by the observing control software. After optimising the parallelism, we have calculated the resolving power and effective finesse (equation 4) of unswirf using a series of discharge lamp lines over the available wavelength range, as tabulated in Table 3. The high reflectivity of the plates will make the dominant contributor to . In addition, the throughput of the etalon at each wavelength (except for 2.334 m) has been measured by comparing the peak intensities obtained with the etalon in and then out of the beam.
| Line | Throughput | ||||
|---|---|---|---|---|---|
| Wavelength (m)a | (nm) | (%) | |||
| Ar 1.6437 | 64 | 0.378 | 4348 | 68 | 53 |
| Ar 1.6520 | 65 | 0.354 | 4666 | 72 | 62 |
| Kr 2.1165 | 51 | 0.386 | 5483 | 107 | 56 |
| Kr 2.1903 | 47 | 0.437 | 5011 | 107 | 70 |
| Ar 2.2077 | 50 | 0.470 | 4697 | 94 | 43 |
| Kr 2.2486 | 48 | 0.409 | 5497 | 115 | 43 |
| Ar 2.3133 | 47 | 0.560 | 4130 | 88 | 15 |
| Kr 2.3340 | 46 | 0.515 | 4532 | 99 |
aLine wavelengths in air.
The shift in peak transmitted wavelength for the Kr 2.1165 m line, going from the centre to the edge of the etalon, is quite small compared with the instrumental resolution. As can be seen from Figure 4, the shift is over the inner 90 pixel diameter, and still over the entire usable field of view. In fact, owing to possible non-uniform illumination of the etalon by the discharge lamp, Figure 4 may slightly overestimate this shift. Thus, unswirf is virtually monochromatic, and can in principle be used as a pure tunable line imaging filter, provided velocity gradients and dispersions are small ( km ), and the line centre wavelength is known in advance. Otherwise, more extensive scanning in wavelength will be necessary (but this of course furnishes, as a spinoff, the velocity field). Although the ability of unswirf to resolve lines is limited by its instrumental profile width ( km , depending on parallelism), we have found that the profile fitting allows us to measure shifts in the position of the line peak equivalent to velocity changes of km , depending on signal-to-noise of the data, profile shape, and plate parallelism.

3.3 Observing strategies
Observing with unswirf is much like normal narrow-band imaging in the near-infrared. As recommended by the IRIS manual (Allen 1993), readout method 4 is employed, which breaks up each exposure into a series of Non-Destructive Readouts (NDRs), enabling on-the-fly bias correction and linearisation, and yielding the lowest possible read-noise (typically e-). To guarantee background-limited performance, each exposure at a given etalon setting is normally 120 s in duration at (180 s at ), broken up into 12 NDRs. In order to reduce overheads, a complete scan in on the object is normally done before moving the telescope to an offset sky position away, and repeating the sequence. Except when the scan crosses a strong, and rapidly varying, OH airglow line (usually more of a problem in -band than -band), sky subtraction is found to be quite adequate, even when sky frames are taken minutes after the matching object frame.
An existing procedure for commanding telescope spatial offsets, written in the AAO drama environment (Bailey et al. 1995), has been enhanced with the ability to request etalon spacing and parallelism changes from the CS-100. To guard against possible drifts in the unswirf etalon parallelism (usually in response to changes in the ambient temperature and/or humidity), the parallelism is normally checked immediately prior to each night of observing, by scanning a calibration lamp line close to the region of interest.
Because of the monochromatic nature of the infrared radiation reaching the IRIS array from unswirf, it is essential that matching sky exposures and dome flatfields be obtained for all of the etalon settings used on an object, as otherwise severe fringing can result. Similarly, bright spectroscopic standard stars need to be observed once, and preferably twice at these same settings. Although accuracy of the photometry is usually limited by the sky and the array to % at best, it is necessary to determine the intensity scaling of the continuum images relative to the line peak in order to ensure proper continuum subtraction.
3.4 Data Analysis
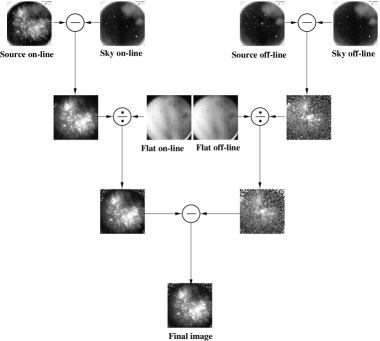
A schematic of the basic data reduction procedure for unswirf is shown in Figure 5, and begins with subtraction of a matching sky frame, followed by division by a normalised matching dome flat. Monochromatic imaging of simple sources then requires just a scaling and subtraction of the off-line frame. For more complex sources, a “cube” is constructed from a sequence of such monochromatic images at a constant interval, aligned to a common spatial frame defined by field stars. The moments of this cube (integrated line intensity , position of the line peak , and the line width ) are extracted by fitting a Lorentzian to the spectrum at each spatial pixel. In general, the line profile is usually too noisy to allow three free parameters (the base level having already been set to by the off-line subtraction). Since in most cases the emission-line profile will be unresolved by unswirf, the line width can be assumed to be the same as the instrumental profile width, as mapped by the calibration lamp line scans, leaving only two free parameters in the fitting. Finally, all pixels in the vignetted corner regions of the moment maps, as well as any pixels which fall below a specified intensity threshold, or for which the fitted lies outside the actual range scanned (assuming that the observations did adequately span the line of interest) are blanked out.
In order to streamline the processing of unswirf data, a suite of programs has been written using the IRAF222IRAF is distributed by the National Optical Astronomy Observatories, which are operated by the Association of Universities for Research in Astronomy, Inc., under cooperative agreement with the National Science Foundation. environment. A listing of these programs and their functions is given in Table 4. With the exception of unswfit, these programs are scripts written in the IRAF Command Language (CL) which execute a series of existing IRAF routines. The unswfit task is a purpose-written SPP (Subset Pre-Processor) program that uses a Lorentzian-fitting algorithm supplied by F. Valdes.
| Task name | Purpose |
|---|---|
| unswblank | Execute unswfit, then blank incongruous pixels in output maps. |
| unswcal | Convert intensity from (e-) s-1 to ergs cm-2 s-1 pixel-1. |
| unswcube | Sky-subtract, flatfield, rotate, clean, align, continuum-subtract |
| and stack a series of consecutive images into a datacube. | |
| unswdisp | Display a “movie” of the datacube planes. |
| unswfit | Fit Lorentzian profiles to each datacube pixel, output maps of intensity, |
| wavelength shift, and profile width. | |
| unswflats | Produce and label flatfields. |
| unswlin | Convert data from ADUs to electrons. |
| unswmask | Mask a map using the same blanking as another map. |
| unswmerge | Sort and stack a series of processed images into a datacube, averaging |
| repeat data where available. | |
| unswphot | Carry out aperture photometry on a sequence of standard star images. |
| unswproc | Sky-subtract, flatfield, rotate, and clean a series of consecutive images. |
| unswslope | Execute unswfit, fit tangent plane to wavelength shift map, and compute |
| parallelism corrections. | |
| unswspec | Plot a spectrum of intensity vs , averaged over a range in and . |
| unswvel | Correct wavelength shift map for instrumental shift, convert from to km . |
4 Results
unswirf is a highly versatile facility, as illustrated by some of the first science results achieved. Since being commissioned in 1996 February, it has been awarded a total of 35 nights in its first 3 semesters on the AAT. Among the projects currently underway (or planned) are:
-
•
Imaging and line-ratio mapping of supernova remnants, planetary nebulae, H ii regions, photodissociation regions (PDRs), and Herbig-Haro objects.
-
•
Photometry and dynamics of starburst and Seyfert galaxy nuclei.
-
•
Studies of extinction in star formation regions.
-
•
The search for redshifted UV/optical emission from primeval galaxies.
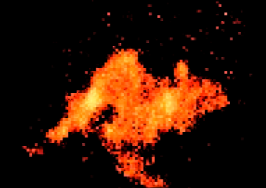
Figure 6 was produced from some of the earliest data obtained with unswirf, and shows the emission from molecular hydrogen at 2.12 m from a photodissociation region not far from the “Keyhole” Nebula in Carina. Not surprisingly, this region has earned the (unofficial) designation of the “Kangaroo” Nebula. This image was produced using unswirf in its Line Imaging Filter mode, by subtracting a continuum image from a single image taken very near the line peak.
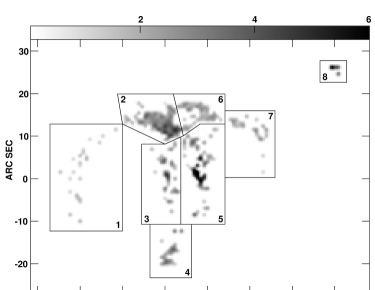
unswirf is already helping to shed some light on the excitation mechanism for H2 in PDRs. Figure 7 is a map of the H / H intensity ratio in the reflection nebula Parsamyan 18, obtained from scans of the 2.12 and 2.25 m lines with unswirf (Ryder et al. 1998). Values of the ratio over most of P 18 are indicative of UV-pumped fluorescence, while values approaching 7 or more in the areas marked “5” and “8” are consistent with an increased gas density and/or a contribution from shocks. The simultaneous velocity information provided by unswirf has allowed us to show that Region “8” is almost certainly excited by an outflow source close to P 18, rather than being radiatively excited like the other regions. Similar studies are also being carried out on the “elephant trunks” of M16 (Allen et al. 1998a), as well as the “fingers” emerging from the core of OMC-1 (Figure 8; Burton & Stone 1998).

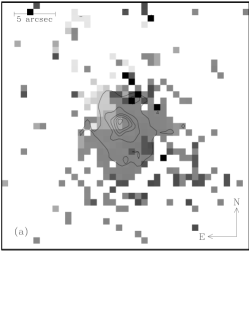
One avenue of research to which unswirf is particularly well-suited is the excitation and dynamics of planetary nebulae, both young and evolved. Figure 9 compares the morphology of ionised and warm molecular gas in NGC 3132 (Allen et al. 1998b). A similar study of the H2 emission in very low excitation (and therefore young) planetary nebulae is also being conducted to complement an H Snapshot survey with WFPC-2 on board the HST (Sahai & Trauger 1996).
Another area of research where unswirf is beginning to make inroads is in the excitation and dynamics of active galactic nuclei and starburst galaxies, normally heavily obscured by dust. Figure 10 shows the inner velocity field, derived from unswirf scans of the H2 2.12 m line, in the Circinus galaxy, which is the closest known Type 2 Seyfert galaxy. This has enabled the first direct measure of the rotational velocity gradient near the nucleus of the Circinus galaxy, and allows us to put an upper limit on the mass of the central black hole of M⊙ (Davies et al. 1998).
5 Conclusions
We have successfully developed and commissioned the University of New South Wales Infrared Fabry-Perot (unswirf) on IRIS at the AAT. Among the notable characteristics of this system, which is based on a Queensgate ET-70WF etalon, are its high Resolving Power (), wide field (up to ), and ability to be tuned across almost the entire and bands. A novel method of in-situ wavelength calibration has been applied, and a new suite of reduction and analysis software in the iraf environment has been developed. Early results across a wide variety of sources have been presented, and a number of diverse projects are now underway. Further details are available from the unswirf WWW page.
Acknowledgements
S.D.R. acknowledges the receipt of a UNSW Vice-Chancellor’s Postdoctoral Research Fellowship. unswirf was funded by a grant from the Australian Research Council. We are grateful to the Australian Time Allocation Committee and the Director of the AAO for their generous allocations of commissioning and observing time with unswirf, and to Stuart Lumsden and Tony Farrell for assistance with the observing software. Chris Pietraszewski of Queensgate Instruments deserves special thanks for his patient and enthusiastic support. Antonio Chrysostomou, Thomas Geballe, and Colin Aspin provided useful comments on an earlier version of this paper.
References
Allen, D. A. 1993, IRIS Users Guide (AAO User Manual 30a)
Allen, D. A., Barton, J. R., Burton, M. G., Davies, H., Farrell, T., Gillingham, P., Lankshear, A., Lindner, P., Mayfield, D., Meadows, V., Schafer, G., Shortridge, K., Spyromilio, J., Straede, J., Waller, L., & Whittard, D. 1993, PASA, 10, 298
Allen, L. E., Burton, M. G., Ryder, S. D., Ashley, M. C. B., & Storey, J. W. V. 1998a, MNRAS, submitted
Allen, L. E., Ashley, M. C. B., Ryder, S. D., Storey, J. W. V., Sun, Y.-S., & Burton, M. G. 1998b, in IAU Symposium 180: Planetary Nebulae (Dordrecht: Kluwer), in press
Atherton, P. D., Taylor, K., Pike, C. D., Harmer, C. F. W., Parker, N. M., & Hook, R. N. 1982, MNRAS, 201, 661
Bailey, J. A., Farrell, T. J., & Shortridge, K. 1995, Proc. SPIE, 2479, 62
Bland, J., & Tully, R. B. 1989, AJ, 98, 723
Bohlender, D. A. 1994, Users’ Manual for the CFHT Fourier Transform Spectrometer (Canada-France-Hawaii Telescope technical document)
Burton, M. G., & Stone, J. M. 1998, ASP Conf. Ser., in press
Davies, R. I., Forbes, D. A., Ryder, S. D., Ashley, M. C. B., Burton, M. G., Storey, J. W. V., Allen, L. E., Ward, M. J., & Norris, R. P. 1998, MNRAS, 293, 189
Geballe, T. R. 1997, The 350 km Fabry-Perot Etalon for the Band (Joint Astronomy Centre technical document)
Greenhouse, M. A., Satyapal, S., Woodward, C. E., Fischer, J., Thompson, K. L., Forrest, W. J., Pipher, J. L., Raines, N., Smith, H. A., Watson, D. M., & Rudy, R. J. 1997, ApJ, 476, 105
Herbst, T. M., Graham, J. R., Beckwith, S., Tsutsui, K., Soifer, B. T., & Matthews, K. 1990, AJ, 99, 1773
Hough, J. H., Chrysostomou, A., & Bailey, J. A. 1994, ExA, 3, 127
Jacquinot, P. 1954, J. Opt. Soc. Amer., 44, 761
Jones, H., & Bland-Hawthorn, J. 1997, PASA, 14, 8
Krabbe, A., Rotaciuc, V., Storey, J. W. V., Cameron, M., Blietz, M., Drapatz, S., Hofmann, R., Sämann, G., & Genzel, R. 1993, PASP, 105, 1472
Lidman, C., Gredel, R., & Moneti, A. 1997, IRAC2b User Manual V1.5 (European Southern Observatory technical document)
Ryder, S. D., Allen, L. E., Burton, M. G., Ashley, M. C. B., & Storey, J. W. V. 1998, MNRAS, 294, 338
Sahai, R., & Trauger, J. 1996, BAAS, 28, 1402
Satyapal, S., Watson, D. M., Pipher, J. L., Forrest, W. J., Coppenbarger, D., Raines, S. N., Libonate, S., Piche, F., Greenhouse, M. A., Smith, H. A., Thompson, K. L., Fischer, J., Woodward, C. E., & Hodge, T. 1995, ApJ, 448, 611
Sugai, H., Usuda, T., Kataza, H., Tanaka, M., Kawabata, H., Inoue, M. Y., Takami, H., Aoki, T., & Hiromoto, N. 1994, ApJ, 427, 511
Vaughan, J. M. 1989, The Fabry-Perot Interferometer (Philadelphia: Adam Hilger)
Wall, L., Christiansen, T., & Schwartz, R. L. 1996, Programming Perl, Second Edition (Sebastopol: O’Reilly & Associates)