Microlensing Halo Models with Abundant Brown Dwarfs
Abstract
All previous attempts to understand the microlensing results towards the Large Magellanic Cloud (LMC) have assumed homogeneous present day mass functions (PDMFs) for the lensing populations. Here, we present an investigation into the microlensing characteristics of haloes with spatially varying PDMFs and anisotropic velocity dispersion tensors. One attractive possibility – suggested by baryonic dark cluster formation in pregalactic and protogalactic cooling flows – is that the inner halo is dominated by stellar mass objects, whereas low mass brown dwarfs become more prevalent on moving outwards. The contribution to the microlensing rate must be dominated by dark remnants () to recover the observed timescales of the microlensing experiments. But, even though stellar remnants control the rate, they do not dominate the mass of the baryonic halo, and so the well-known enrichment and mass budget problems are much less severe. Using a simple ansatz for the spatial variation of the PDMF, models are constructed in which the contribution of brown dwarfs to the mass of the baryonic halo is and to the total halo is . An unusual property of the models is that they predict that the average timescale of events towards M31 is shorter than the average timescale towards the LMC. This is because the longer line of sight towards M31 probes more of the far halo where brown dwarfs are the most common constituent.
1 INTRODUCTION
Recent results from gravitational microlensing experiments indicate that at least part of the dynamically-dominant dark Galactic halo has now been detected (e.g., Evans 1997). Analyses of the first few years of data from the MACHO and EROS experiments (Aubourg et al. (1993); Alcock et al. (1997)) seemingly show that a substantial fraction of the halo comprises compact objects which induce microlensing variations on timescales 111In this Letter, timescale refers to the Einstein diameter crossing time of between 30 and 130 days. However, the nature of the lenses remains mysterious. Statistical analyses, which assume an isothermal halo distribution function populated by objects with a universal mass function, typically yield lens masses between and and halo fractions between and , implying a large population of low-mass stars or stellar remnants (Alcock et al. (1997)). Such inferences contrast sharply with other observational and theoretical evidence. In particular, star-count studies undertaken with the Hubble Space Telescope (HST) place stringent limits on the numbers of low-mass stars and on the age and spatial density of stellar remnants (Bahcall et al. (1994); Graff & Freese (1996); Santiago, Gilmore & Elson (1996)). Again, the abundance of metals in the interstellar medium limits the contribution of dark remnants to below that suggested by the microlensing analyses (Gibson & Mould (1997); Fields, Mathews & Schramm (1997)). However, this apparent inconsistency between microlensing on the one hand and deep star-count and metallicity data on the other may be an artifact of the underlying assumptions in the adopted models.
In this Letter, we introduce halo models in which key microlensing parameters – namely the lens mass, Galactocentric distance and transverse velocity – are correlated. How might such correlations arise? Some of the more promising “cooling-flow” theories for the formation of baryonic dark clusters (e.g., Ashman (1990); Carr (1994); De Paolis et al. (1995)) predict a spatial gradient in the present day mass function (PDMF). Here, the inner halo comprises partly visible stars, which are associated with the spheroid globular cluster population, whilst the outer halo comprises mostly low-mass stars and brown dwarfs. Let us remark that there is evidence for similar such spatial gradients in the Galactic disc (Taylor (1998)). Correlations between the lens velocity and Galactocentric distance are also possible if the velocity distribution is anisotropic (c.f., Markovic & Sommer-Larsen 1997). There is strong theoretical motivation for halo brown dwarfs, both from formation arguments (e.g., Ashman 1990, Tegmark et al. 1997) and from constraints on other candidates (e.g., Carr 1994). But, powerful arguments using the virial theorem (Gyuk, Evans & Gates 1998) have shown that the timescales of the microlensing events preclude the lenses being brown dwarfs. If the PDMF is the same everywhere, then this also prevents them making a substantial contribution to the halo.
The aim of this Letter is to show that the microlensing data-set is consistent with a baryonic component dominated by brown dwarfs. The crucial point is that, if the PDMF varies with position, the microlensing rate may be dominated by one mass scale, but the mass density may be dominated by another one entirely.
2 CORRELATED HALO MODELS
This section introduces the haloes under scrutiny. They are spherically symmetric models which take into consideration the effects of both varying anisotropy and varying PDMF. Our starting point is the rich families of simple power-law densities in power-law potentials developed by Evans, Häfner & de Zeeuw (1997). The density and rotation curve are
| (1) |
Here, we shall choose and so that the model is self-consistent and the rotation curve is asymptotically flat, with . The velocity dispersions are oriented on a spherical polar coordinate system and have values
| (2) |
When , the velocity dispersion tensor is isotropic. When , the model is composed of radial orbits, while corresponds to the circular orbit model. The distribution of velocities is approximated as a triaxial Gaussian with these semi-axes.
Let us first consider a halo which is everywhere characterised by a power-law PDMF, , between lower and upper mass scales and . In this case, the mass density and so is dominated by if . By contrast, the microlensing rate , where is the Einstein radius. This is dominated by if . Given the assumption that the PDMF is spatially homogeneous, it follows that if brown dwarfs dominate , they necessarily dominate . A typical brown dwarf of mass has an Einstein diameter crossing time days in isothermal models. The average crossing time of the six-event subsample of Alcock et al. (1997) is days. The absence of events with days shows that brown dwarfs certainly do not dominate the rate and hence the mass density. If, however, the PDMF is spatially varying, then the above argument no longer holds, as neither nor scale simply with anymore.
Suppose we assume that, at a given Galactocentric radius , the PDMF is characterised by the simplest of distributions, the delta function:
| (3) |
Motivated by the pregalactic and protogalactic cooling-flow theories of baryonic dark cluster formation, we take the mass scale to be a monotonically decreasing function of varying like
| (4) |
between the Galactic Center and the halo cutoff radius . Although cooling-flow theories do not specify precisely how the PDMF varies, the above formula represents one of the simplest and most convenient ways to parameterise the scenario. In choosing the mass scales and , we assume that the inner halo is populated mostly by stellar remnants (i.e., , which is the mass scale at which the stellar main-sequence lifetime equals the age of the Galaxy). Of course, such mass scales are implicated by current microlensing results towards the Large Magellanic Cloud (LMC). The progenitors of these remnants must have been considerably more massive than . The outer halo is taken to comprise almost exclusively brown dwarfs . Since eqn (4) implies a smooth transition between the two mass régimes in the inner and outer halo, there must also be an intermediate population comprising a mixture of hydrogen-burning stars and low-mass stellar remnants (which have resulted from progenitors with masses only a little larger than ). Since we have not specified the form of the initial mass function, there is some degree of freedom in this scenario as regards the ratio of remnants to hydrogen-burning objects in this intermediate regime. Nonetheless, we will need to consider number-count constraints in some detail in Section 3.
To determine the consequences for the microlensing observables, let us examine the set of six models given in Table 1 and see how they fare in comparison with the six-event sub-sample of the two-year LMC dataset provided by Alcock et al. (1997). Model A in Table 1 acts as a reference, having an isotropic velocity distribution and a homogeneous PDMF with . It corresponds closely to the best-fit ‘standard’ model of Alcock et al. (1997). Models B and C characterise velocity anisotropy and a radially varying PDMF respectively, whilst Model D combines both attributes. All of the models A–D assume a halo cutoff radius of 100 kpc, whilst Models E and F incorporate varying PDMFs within smaller and larger haloes. For each model, the overall normalisation is fixed in the following way (Kerins 1998). First, the optical depth contributed solely by the observed events is
| (5) |
where is the effective exposure ( star years). This is now used to set the overall normalisation by insisting
| (6) |
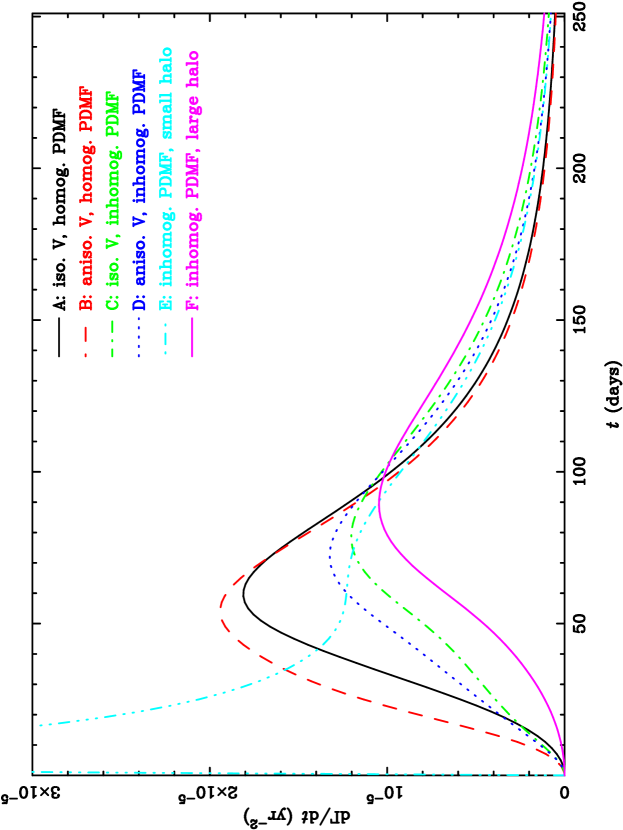
where is the detection efficiency of the experiment. Figure 1 shows the resulting underlying timescale distributions for the six halo models A–F. These distributions are what would be recovered in the limit of perfect detection efficiency. Their relative normalisation however is fixed by the observations (via eqns 5 and 6) and thus does take into account the experimental efficiency.
It is apparent from Figure 1 that the shape of the timescale distributions is controlled much more by the PDMF and the halo size than by the velocity distribution. For example, curves A and B are very similar, as are curves C and D. These pairs differ only in the velocity anisotropy. By contrast, changes in the PDMF can have a dramatic effect on the shape of the timescale distribution. For example, curve C shows an excess of both long and short timescale events compared to the reference model A. The extent of the halo also has a pronounced effect on the shape of the timescale distribution. Large haloes, such as model F, show a strong excess towards longer timescales. This is because most of the low-mass objects now lie beyond the LMC and so do not contribute at all to the lensing statistics. In contrast, the small halo model E peaks sharply at days, with only a modest excess of long-timescale events relative to reference model A. This is despite the fact that it has a somewhat larger upper mass cutoff than for any of the other varying PDMF models. Models C and D, which correspond to haloes of intermediate size, show some evidence of a secondary peak at short timescales ( days). In these two models, the lens mass drops below at kpc, and below at kpc – still somewhat inside the LMC distance. However, microlensing is relatively insensitive to lenses beyond radii of kpc and so their effect on the overall timescale distribution is slight.
For each of the models, the microlensing observables are reported in Table 2. The first column gives the number of events that would have been expected in the two-year LMC data-set. The second column reports the number of events with crossing times less than 20 days. Alcock et al. (1997) found no events with such short crossing times, implying a upper limit of 1.1 events on the underlying distribution. Comparison with the observed quantities in the last row of Table 2 indicates that all but model E reproduce the observed number of events within the uncertainties. Model E is marginally excluded at the level by the upper limit on the number of events with days. Column 3 gives the mean Einstein crossing time, after accounting for detection efficiencies. All models with the exception of model F lie within the errors. Column 4 gives the total optical depth . This is slightly different for each of the models, because it is only the observed optical depth that is fixed by the normalisation. The remaining two columns give the baryonic mass fraction and the brown dwarf mass fraction . These have been computed assuming a local halo density of (c.f. Carr (1994); Gates, Gyuk & Turner (1995)). The most important conclusion to be drawn from the Table is that strongly inhomogeneous mass functions can give substantial boosts to the mass fraction of brown dwarfs. For example in model C, which is comfortably within the error limits for all the microlensing observables, brown dwarfs provide of the mass of the baryonic halo. The contribution of brown dwarfs to the overall halo mass is also significant (.
3 TESTS AND PREDICTIONS
This is a provocative model and it is susceptible to observational checks and constraints. An obvious concern is whether it violates the limits on hydrogen-burning stars. Flynn, Gould & Bahcall (1996) have used the Hubble Deep Field (, hereafter HDF) – the deepest optical field ever obtained – to set constraints on the baryonic fraction of the halo. These constraints amount to an upper limit of about on the halo fraction in hydrogen burning objects if they are unclustered. In the scenario which motivates the present work, the stars are predicted to be clustered, which therefore modifies the number count constraints somewhat (c.f., Kerins 1997). Some of the stars have masses well above the hydrogen-burning limit, but are confined spatially to shells whose radius depends on the mass of the star through eqn (4). As well as constraints from ‘pencil beam’ fields such as HDF, it is also important to verify that the models are consistent with the microlensing experiments themselves, which do not observe a significant stellar population in front of the LMC. To this end, we shall compute expected cluster number counts for both the HDF band and MACHO band by employing the photometric predictions of Table 4 of D’Antona & Mazzitelli (1996). These apply to stellar populations of age 10 Gyr and metallicity . The and band predictions are well fit by the following fourth-order polynomial least-squares fits:
| (7) | |||||
These fits are valid between , corresponding to . Since we are only interested in the halo models with varying PDMFs, we confine our attention to models C, E and F (of course, the predictions for model D are identical to those of model C).
Taking the HDF field of view as 4.4 arcmin2, using the HDF point source magnitude limits as calculated by Flynn, Gould & Bahcall (1996), and assuming that all cluster stars can be resolved, we find that the expected cluster number counts for models (C,E,F) are , where is the cluster mass. Thus, for clusters between , all models are comfortably within the Poisson confidence upper limit of 3 clusters based on no detections. In the case of MACHO, assuming a field of view of 11 deg2 and a limiting -band magnitude of 21, we obtain . This is again within the upper limit for a null detection, though model E requires . Haloes with a cut-off radius smaller than 50 kpc produce too many clusters within the MACHO field of view. The HDF is mostly sensitive to the numerous low-mass stars further out in the halo and does not sample the nearer, more massive stars as well. As a result, it does not seriously constrain any of the models. For models C and F, the MACHO sensitivity is insufficient to detect any hydrogen burning stars, the nearest of which lie about 16 kpc away for model C and 24 kpc away for model F. Locally, the halo density is dominated by stellar remnants for the spatially varying PDMF models, so one may imagine constraints from white-dwarf number counts (c.f. Graff, Laughlin & Freese (1998)). However, if clustered, the nearest remnants are several kpc from us, and so too faint to detect.
There are some obvious tests of this scenario. First, the timescale distributions are broader in models with strong inhomogeneities in the mass function. This is evident from Figure 1, where models C to F have timescale distributions with long tails and consequently larger second moments than the models with weak or no inhomogeneities. This test may be difficult to perform until a much larger number of events are recorded. A better prospect may be to combine information along differing lines of sight. A distinguishing characteristic of the models dominated by brown dwarfs in the outer parts concerns the ratio of the average Einstein diameter crossing time towards the LMC, SMC and M31. The ratios for our reference model A are (LMC:SMC:M31), whereas in model C they are . This effect does not hold for model E because it requires to be larger than the distance to the LMC and SMC. It holds for models C, D and F because in these models there are many brown dwarfs which are only probed by the longer lines of sight to M31. It is very hard to see how this effect can be produced in any other way, so this is a definitive test for such models.
Are there any possible tests of this scenario as applied to external galaxies? Sackett et al. (1994) discovered a faint, luminous halo surrounding the spiral galaxy NGC 5907 and suggested that it might be composed of faint M dwarfs or possibly brown dwarfs. Now, brown dwarfs are brightest at mid-infrared wavelengths. This led Gilmore & Unavane (1998) to examine 4 edge-on spiral galaxies with the Infrared Space Observatory (ISO) camera. They concluded that low mass stars or young brown dwarfs do not make a significant contribution to the dark haloes of at least two of the galaxies (NGC 2915 and UGC 1459), though brown dwarfs older than 1 Gyr remain viable. As Gilmore & Unavane (1998) point out, once the origin of noise in the ISO data is better understood, these conclusions may become stronger. The next generation of space-based infrared observatories will provide stringent checks on the contribution of baryonic dark clusters to the haloes of external galaxies. This remains a very promising way to confirm or confute this theory.
4 CONCLUSIONS
The assumption of a uniform present day mass function (PDMF) throughout the Galactic halo has been made in all previous studies of the microlensing dataset. Of course, it is natural enough to make the simplest assumption, but there is no evidence to suggest that it is correct. The main thrust of this Letter is to point out that the impasse of the microlensing results can be overcome by discarding this unwarranted assumption.
Although our own PDMF is not likely to be correct in detail, its general form does receive physical support from baryonic dark cluster formation theories (e.g., Ashman (1990); Carr (1994); De Paolis et al. (1995)). These suggest that there may be a gradation of masses of baryonic objects in the halo, with larger mass objects in the inner regions and abundant brown dwarfs in the far halo. Such models can reproduce the microlensing observables within the uncertainties. Such models can be made consistent with Hubble Space Telescope limits on faints stars. The important point is that in models with spatially varying mass functions, brown dwarfs need not dominate the microlensing rate but they can still dominate the mass of the baryonic halo. In such models, the lenses are predominantly dark stellar remnants, but these now comprise a much smaller fraction of the halo. So, this evades the embarrassing mass budget and the chemical enrichment problems that occur when the halo has a uniform PDMF (Gibson & Mould (1997); Fields, Mathews & Schramm (1997)).
References
- Alcock et al. (1997) Alcock C., et al. 1997, ApJ, 486, 697
- Ashman (1990) Ashman K., 1990, MNRAS, 247, 662
- Aubourg et al. (1993) Aubourg E., et al. 1993, Nature, 365, 623
- Bahcall et al. (1994) Bahcall J., Flynn C., Gould A., Kirhakos S., 1994, ApJ, 435, L51
- Carr (1994) Carr B.J., 1994, ARAA, 32, 531
- D’Antona & Mazzitelli (1996) D’Antona F., & Mazzitelli I., 1996, ApJ, 456, 329
- De Paolis et al. (1995) De Paolis F., Ingrosso G., Jetzer P. & Roncadelli M., 1995, A&A, 295, 567
- Evans (1997) Evans N.W., 1997, in Dark Matter in Astro and Particle Physics, ed. H.V. Klapdor-Kleingrothaus, Y. Ramachers (World Scientific, Singapore), p. 173
- Evans, Häfner & de Zeeuw (1997) Evans N.W., Häfner R., de Zeeuw P.T., 1997, MNRAS, 286, 315
- Fields, Mathews & Schramm (1997) Fields B., Mathews G.J., Schramm D.N., 1997, ApJ, 483, 625
- Flynn, Gould & Bahcall (1996) Flynn C., Gould A., Bahcall J.N., 1996, ApJ, 466, L55
- Gates, Gyuk & Turner (1995) Gates E.I., Gyuk G., Turner M.S., 1995, ApJ, 449, L123
- Gibson & Mould (1997) Gibson B., Mould J. 1997, ApJ, 482, 98.
- Gilmore & Unavane (1998) Gilmore G., Unavane M., 1998, MNRAS, submitted
- Graff & Freese (1996) Graff D., Freese K., 1996, ApJ, 456, L49
- Graff, Laughlin & Freese (1998) Graff D., Laughlin G., Freese K., 1998, in press
- Gyuk et al. (1998) Gyuk G., Evans N.W., Gates E.I, 1998, ApJL, submitted
- Kerins (1997) Kerins E., 1997, A&A, 322, 709
- Kerins (1998) Kerins E., 1998, ApJ, submitted
- Marković & Sommer-Larsen (1997) Marković D., Sommer-Larsen J. 1997, MNRAS, 288, 733
- Santiago, Gilmore & Elson (1996) Santiago B., Gilmore G., Elson R.A.W., 1996, MNRAS, 281, 871
- Sackett et al. (1994) Sackett P.D, Morrison H.L., Harding P., & Boroson T.A., 1994, Nature, 370, 441
- Taylor (1998) Taylor J., 1998, preprint (astro-ph 9802215)
- Tegmark et al. (1997) Tegmark M., Silk J., Rees M.J., Blanchard A., Abel T. & Palla F., 1997, ApJ, 474, 1
| Model | /kpc | Description | |||
|---|---|---|---|---|---|
| A | 0 | 0.5 | 0.5 | 100 | Reference model: homog. PDMF |
| B | -0.5 | 0.5 | 0.5 | 100 | Homog. PDMF, anisotropic vel. |
| C | 0 | 3 | 100 | Varying PDMF, isotropic vel. | |
| D | -0.5 | 3 | 100 | Varying PDMF, anisotropic vel. | |
| E | 0 | 10 | 50 | Varying PDMF, small halo | |
| F | 0 | 2 | 200 | Varying PDMF, large halo |
| Model | d) | /d | ||||
|---|---|---|---|---|---|---|
| A | 5.5 | 0.06 | 87 | 2.23 | 0.48 | 0 |
| B | 5.9 | 0.14 | 81 | 2.29 | 0.49 | 0 |
| C | 4.6 | 0.06 | 104 | 2.40 | 0.52 | 0.29 |
| D | 4.9 | 0.07 | 98 | 2.42 | 0.52 | 0.29 |
| E | 6.3 | 1.16 | 76 | 2.42 | 0.52 | 0.25 |
| F | 4.1 | 0.01 | 118 | 2.53 | 0.54 | 0.32 |
| Obsd | aaUsing blend-corrected timescales | |||||