The magnetic variability of the star HD14437
Abstract
The magnetic field of the CP star HD14437 was discovered by Glagolevskij et al. (1985) using the 6-m telescope of the Special Astrophysical Observatory. No polarity changes have been found during 2 years of observations. A very long (3–4 years) period of rotation was proposed to explain the measurements. To check this hypothesis, we made a new series of magnetic field observations for this star 10 years later with the 6-m telescope. The polarity of the longitudinal magnetic field is still negative and has not shown any change during more than 10 years of observations. We found the most probable periods to be several days. It means that we have observed a star where the magnetic and rotation axes are inclined at a small angle, and the negative pole is not far from the line of sight.
Key words: Stars: chemically peculiar – Magnetic fields – Zeeman effect
1 Observations and data reduction
HD14437 is a poorly studied peculiar A–star with a magnitude of , effective temperature (Glagolevskij, 1995). Observations of the 1980s with the 6-m telescope showed a variability of the longitudinal magnetic field with an amplitude of about 2 kG and a constant negative sign. The description of the observations and data reductions are presented by Glagolevskij et al. (1985) in more details.
In this paper we present new observations of HD14437 which were carried out in 1996–97 using the CCD detector (Chuntonov & Glagolevskij, 1997). We have observed the spectra of the star on the 6-m telescope with a spectral resolution . The context NICE (Knyazev & Shergin, 1995) in the MIDAS system was used. The new and old observational data are presented in Table1 (JD2444655–2445900: with photographic plates, JD2449555 and JD2449556: with the hydrogen lines magnetometer, from JD2450000 on: with the CCD detector).
We have carried out the line identification using the Vienna Astrophysical Line Data–Base (VALD) (Piskunov et al., 1995) and Moore’s tables (Moore, 1945). In view of determining the individual Landé factor of each spectral line used in our measurements, we have identified the lines in the following spectral ranges: 5955–6385 and 4460–4680. Si and Cr are observed to be overabundant. We have found an underabundance of O by the lack of the lines OI6155.97, 6556.78 and 6158.18 which are usually strong at spectral class A2.
We have determined the effective magnetic field using Babcock’s standard formula with the individual Landé factor for each line. The measurements are given in Table1.
| JD 2400000 | ,G | JD 2400000 | ,G |
| 44655.208 | 50415.240 | ||
| 44656.308 | 50415.269 | ||
| 44659.188 | 50499.196 | ||
| 44660.196 | 50499.221 | ||
| 44860.541 | 50500.161 | ||
| 45303.354 | 50500.188 | ||
| 45303.362 | 50617.507 | ||
| 45476.541 | 50643.521 | ||
| 45900.493 | 50705.451 | ||
| 49555.472 | * | 50706.410 | |
| 49556.420 | * | 50707.412 | |
| 50413.523 | 50709.602 | ||
| 50414.125 | 50710.432 | ||
| 50415.217 | |||
| * — observations with the magnetometer | |||
The effective magnetic field has preserved its sign for about ten years. The suggestion about the long period of the star contradicts our data, because we have observed the longitudinal component of the magnetic field to undergo significant changes within a few days only. So, we can draw the conclusion that the axis of rotation, the magnetic axis and the line of sight are inclined at small angles.
2 The period determination
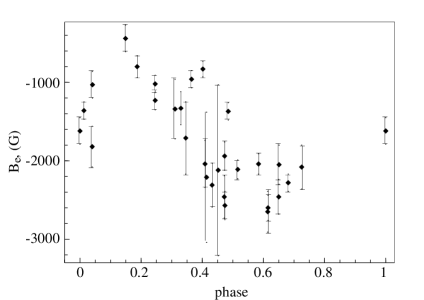
Having the observational data of the effective magnetic field , we tried to find the rotational period of HD 14437. It has been determined by Yurkevich’s method in the interval of 0–100 days. We have found three groups of probable periods: 13, 16 and 30 days. The best fitted variability curve of was derived for the period of .
Independently, a search for the period has been performed by Mathys et al. (1997) on the basis of the surface field . They have found three groups of probable periods: 15, 30 and 350 days. Later, Wade (1997) proposed another period, close to , which he has calculated using 100 points of Hipparcos photometry. The variability curve of the effective magnetic field for looks somewhat worse than for because of greater dispersion, nethertheless it remains quite acceptable. Besides, determination of the period by photometry, with a much larger number of homogeneous points, undoubtedly gives a more reliable result. The phase diagram for is presented in Figure1.
Acknowledgements. We would like to thank V.G.Elkin for his help in observations and discussions of the results, and G.Wade for the information about the 26 days period of Hipparcos photometry. This work was partly supported by a RFBR grant 97–02–16247.
References
- 1 Chuntonov, G.A., Glagolevskij, Yu.V.: 1997, inStellar magnetic fields,
- 2 Astrofiz.Issled.(Izv.SAO)19
- 3 Bull.of Spec.Astrophys.Obs.38
- 4 SAO Technical report239
- 5 Astron. Astrophys.123
- 6 A multiplet table of astrophysical interest
- 7 Astron. Astrophys., Suppl. Ser.112
- 8