Multi-element Doppler imaging of Psc
Abstract
Psc (HD 220825) is a typical Chromium Ap star that happens to have optimal parameters for Doppler imaging (DI). Its short rotational period of less then 2 days, rotational velocity of 40 km/s, and a moderate inclination of the rotational axis put modest requirements on spectroscopic observations. Anomalies of iron peak elements are clearly present, but small enough to cause significant deviations from model atmospheres with scaled solar abundances. We applied DI to Psc once before, determining the distribution of Cr (Ryabchikova et al. [1996], hereafter PaperI). However, due to strong blending of Fe, the image was based on two short (2 Å) spectral intervals, dominated by Cr lines. Since the first paper we obtained additional spectra and developed a new code that allows to perform multi-element DI and thus to use larger spectral interval(s). We demonstrate the abilities of the new code and present new maps of Cr and Fe. A much larger time base allowed us to improve the rotational period of Psc as well.
Key words: Stars: chemically peculiar – Stars: Doppler imaging – Stars: individual: Psc
1 Introduction
Doppler imaging of stars (see e.g. Piskunov & Rice 1993) has become a standard technique for studying the distribution of chemical elements on the surface of Ap stars. Up to now DI was limited to a single chemical element. In a few attempts to image several elements, maps were obtained sequentially, each time assuming that all elements but one are distributed homogeneously. Recent improvements in computer performance and more efficient algorithms for solving radiative transfer allowed us to replace pre-computed tables of local line profiles with “on the fly” calculations of the emerging spectrum. The new code INVERS11, based on this approach, is not limited by the size of interpolation tables and can handle simultaneous imaging of multiple elements. In addition, we are able to use blends of different chemical elements for DI, which was not possible with the old codes.
We applied the new code to the SrCr star Psc, classified A0p. The selected spectral region around 5300 Å is dominated by lines of neutral and ionized Cr and Fe lines, which give additional constraints for the effective temperature. The rotational velocity is km s-1 resulting in significant line blending.
2 Observations and data reduction
Our observational data include 25 high-resolution CCD spectra (, SNR) and consist of two sets. The first set was obtained with the Coudé spectrometer of the 2-m telescope of the Rozhen Astronomical Observatory (Bulgaria) in July and August 1993, and the second was observed with the Coudé spectrometer of the 2.6-m telescope of the Crimean Astrophysical Observatory in August and September 1997. Our observations cover the spectral region 5285–5345 Å, which is rich in Cr i and ii and Fe i and ii lines.
The Rozhen spectra were processed with the pcIPS software package (Smirnov & Piskunov [1994]), while the reduction of the CrAO spectra was done with the help of the SPE reduction package of S. Sergeev (CrAO). Both packages include all standard procedures. The continuum fitting was done with pcIPS for all spectra. Finally, small corrections to the the continuum level were applied using the synthetic spectrum of the star, which is particularly important for obtaining accurate line profiles in the spectrum of a star with substantial rotation.
2.1 New period
None of the rotational periods discussed in the literature, namely 1.420 (Kreidl & Schneider [1989]), 1.412 (Kerschbaum & Maitzen [1991]), and 1.418 days (Ryabchikova et al. [1996]) fitted our spectroscopic variations properly; spectra corresponding to close phases did not look similar. We therefore performed a new period search using the equivalent widths of Cr ii lines in our spectra. This was done using the method by Cuypers ([1986]), implemented by Pelt ([1992]). The best fit to all equivalent width variations was achieved with the period days. The phases computed using this new period substantially improved the reproduction of the line shapes in close phases. Note that the change in the period does not influence the results of PaperI because it was based on data obtained in 14 consecutive nights.
3 Line identification
The initial line-list for the observed wavelength range was extracted from the Vienna Atomic Line Database (Piskunov et al. [1995]). This line-list was then fine-tuned with the SME tool (Valenti & Piskunov [1996]) by comparing the synthetic spectrum to reference spectra of the Sun and Sirius (A1V), taken from the NSO Solar Atlas (Kurucz et al. [1984]), and for Sirius from the ING archive at RGO. Using SME, we first tuned the oscillator strengths of the most important lines of neutral atoms to match the NSO Solar Atlas. Most of the ions have been tuned using observations for Sirius, although the spectral resolution and SNR are inferior to the NSO Solar Atlas data. The resulting data consist of 25 spectra. We averaged the observations in close phases, further increasing the SNR, and performed DI using 11 rotational phase.
3.1 Multi-element Doppler imaging
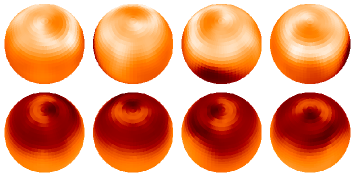
We restricted the DI to the promising 5307–5320 Å region. In other regions our line-list seems to be incomplete and/or contain misidentified lines. In this region the new INVERS11 code was able to reproduce the spectra well and to construct maps of Cr and Fe using a subset of 18 spectral lines. The following parameters of Psc resulted in the best fit: km s-1, , K, , km s-1. A preliminary abundance map is shown in Figure1.
We intend to publish finalised line-lists, the comparison between the synthetic and observed spectra, and the data analysis in the near future (Piskunov et al. [1998]).
References
- 1986 Cuypers J.: 1986, Astron. Astrophys., 167, 282
- 1991 Kerschbaum, F., Maitzen, H.M.: 1991, Astron. Astrophys., 246, 346
- 1989 Kreidl, T.J. & Schneider, H.: 1989, IBVS, 3282, 1
- 1984 Kurucz, R.L., Furenlid, I., Brault, J., Testerman, L.: 1984, National Solar Observatory Atlas No. 1: Solar Flux Atlas from 296 to 1300 nm
- 1992 Pelt, J.: 1992, ”Irregularly Spaced Data Analysis”, User manual, Helsinki.
- 1998 Piskunov, N.E. et al.: 1998, Astron. Astrophys., in preparation
- 1995 Piskunov, N.E., Kupka, F., Ryabchikova, T.A, et al.: 1995, Astron. Astrophys., Suppl. Ser., 112, 525
- 1993 Piskunov, N.E., Rice, J.B.: 1993, Publ. Astron. Soc. Pac., 105, 1415
- 1996 Ryabchikova, T.A., Pavlova, V.M., Davydova, E.S. and Piskunov, N.E.: 1996, Pis’ma Astron. Zh., 22, 917-923
- 1994 Smirnov, O.M., Piskunov, N.E.: 1994, in Astronomical Data Analysis Software and Systems III, eds: D.R. Crabtree, R.J. Hanisch, J. Barnes, A.S.P. Conference Series, Vol. 61, p. 245
- 1996 Valenti, J.A., Piskunov, N.: 1996, Astron. Astrophys., Suppl. Ser., 118, 595