Cosmic Complementarity: and from Combining
CMB Experiments and Redshift Surveys
Abstract
We show that upcoming CMB satellite experiments and large redshift surveys can be used together to yield 5% determinations of and , an order of magnitude improvement over CMB data alone. CMB anisotropies provide the sound horizon at recombination as a standard ruler. For reasonable baryon fractions, this scale is imprinted on the galaxy power spectrum as a series of spectral features. Measuring these features in redshift space determines the Hubble constant, which in turn yields once combined with CMB data. Since the oscillations in both power spectra are frozen in at recombination, this test is insensitive to low-redshift cosmology.
Subject headings:
cosmology: theory – dark matter – large-scale structure of the universe – cosmic microwave background1. Introduction
In the usual cosmological paradigm, the cosmic microwave background (CMB) contains a vast amount of information about cosmological parameters (Hu et al. 1997). With upcoming experiments, most notably the two satellite missions MAP111http://map.gsfc.nasa.gov and Planck222http://astro.estec.esa.nl/SA-general/Projects/Planck, detailed measurements of the angular power spectra of its anisotropy and polarization may accurately determine many cosmological parameters (Jungman et al. 1996; Bond et al. 1997; Zaldarriaga et al. 1997). However, certain changes in the cosmological parameters can conspire to leave the CMB power spectra unchanged, resulting in degenerate directions in the parameter space (Bond et al. 1994, 1997; Zaldarriaga et al. 1997; Huey et al. 1998). For example, since the Hubble constant and the matter density can be varied while keeping the angular diameter distance and the matter-radiation ratio fixed, their values remain uncertain but highly correlated. Such degeneracies must be broken with cosmological information from other sources.
Upcoming redshift surveys for the study of large-scale structure hold the potential for resolving this issue. In particular, the 2dF survey333http://meteor.anu.edu.au/colless/2dF and the Sloan Digital Sky Survey (SDSS)444http://www.astro.princeton.edu/BBOOK should measure the galaxy power spectrum on large enough scales to allow detailed comparisons to the mass power spectra predicted by cosmological theories. In this Letter and a companion paper (Eisenstein, Hu, & Tegmark 1998, hereafter EHT ), we explore the potential of combining redshift surveys and CMB anisotropy data for the purpose of parameter estimation. Here, we focus on the dramatic improvement possible in the measurement of and . Neither data set yields tight limits by itself, yet together they could yield errors better than 5% on and 10% on .
The key to this improvement is the presence of features in the matter power spectrum on scales exceeding . With a non-negligible baryon fraction, the acoustic oscillations that exist before recombination are imprinted not only on CMB anisotropies but also on the linear power spectrum (Holtzman 1989, Hu & Sugiyama 1996, Eisenstein & Hu 1998a). CMB anisotropies accurately calibrate their characteristic length scale; measurement of this standard ruler in the redshift survey power spectrum yields . With this added information, the CMB returns a significantly more precise measure of .
2. Methodology
We seek to quantify the potential sensitivity of these data sets to various cosmological parameters. For this, we use the Fisher matrix formalism (see Tegmark et al. 1997 for a review), which yields a lower limit on the statistical errors on cosmological parameters achievable by a set of experiments. This formalism operates within the context of a parameterized cosmological model. For this we use a 12-variable parameterization of the adiabatic CDM model, described in detail in EHT . It includes cold dark matter, baryons, massive neutrinos, a cosmological constant , curvature (), the Hubble constant , a reionization optical depth, and a primordial helium fraction. It assumes an initial scalar power spectrum () with tilt , a logarithmic running of the tilt , and an unknown amplitude as well as scale-invariant tensor contributions with an unconstrained amplitude. Finally, it allows an unknown linear bias to adjust the galaxy power spectrum relative to the mass (). All of the above parameters are determined simultaneously from the data.
For CMB anisotropies, we use the experimental specifications of the MAP and Planck satellites for temperature and polarization (EHT ). We assume that foregrounds and systematics can be eliminated with negligible loss of cosmological information. For large-scale structure, we use the projected specifications of the Bright Red Galaxy (BRG) sample of the SDSS to determine its sensitivity to the linear power spectrum (Tegmark 1997). On small scales, the observed power spectrum reflects non-linear effects and galaxy formation issues. We therefore employ only wavenumbers less than under the assumption that the linear power spectrum on these scales can be reconstructed (up to the unknown linear bias) from the observed quasi-linear information with no adjustment to the error bars. We vary in § 4.2.
3. CMB Results
Parameter degeneracies occur when changes in the model parameters leave the power spectra essentially unchanged relative to the size of the experimental uncertainties. In particular, since cosmic variance is substantial at large angular scales, changes that affect large angles while leaving the acoustic peaks unchanged will be difficult to detect.
The angular diameter distance to the last scattering surface contains the most important degeneracy for the present discussion. The CMB acoustic peaks are a high-redshift pattern viewed at distance . The pattern may be held fixed by keeping and the baryon density constant. However, depends on the low-redshift effects of a cosmological constant or curvature. Changing and so as to keep the angular diameter distance constant leaves the acoustic peaks unchanged. Only large-angle () gravitational redshift effects or small-angle () gravitational lensing effects can resolve this ambiguity.
In short, the CMB data sets will yield precision information on the physical properties at high redshift, notably , and , but not on and individually. A similar situation occurs in quintessence models with trade-offs between and the equation of state of the -field (Huey et al. 1998).
In Table 1, we present the error bars on and attainable by upcoming CMB satellite experiments within our 12-dimensional parameter space. One sees that when varying both and , the constraints on and are poor, although polarization information does provide considerable help. Even if one assumes a flat cosmological model (), MAP with its partial coverage of the acoustic peaks will not yield tiny errors on and .
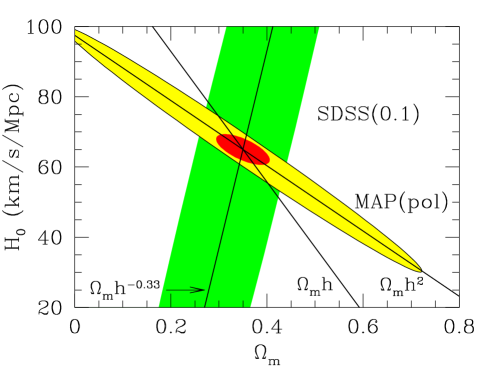
There are several caveats. The Fisher matrix expansion of the likelihood function is not accurate for large steps in parameter space, meaning that large error bars accurately detect a degenerate direction but may inaccurately reflect its magnitude (Zaldarriaga et al. 1997). One artifact of this is that the ellipses in Figure 1 follow straight lines rather than curves, e.g. constant in the CMB case. Moreover, the limits are slightly overestimated in the case of Planck because we have not included gravitational lensing (Seljak 1996; Metcalf & Silk 1997), by which the differences in growth factor between otherwise degenerate models will alter the small angle power spectra. Nevertheless, the point remains that the CMB alone will not constrain and to a level capable of strong consistency checks against other cosmological tests.
Errors on and for CDM Experiment General Flat General Flat MAP (no Pol.) 135 15 1.4 0.23 with SDSS 3.0 2.5 0.042 0.037 MAP (with Pol.) 23 6.7 0.25 0.10 with SDSS 2.9 2.4 0.037 0.036 Planck (no Pol.) 113 5.3 1.2 0.079 with SDSS 2.5 2.3 0.035 0.035 Planck (with Pol.) 13 1.6 0.14 0.024 with SDSS 2.2 1.4 0.027 0.020
NOTES.—The fiducial model has , km s-1 Mpc-1, and . We use for SDSS. Errors are 1-; errors are in units of . General: estimated from data. Flat: by fiat.
4. Results with Redshift Surveys
4.1. Linear Analysis
When we include the Fisher information matrix from SDSS, the error bars on and drop by an order of magnitude. In Table 1, we see that for a fiducial CDM model, the errors on are below while those on are around 0.035. EHT discuss improvements on other parameters of the model; however, none are nearly as dramatic. Figure 1 displays the situation. Note that the results are roughly independent of whether polarization information is available or not.
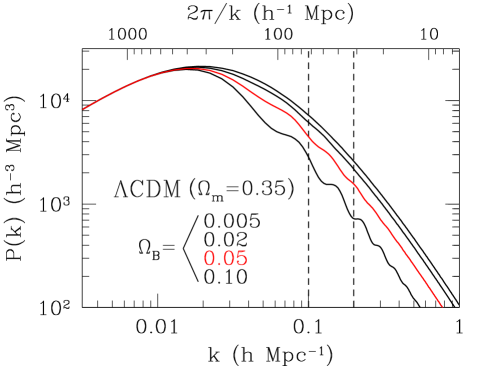
The reason for this dramatic improvement lies with the baryons. Table 2 shows the error bars on for a sequence of fiducial models with increasing baryon fraction; those on behave similarly. Increasing the baryon fraction from % to % results in a dramatic increase in the information provided by SDSS. A baryon fraction exceeding is strongly indicated by cluster gas fractions (White et al. 1993; David et al. 1995; White & Fabian 1995; Evrard 1997).
Errors on as Function of MAP (w/ Pol) with SDSS 0.005 1.4% 36 12 0.02 5.7% 29 9.2 0.05 14% 23 2.9 0.10 29% 24 1.3
NOTES.—Same parameters as Tab. 1 save for the baryon fraction.
As the baryon fraction increases, significant acoustic oscillations develop in the matter power spectrum (see Fig. 2 and Hu & Sugiyama 1996, Eisenstein & Hu 1998a). There is a characteristic scale of these oscillations known as the sound horizon; morphologically, the power spectrum acquires a sharp break near the sound horizon and a series of oscillations marking harmonics of this scale. The size of the sound horizon can be calculated given knowledge of the physical conditions at high redshift, particularly and . Since these are exactly the quantities that are well-constrained by the relative heights of the CMB acoustic peaks, we can accurately infer the scale of these features in real space. Its measurement in the redshift-space power spectrum then yields an accurate measure of .
At low baryon fractions, the SDSS power spectrum still reduces the error bars on and . This results from the one scale left in the matter power spectrum, that of the horizon at matter-radiation equality. In redshift space, this yields a measure of , with considerable inaccuracies due to confusion with scalar tilt. However, the fact that the SDSS ellipse in Figure 1 lies along a line very different than constant indicates that at moderate baryon fractions this feature is not providing the primary leverage on . Note that the break-and-oscillation morphology of the baryonic features cannot be mimicked by the effects of tilt or massive neutrinos.
In short, baryonic features yield a standard ruler, whose length can be accurately inferred by the CMB and be measured in redshift space using large redshift surveys. The comparison of lengths yields ; combining this with gives . This inference is independent of the angular diameter distance to last scattering (provided that the peaks are visible at all!), so this method will function regardless of cosmological constant, spatial curvature, or more exotic smooth components (e.g., Turner & White 1997). With known, the location of the CMB peaks and information from supernovae Ia (Perlmutter et al. 1998; Riess et al. 1998) may be focused on distinguishing these low-redshift effects (Tegmark et al. 1998b; Hu et al. 1998b).
4.2. Non-Linearities
Baryonic oscillations are a feature of the linear power spectrum. Non-linear evolution erases these signatures, even at second order in perturbation theory (e.g., Jain & Bertschinger 1994). Hence we should test the extent to which the above results depend upon our use of linear theory.
Heretofore, we have assumed that we could use the linear power spectrum on scales longward of . This is close to the point at which non-linearities will smooth the oscillations. We therefore display in Table 3 the effect of altering , again simply ignoring information on all smaller scales. For several fiducial models, we find that moving from to decreases the errors on and by about a factor of 2.5. However, these gains saturate as one extends to ; the acoustic oscillations there are of such small amplitude that little information is gained.
We also consider an alternative formulation in which we model the matter power spectrum by a fitting formula (Eisenstein & Hu 1998b) that includes the break at the sound horizon but not the oscillations. The resulting errors are shown in Table 3. For , the performance is significantly worse than that achieved with the actual linear power spectrum. This is close to the location of the first bump in this fiducial model. Note that including the featureless power spectrum on scales from to adds very little additional information on or .
Errors on for Differing SDSS Assumptions MAP alone 23 23 0.25 0.25 0.025 16 15 0.17 0.16 0.05 9.7 10.7 0.098 0.11 0.1 2.9 10.0 0.037 0.11 0.2 1.2 9.0 0.016 0.10 0.4 0.9 8.6 0.014 0.10
NOTES.—MAP with polarization has been taken in each case. Limits with the actual linear power spectrum are compared with those from a smoother analytic form (see text). Same model and notation as Tab. 1.
We therefore conclude that detection of at least the first of the acoustic oscillations ( in this model) is critical to enabling a precision measure of and . Detecting additional peaks improves the possible error bars but with diminishing returns because the oscillations damp down in amplitude. Cosmological simulations normalized to the cluster abundance suggests that the first peak will indeed be unaffected but that higher peaks will be smeared out (Meiksin et al. 1998).
5. Discussion
Detection of acoustic oscillations in the matter power spectrum would be a triumph for cosmology, as it would confirm the standard thermal history and the gravitational instability paradigm. Moreover, because the matter power spectrum displays these oscillations in a different manner than does the CMB, we would gain new leverage on cosmological parameters. In particular, we have shown in this Letter that the combination of power spectrum measurements from a galaxy redshift survey with anisotropy measurements from CMB satellite experiments could yield a precision measurement of and .
The potential measurement of and depends critically on the ability of the redshift survey to detect the baryonic features in the linear power spectrum. The best possible error bars are a strong function of the baryon fraction but are surprisingly good even if the fraction is %, roughly the minimum implied by cluster observations. For such cases, the fractional limits achievable with the SDSS are 5% for and 10% for if only the first acoustic peak in is detected. Detecting the smaller-scale peaks could allow an additional factor of 3 refinement; the exact limits would depend upon the scale at which non-linear effects smooth out the power spectrum. The results depend only mildly on the details of the CMB experiment: we find only slight gains as our presumed CMB data set improves from MAP without polarization to Planck with polarization. While we have quoted numbers for SDSS, it is possible that the 2dF survey will be able to make significant progress on the detection of features in the power spectrum on very large scales. Unfortunately, the hints of excess power on scales are not likely to be due to baryons (Eisenstein et al. 1998).
We have treated the galaxy power spectrum assuming linear bias on large scales. There is some theoretical motivation for this (Scherrer & Weinberg 1998); moreover, if bias tends towards unity as structure grows (Fry 1996; Tegmark & Peebles 1998), then scale dependences in the bias at the time of formation will be suppressed. Most importantly, this method of measuring and depends upon extracting an oscillatory feature from the power spectrum. While one cannot prove that scale-dependent bias should be monotonic on the largest scales, this seems more likely than an oscillation! Finally, the assumption of linearity can be tested by constructing the power spectrum with different types of galaxies (e.g., Peacock 1997); future redshift surveys will allow this to be done on very large scales with good statistics.
The method proposed here yields independent of local distance measurements and without the complications inherent in dynamical methods. In that, it is free of many confusing astrophysical problems. On the other hand, it does depend upon restricting oneself to a class of models with observable acoustic oscillations in both CMB anisotropies and the galaxy power spectrum. This assumption will be definitively tested from the data itself.
If the method described in this Letter can yield tight constraints on and , it will then be very important to compare these to other measurements of these quantities. In the coming decade, there will be a number of paths toward a precision measure of , such as the local distance ladder (e.g., Freedman et al. 1998), gravitational lensing (e.g., Blandford & Kundic 1996), and the S-Z effect (e.g., Cooray et al. 1998). Similarly, good estimates of may be possible from velocity fields (e.g., Dekel 1997), cluster evolution (Carlberg et al. 1997a; Bahcall et al. 1997), and measurements (e.g., Carlberg et al. 1997b). If the results from these diverse sets of measurements are found to agree, we will have a secure foundation upon which to base our cosmology.
Acknowledgements: Numerical power spectra were generated with CMBFAST (Seljak & Zaldarriaga 1996). We thank Martin White for useful discussions. D.J.E. is supported by a Frank and Peggy Taplin Membership; D.J.E. and W.H. by NSF-9513835; W.H. by the Keck Foundation and a Sloan Fellowship; M.T. by NASA through grant NAG5-6034 and Hubble Fellowship HF-01084.01-96A from STScI, operated by AURA, Inc. under NASA contract NAS4-26555.
References
- (1) Bahcall, N.A., Fan, X., & Cen, R. 1997, ApJ, 485, L53
- (2) Blandford, R.D., & Kundic, T. 1996, in The Extragalactic Distance Scale, eds. M. Livio, M. Donahue, & N. Panagia (Cambridge Univ. Press: Cambridge) [astro-ph/9611229]
- (3) Bond, J.R., Crittenden, R., Davis, R.L., Efstathiou, G., & Steinhardt, P.J. 1994, Phys. Rev. Lett., 72, 13
- (4) Bond, J.R., Efstathiou, G., & Tegmark, M. 1997, MNRAS, 291, L33
- (5) Carlberg, R.G., Morris, S.L., Yee, H.K.C., & Ellingson, E. 1997a, ApJ, 479, L19
- (6) Carlberg, R.G., Yee, H.K.C., & Ellingson, E. 1997b, ApJ, 478, 462
- (7) Cooray, A.R., Carlstrom, J.E., Joy, M., Grego, L, Holzapfel, W., & Patel, S.K. 1998 [astro-ph/9804149]
- (8) David, L.P., Jones, C., & Forman, W. 1995, ApJ, 445, 578
- (9) Dekel, A. 1997, in Galaxy Scaling Relations, eds. L. da Costa & A. Renzini (Springer: Berlin), p. 245 [astro-ph/9705033]
- (10) Eisenstein, D.J., & Hu, W. 1998a, ApJ, 496, 605
- (11) Eisenstein, D.J., & Hu, W. 1998b, ApJ, submitted
- (12) Eisenstein, D.J., Hu, W., Silk, J., & Szalay, A. 1998, ApJ, 494, L1
- (13) Eisenstein, D.J., Hu, W., & Tegmark, M. 1998, in preparation (EHT)
- (14) Evrard, A.E. 1997, MNRAS, 292, 289
- (15) Freedman, W.L., Mould, J.R., Kennicut, R.C., & Madore, B.F. 1998, IAU Symposium 183 [astro-ph/9801080]
- (16) Fry, J.N. 1996, ApJ, 461, 65
- (17) Holtzman, J.A., 1989, ApJS, 71, 1
- (18) Hu, W., & Sugiyama, N. 1996, ApJ, 471, 542
- (19) Hu, W., Sugiyama, N., & Silk, J. 1997, Nature, 386, 37
- (20) Hu, W., Eisenstein, D.J., Tegmark, M., & White, M. 1998b, in preparation
- (21) Huey, G., Wang, L., Dave, R., Caldwell, R.R., Steinhardt, P.J. 1998, preprint [astro-ph/9804285]
- (22) Jain, B., & Bertschinger, E. 1994, ApJ, 431, 495
- (23) Jungman, G., Kamionkowski, M., Kosowsky, A. & Spergel, D.N. 1996, Phys. Rev. D, 54, 1332
- (24) Meiksin, A., Peacock, J.A., & White, M. 1998, in preparation
- (25) Metcalf, R.B., & Silk, J. 1997, preprint [astro-ph/9708059]
- (26) Peacock, J.A. 1997, MNRAS, 284, 885
- (27) Perlmutter, S., et al. 1998, Nature, 391, 51
- (28) Riess, A.G., et al. 1998, AJ, in press [astro-ph/9805201]
- (29) Scherrer, R.J., & Weinberg, D.H. 1997, preprint [astro-ph/9712192]
- (30) Seljak, U. 1996, ApJ, 463, 1
- (31) Seljak, U., & Zaldarriaga, M. 1996, ApJ, 469, 437
- (32) Tegmark, M. 1997, Phys. Rev. Lett., 79, 3806
- (33) Tegmark, M., Taylor, A.N., & Heavens, A.F. 1997, ApJ, 480, 22
- (34) Tegmark, M., & Peebles, P.J.E. 1998, ApJ, in press [astro-ph/9804067]
- (35) Tegmark, M., Eisenstein, D., Hu, W., & Kron, R. 1998, ApJ, submitted [astro-ph/9805117]
- (36) Turner, M.S., & White, M. 1997, Phys. Rev. D, 56, 4439
- (37) White, D.A., & Fabian, A.C. 1995, MNRAS, 273, 72
- (38) White, S.D.M., Navarro, J.F., Evrard, A.E., & Frenk, C.S. 1993, Nature, 366, 429
- (39) Zaldarriaga, M., Spergel, D.N., & Seljak, U. 1997, ApJ, 488, 1