An Infrared Search for Star-Forming Galaxies at
Abstract
We report the cumulative results of an on-going near-infrared search for redshifted H emission from normal galaxies at z2. An infrared search reduces the bias due to reddening. Using narrow-band imaging with the Near Infrared Camera on the Keck I 10-m telescope, a survey area of almost 12 square arcminutes has been covered. Target regions were selected by matching the redshifts of QSO emission and metal-line absorptions to our available filters. The survey depth is 7 ergs/cm2/s (3) in H and K′ 22. Eleven H-emitters, plus two Seyfert I objects, have been discovered. The high density of galaxy detections, corresponding to a co-moving volume density of 0.0135 Mpc-3, makes it unlikely that all of the H flux in these objects is the result of active nuclei. There is a strong suggestion of clustering in the environments of metal-line absorbers. Each candidate galaxy lies typically within a projected distance of 250kpc of the QSO line of sight and is resolved but compact. The average Star Formation Rate inferred for the galaxies from the H flux is 50 M⊙/yr, significantly higher than current day star-forming galaxies, but consistent with other estimates for galaxies at high redshift.
1 Introduction
In Malkan, Teplitz, & McLean 1995 (hereafter MTM95), we presented one of the first detections of a star-forming galaxy at and strong evidence that it belongs to a group of such objects (Malkan, Teplitz, & McLean 1996, hereafter MTM96). The two years since then have seen a dramatic increase in the normal galaxies known at high redshift; that is, galaxies that are not obviously powered by a dominant non-stellar source, such as a Seyfert nucleus. Steidel et al. (1996) have discovered galaxies at by observing the drop off in the UV continuum below the Lyman limit. Other groups (e.g. Francis et al. 1996, Pascarelle et al. 1996) have found Ly emission from galaxies at . Yee et al. (1996) and Trager et al. (1996) have serendipitously found gravitationally lensed galaxies at . All of these other discoveries relied on the rest-frame UV, where the effects of intrinsic reddening are largest. In this paper, we present the results of an ongoing near-IR search for redshifted H emission from normal galaxies at ; at a redshift of z=2.05, H moves into the K-band at 2.0 m. By finding line emission from the rest-frame optical, we obtain a sample which is potentially more complete because it avoids most of the bias against reddened galaxies. Further, H is directly related to the on-going formation of the youngest, most massive stars (Kennicutt, 1983).
Using 1% wide () interference filters, we can detect line emission by comparing the flux in the narrow-band to the continuum measured in a standard broad-band 2 m filter, such as K′ (1.95-2.30 m). Objects which have no line emission will all have the same narrow-to-broad band color, as determined by the relative widths and transmissions of the two filters. An object which has H emission at the right redshift however, will be relatively brighter in the narrow filter. In our typical exposure times, we detect objects at K′22 (3) with an H flux ergs/cm2/s (corresponding to M⊙/yr) at the 99.5% confidence level. To increase our chance of finding new galaxies in the redshift window given by one of our narrow-band filters, we survey fields containing known objects (QSOs or metal absorption-line systems) at redshifts which place H in the centers of those filter bandpasses. Follow-up optical spectroscopy and photometry is obtained of fields containing a detection.
This infrared survey has revealed 5 strong H-emitters, 6 weaker ones, 2 Seyfert Is, and several objects with very red colors but no apparent line emission. The first object detected (MTM95) appears to belong to a cluster of galaxies at z=2.5 (MTM96). We present here details of the survey to date. First we will discuss the individual fields, and then the conclusions we draw from the sample as a whole. Throughout this paper, we assume H km s-1Mpc-1 and q.
2 Observations
All observations in this survey were taken at the 10-m Keck I and II telescopes. We obtained images of 23 fields with the Near IR Camera (NIRC), which has a 256256 pixel InSb array, (Matthews et al., 1994) and a field of view of 38′′ 38′′; 0.15′′/pixel. Although the field of view is small, this instrument has high throughput and excellent depth under good seeing conditions. Deep B,V and I imaging of the same fields was obtained with the Low Resolution Imaging Spectrometer (LRIS), which has a 20482048 pixel CCD detector, with a field of view of 5′ by 7′ (Oke et al., 1995).
The Near IR Camera has five narrow-band filters in the 2–2.5 m range. For the broad-band, we use the K′ filter (Wainscoat & Cowie 1992). Table 1 lists the properties of each narrow-band filter, including their transmission as measured from our extensive photometry of object fields and calibration stars. The molecular hydrogen transition filters have significantly lower transmission than the other three, so we soon decided not to use them. The filter centered at 2.24 m, called the “K-continuum” filter, is wider than the others, with . The wider band pass makes this filter less attractive, since it increases the sky background without any increase in emission-line flux. However, the tradeoff between contrast and search volume was favorable for a number of fields on our target list that included multiple absorption line systems within the redshift range probed by that filter (z=2.42–2.46), and in those cases we opted to use it.
All IR observations were taken using the “dither pattern” technique, in which many small displacements (e.g.3–5′′) of the telescope are made between successive exposures on the same field (see McLean & Teplitz, 1996, among many others), and twilight flat-fields were used to divide out variations in detector response. Observations were reduced as follows. Each frame was divided by the flat-field, and then an individual sky frame was created for each exposure from a running median of the other object frames taken nearest in time to each observation. This specific sky frame was then subtracted from the object frame. In cases where a flat field was unavailable, the sky frames were generated first, then normalized to their mode and used as a flat, while sky subtraction was handled in aperture photometry. Detailed comparisons showed little appreciable loss in the signal-to-noise ratio when using the latter method. All data reduction was performed using IRAF routines. A similar technique was used for I-band observations. The B and V band CCD observations, however, were taken without dithering, and they were divided by twilight flats. Objects were identified with the SExtractor program for galaxy identification and analysis (Bertin & Arnouts, 1996) and the object list was checked by eye for each frame.
Photometry was performed in circular apertures of 10 pixels (1.5′′) diameter (approximately 2.5 times the seeing disk), which corresponds to 12 kpc at z=2.5. The size of the aperture was chosen primarily to obtain optimal signal to noise (see Thompson et al., 1995, and Howell 1989). The mode of the pixels in a “sky annulus” around the aperture was subtracted, to ensure proper sky subtraction in addition to that performed in the initial reduction. The same aperture size was used for both broad-band and narrow-band frames. As a check on these results, we also performed photometry in elliptical apertures determined by Kron’s “first moment” (Kron 1980) routine in the SExtractor software. In that case, the apertures were determined in the broad-band frame and then used with the same size and orientation in the narrow-band frame. The flux ratios for each method agreed to better than 10%.
A third check was performed using gaussian fitting. A two dimensional gaussian profile was fitted to each object in the broad band, to determine the shape and amplitude. The same gaussian was fitted to the narrow-band image with only the amplitude allowed to vary. Figure 1 shows a comparison of this method with the aperture photometry.
Error Analysis
Since we are looking for apparent excess in the broad-band minus narrow-band color, accurate measurement of the photometric errors is essential. Errors in photometry were calculated from the limiting magnitudes. First, photometry was performed on several hundred randomly selected locations within the frame, using the same standard aperture adopted for objects and the same “sky subtraction” annulus. This set of sky measurements was analyzed to obtain the standard deviation of the flux in the apertures. To demonstrate the validity of this method the following procedure was used. For each frame, we inserted fake objects and measured their photometry in the standard aperture. Several hundred such tests were performed across each image. The deviation in these measurements from the flux inserted agreed to better than 5% with the “blank sky” photometric method of determining 1 errors, as expected; except for the random placement of the apertures, the methods should be identical.
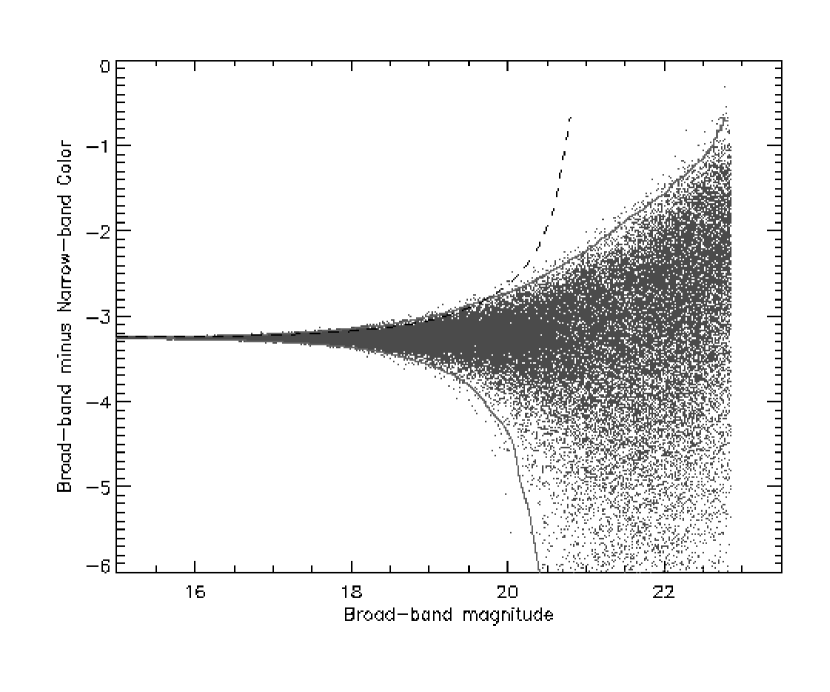
The next step in error analysis is to consider the propagation of individual photometric errors into the derived color value. At first we considered adding the individual fractional photometric errors in quadrature. This basic approach is traditionally derived from the first order term in a Taylor expansion of the function into which errors are being propagated. However, the first order terms are not sufficient in the case where the errors are relatively large compared to the measurements themselves. In our case, the large error regime is important, particularly in cases where an object may be detected more strongly in the narrow band than in the broad band. In order to account for higher order terms, we chose to model the error analysis. We assumed a gaussian distribution of photometric errors and then generated a data set of 100,000 points based on a known ratio of broad to narrow band flux. We remove objects that are less than 1 (after adding the gaussian error) in the broad-band from the simulated population, as they would be undetectable and would not populate our measured color-magnitude diagrams. Using this simulation, we are able to define confidence intervals by simply counting the simulated measurements (see Figure 2).
We find, as expected, that for the regime where errors are relatively small, the traditional approach is accurate. In the case of objects with flux levels less than 5 times the photometric error, the first order error analysis grossly overestimates the error in the color, due to the vanishing denominator. Even in cases of 5-10 objects, there can be substantial deviation. We adopt the approach of using our empirically derived confidence intervals in evaluating color-magnitude plots.
The derived confidence intervals can be described to a reasonable approximation in terms of a single noise characteristic, . If the broadband minus narrowband magnitude difference for featureless continuum emitters is given by , then we find that the shape of the upper confidence interval is well approximated by:
| (1) |
where is the broad band flux. This empirical formula thus gives a good estimate of how large a magnitude difference is required to be significant at the 99.5% confidence level. In our analysis, we use the slightly more precise upper boundary defined by the Monte Carlo simulations.
Target Selection and Control Fields
Targets were selected from a search of NASA/IPAC Extragalactic Database (NED). We looked for fields containing QSOs, both radio loud and radio quiet, or absorption line systems, both Damped Ly Absorption or metal line absorption. Objects south of -30∘ were not considered. We then selected fields at redshifts within of the central redshift of the filters. Table 2 describes the observations by date and filter.
In order to determine the effect of our target selection on the density of detections, we need to obtain control observations. We plan to begin such an experiment by observing targets at which have no absorption systems at redshifts to place H in our narrow-band filters. One preliminary observation of this kind detects no emission-line galaxies in one NIRC field around the QSO 1542+4744 with an integration time of 6480 seconds in the narrow band, during which time we reached a 3 limiting flux of 6 ergs/cm2/s (as deep as most of the z=2.5 target fields). A shallow observation of the field around the QSO 0234+013 also detects no emission-line galaxies, down to a limiting flux of 9 ergs/cm2/s. Two similar observations were carried out by Pahre & Djorgovski (1995) also with NIRC on Keck targeted to known objects at , finding no detections in two NIRC fields, with flux limits of 3 ergs/cm2/s.
3 Individual Fields
Our survey observations always consist of broad-band K′ imaging, along with at least one interference filter. Follow-up observations are still ongoing for many fields. We present the results to date in this section. Table 3 lists the photometry currently available for all the H -emitting objects, as well as the inferred line fluxes and star formation rates.
The Star Formation Rates (SFRs) for objects were inferred using the result from Kennicutt (1983) relating SFR to H luminosity, assuming a Salpeter Initial Mass Function with an upper mass cutoff of 100M⊙:
| (2) |
.
Individual fields are discussed below.
Q0114-089
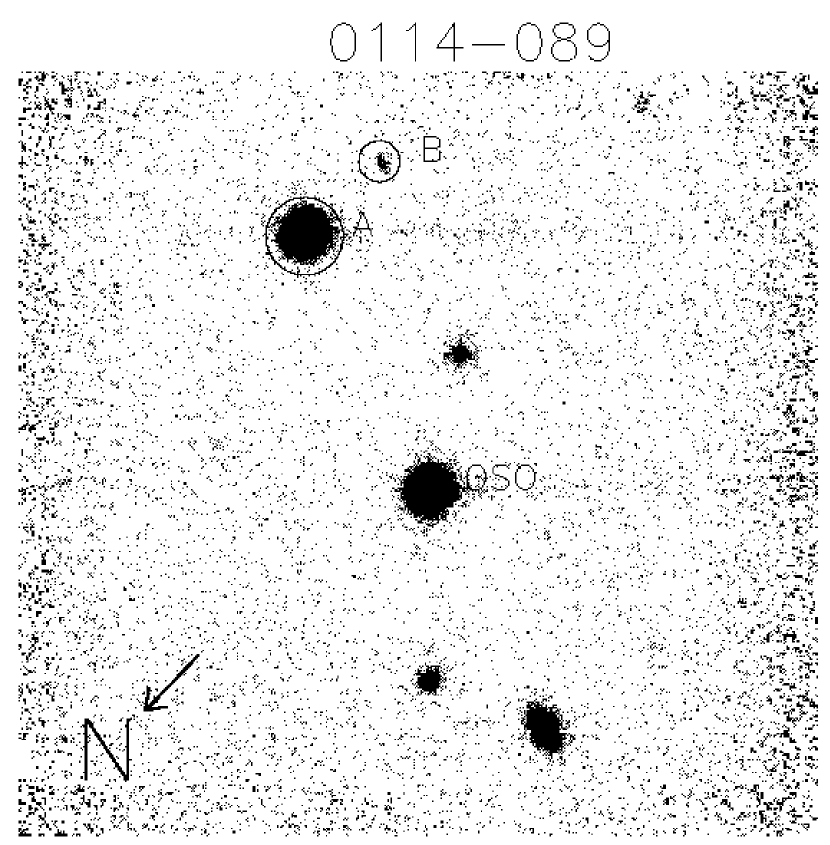
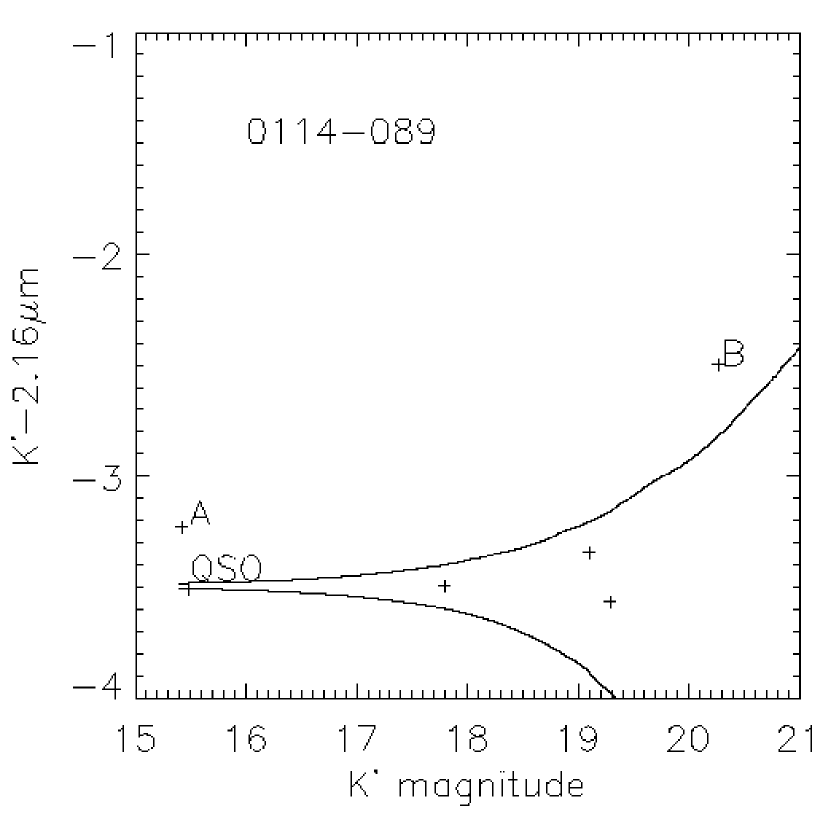
This QSO at zem=3.157 (Osmer, Porter, & Green, 1994) has a metal-line absorption system at z=2.2995 (Sargent et al. 1988). We observed the field through the 2.16 m filter. Figure 3 shows the image and Figure 4 shows the narrow-minus-broad band colors. There are only six objects total in the field, making the zero-excess color hard to define, but four of the six objects lie close to the line predicted from other observations through the same interference filter (Broad/Narrow 24). Two objects show up as having excess flux in the narrow filter. The fainter one (object B) appears to be a probable detection, much like other candidates in the survey. The brighter object (A) is harder to explain; it is too bright (K′=15.4) to be a likely star-forming galaxy at z=2.3. Comparison with the Planetary Camera snapshot image in the HST archives (see Maoz et al. 1993) shows the object to be two magnitudes redder than the the QSO, having V=19.8 and V-K=4.4, compared to the QSO which has V-K=2.3. The snapshot image is distorted due to telescope guidance problems, but in both that image and the K-band image (with poor seeing, FWHM=0.75″) object A appears unresolved. It is thus most likely that object A is a Seyfert 1 at the redshift of the absorber. Object B lies 19.2″ from the QSO, and has an inferred SFR of 59 M⊙/yr.
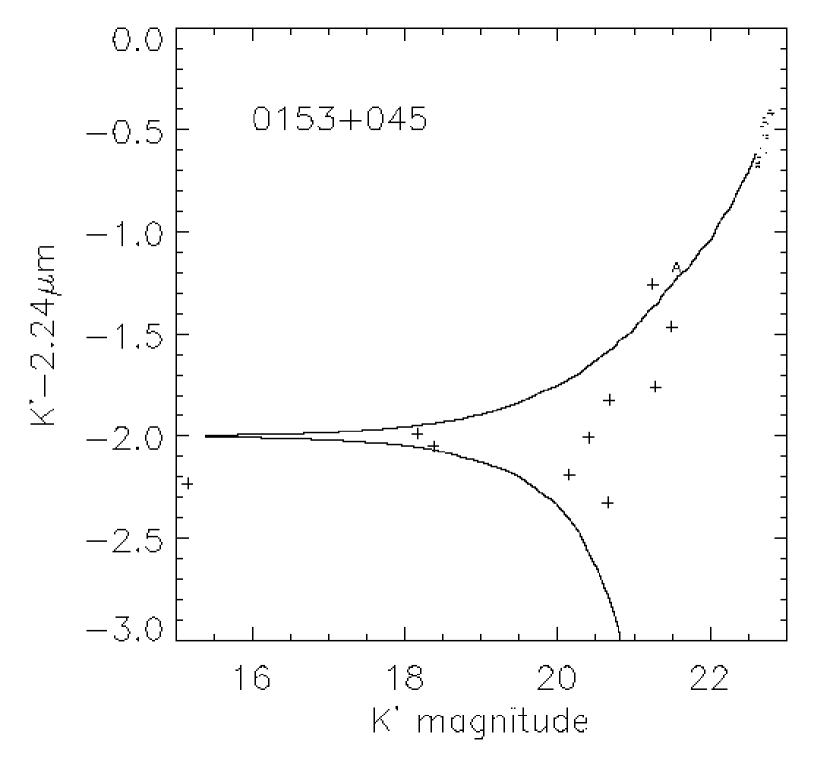
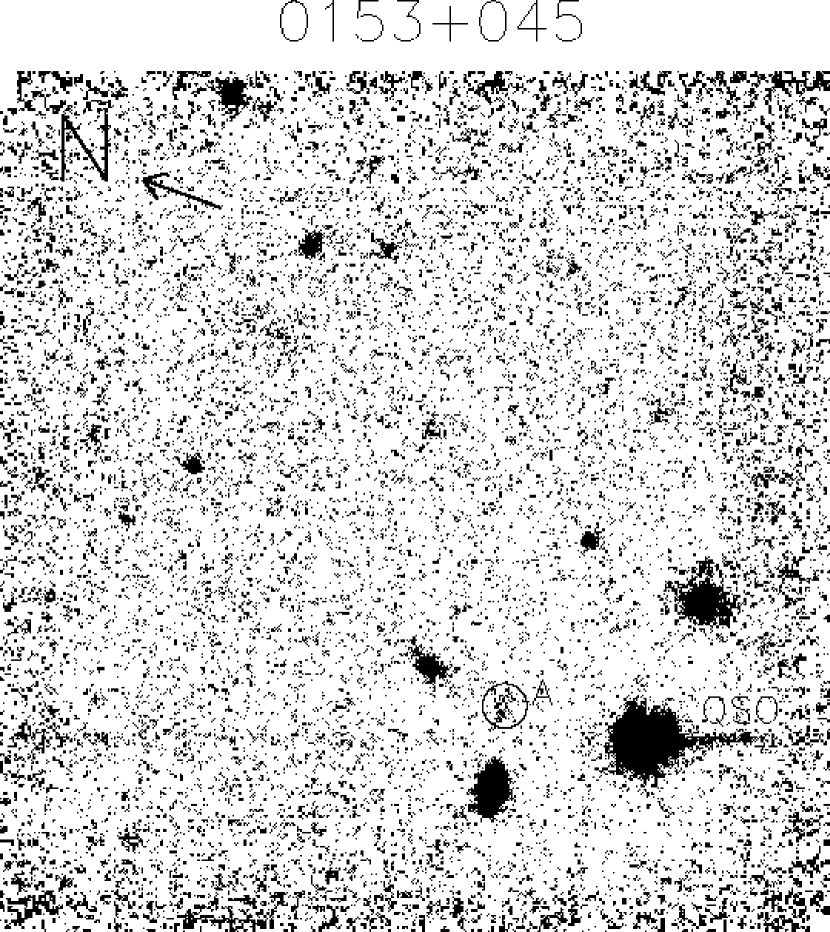
Q0153+045
The QSO 0153+045 has a CIV absorption system at z=2.4243 (York et al., 1991). We have obtained deep K′ imaging of this field as well as narrow-band observations through the 2% wide K-continuum filter. Figure 5 shows the narrow vs. broad band colors. One object stands out as a probable H-emitter. The m of this object lies close to the limit that we can detect at 3). We initially observed this field January 1996 using fairly typical integration times (1080 seconds in the broad-band, 4050 seconds in the narrow-band). In November 1996, we returned to the field to confirm the detection by independently repeating the observation. We obtained new integrations which were 50% longer in the broad band and 20% longer in the narrow band than the previous ones. Figure 5 shows the average narrow vs. broad band colors from the two observations. While the objects are fairly faint in the broad-band (necessitating the longer integration on the second visit), excellent agreement was found in the two narrow-band observations. The object was confirmed as a probable H-emitter.
The object is separated from the QSO by 8′′, or 64 kpc (see Fig. 6). The inferred SFR for this object is not remarkably high for our survey, being 42 M⊙/year. We have also obtained I and J images of this field and some area around it. The faint H-emitter is one of the redder objects detected in the survey. Its I-K′ color of 3.5 is nearly as red as that of MTM095355+545428 (with I-K′=3.8). During a night of poor weather, we attempted V band imaging of the field, but obtained only upper limits, suggesting V-K.
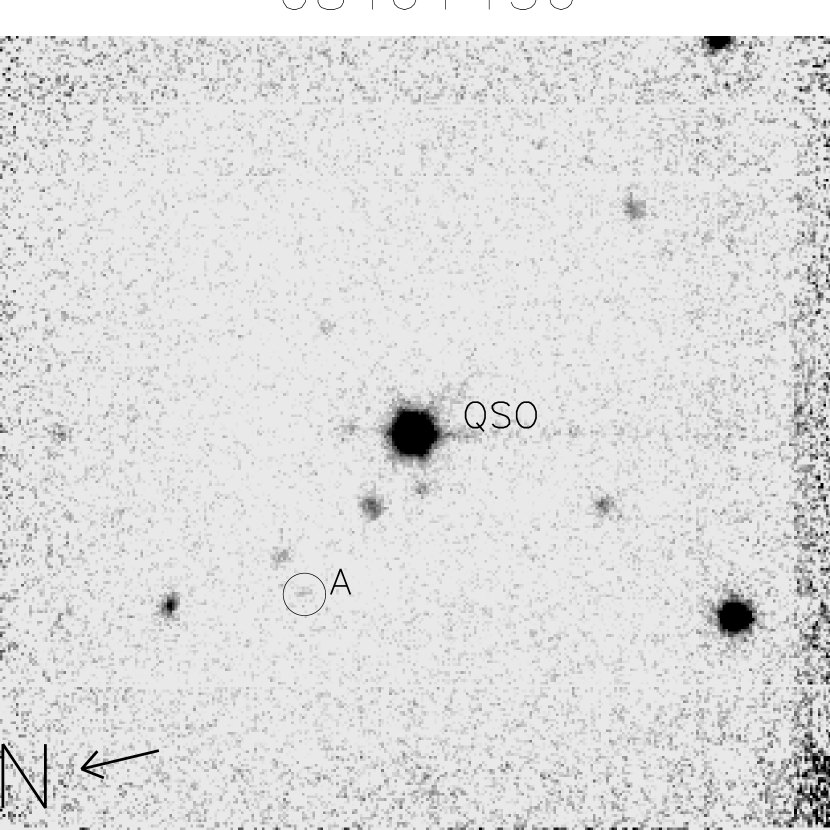
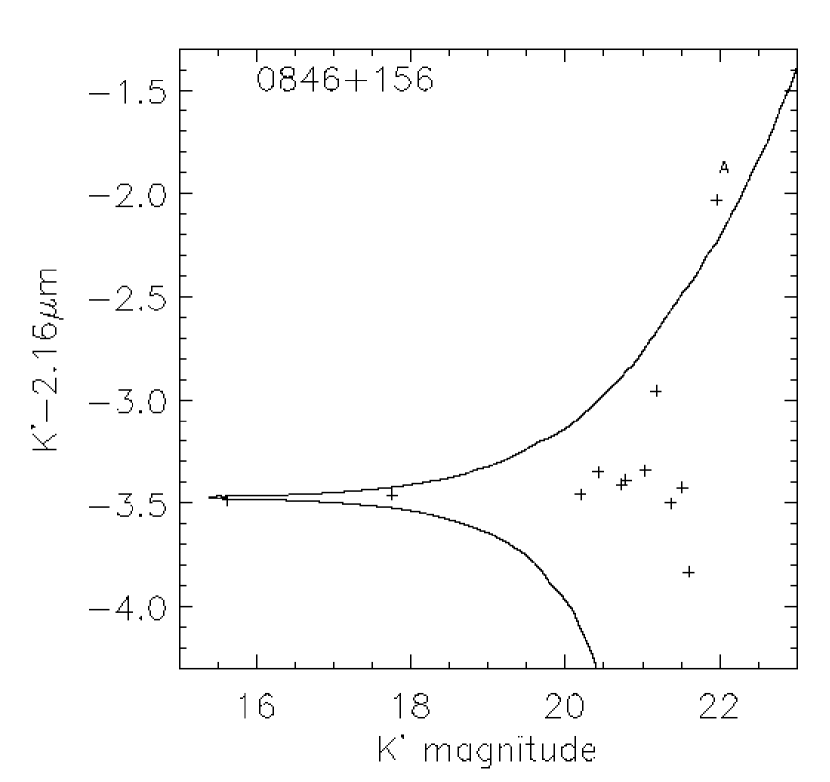
Q0846+156
The field around this z=2.928 QSO (Hazard et al., 1986) was chosen as a target for the Br filter due to its CIV absorption system at z=2.28 (York et al., 1991). We find one object that is a possible H-emitter, though it is barely present in the broad-band image (Figure 7) this object is well detected in the narrow-band suggesting that it is indeed emitting strong H (see Figure 8). If we accept this object as a detection, it is the faintest high-z object in this survey, with K′. It would have SFR=19M⊙/yr. Our planned followup of this object was weathered out, so confirmation is still pending.
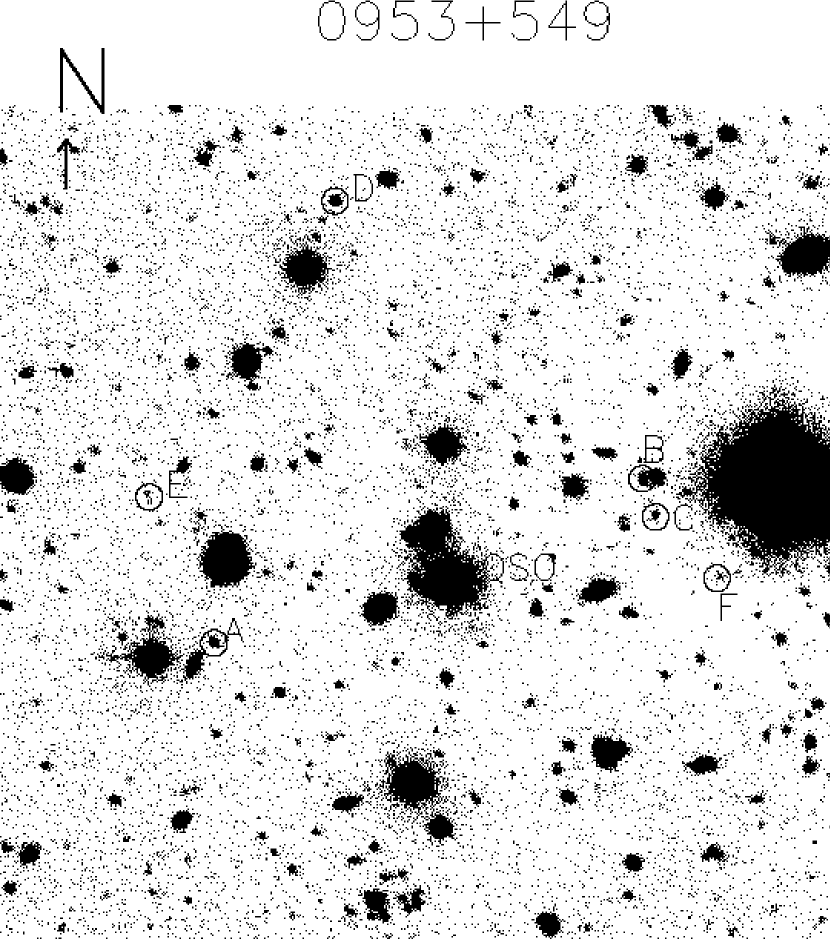
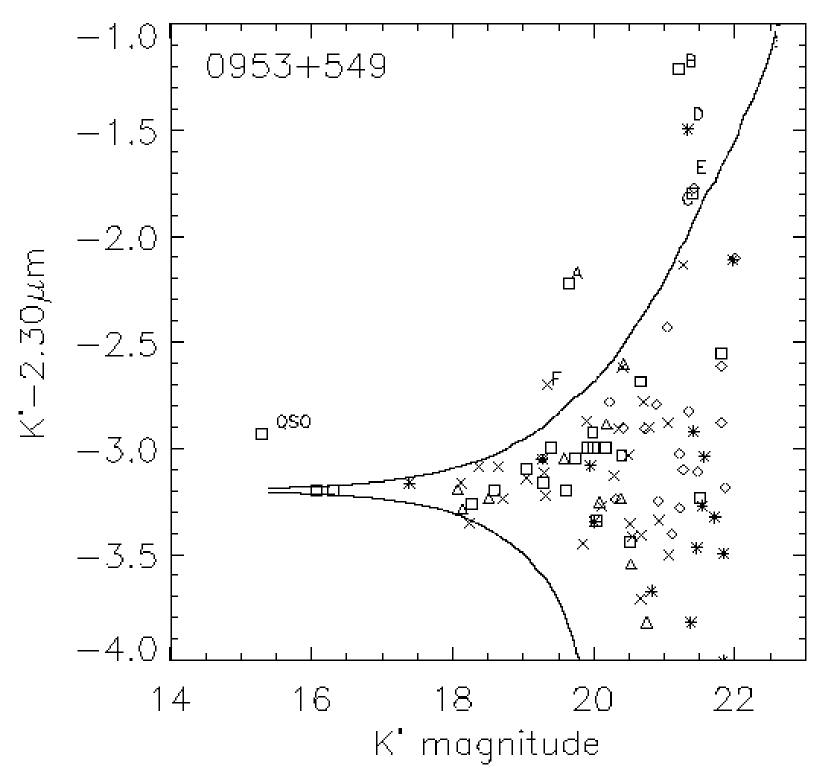
MTM0953+549
The quasar SBS0953+549 (zem=2.579) was of special interest as a survey target because its spectrum shows a strong absorption system at = 2.50176 0.00004, and weaker systems at 2.49174 and 2.50911 (Levshakov 1992). We obtained narrow-band images, through the 2.30 m CO(2-0) filter, of three adjacent NIRC fields around this object (see Fig. 9) as well as deep BVI photometry of a more extended area. As we reported in MTM96, comparing the broad and narrow-band fluxes reveals three definite H-emitting objects. The brightest of these was confirmed by spectroscopy to be at z=2.498, and to show absorption lines consistent with a continuum dominated by young stars. In addition, it showed strong UV emission lines, consistent with star formation, or with ongoing star formation and a small active nuclear component. Since then we have obtained narrow band data on four more adjacent fields, which contain one certain H-emitter (well above the 3 limit) and two probable ones (see Fig. 10). The narrow–broad colors for the entire area surveyed are shown in Fig. 10. The new detections are indicated on Figure 9 as objects D,E and F. They lie 35.7″, 24.8″, and 24.4″ (285.6, 198.4, and 195.2 kpc) from the QSO line of sight. Their inferred SFRs are 56, 36 and 55M⊙/yr. Objects E and F lie closer to the 99.5% confidence limit, having a weaker emission-line flux than object D, but they fell near the boundary of our NIRC fields, and thus we were able to observe them twice, independently confirming the detection.
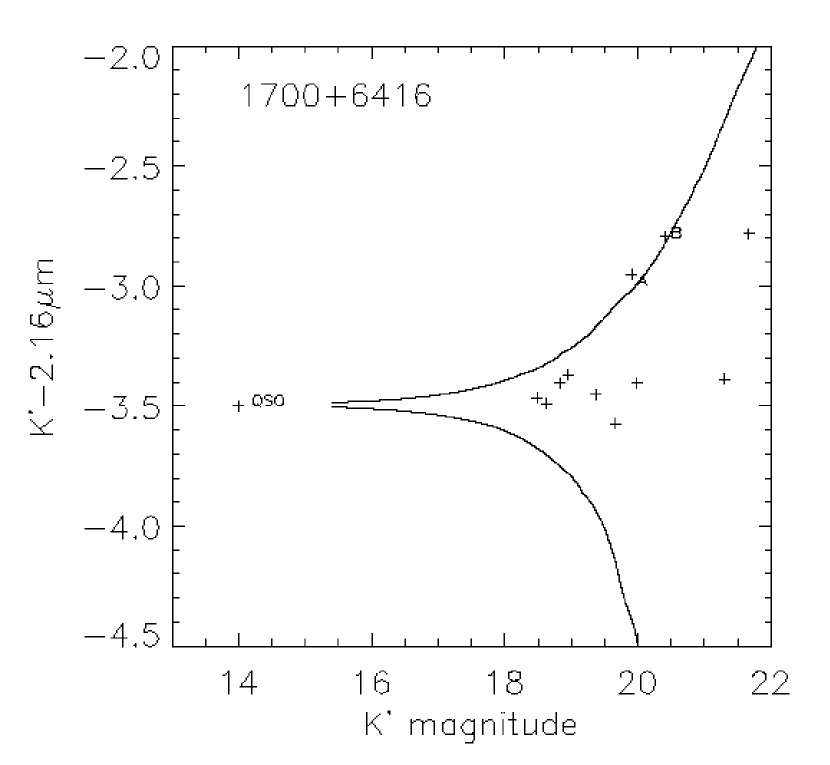
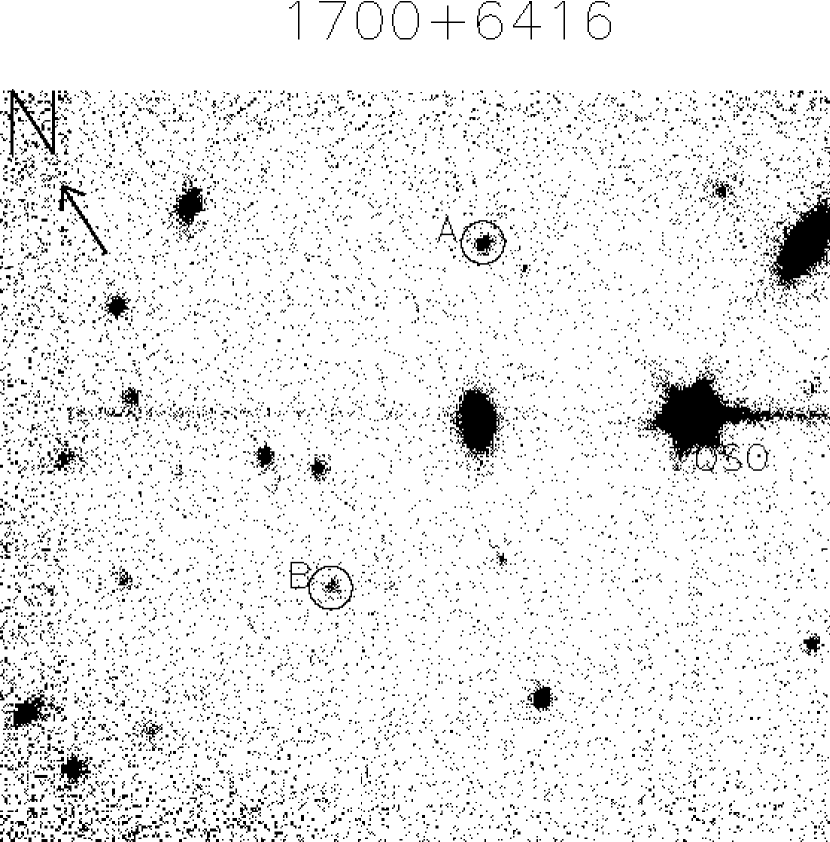
HS1700+6416
This field was also chosen for its multiple absorption systems. The QSO’s spectrum shows Lyman series absorptions that fall in all three of the filters in our survey (Vogel & Reimers, 1995). We chose to first observe the absorption systems at that places H in the Br filter. Fig. 11 shows that two objects have a broad–narrow color consistent with probable H emission. These objects are located within 21′′ of each other, and 15′′-22′′ of the QSO line of sight (see Fig. 12). The objects have inferred SFRs of 33 and 35M⊙/yr. We obtained followup J band data in poor seeing conditions in March 1997, in which we detected the two objects. The J-K′ colors of 1.7 and 3.4 are also consistent with those of galaxies at large distances.
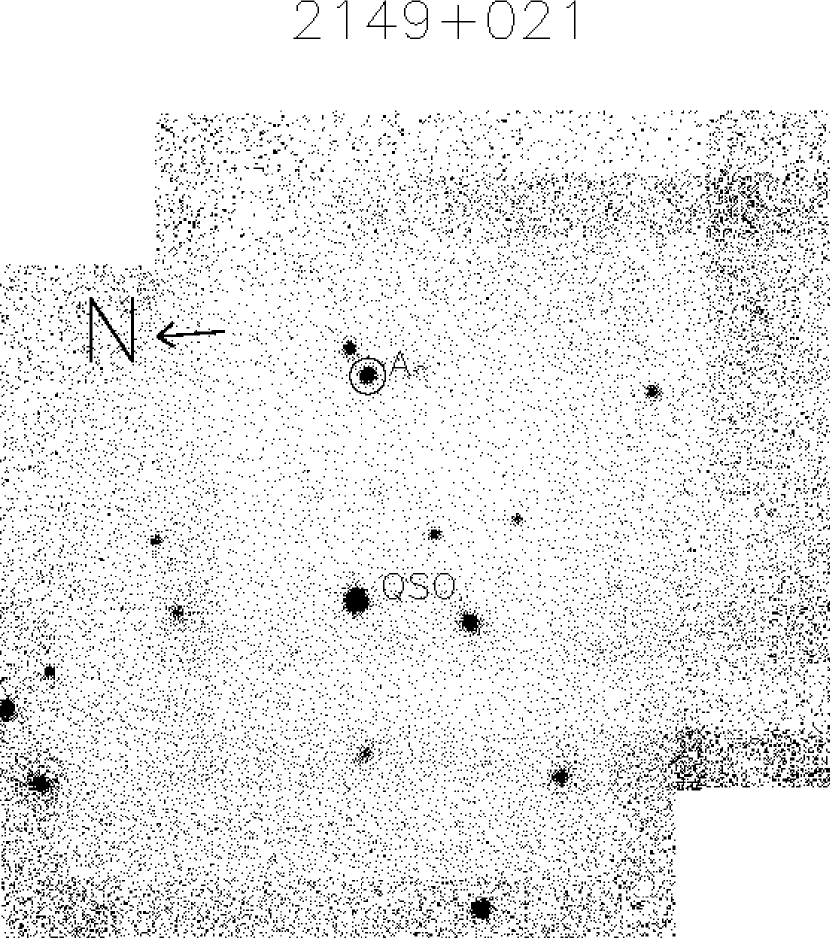
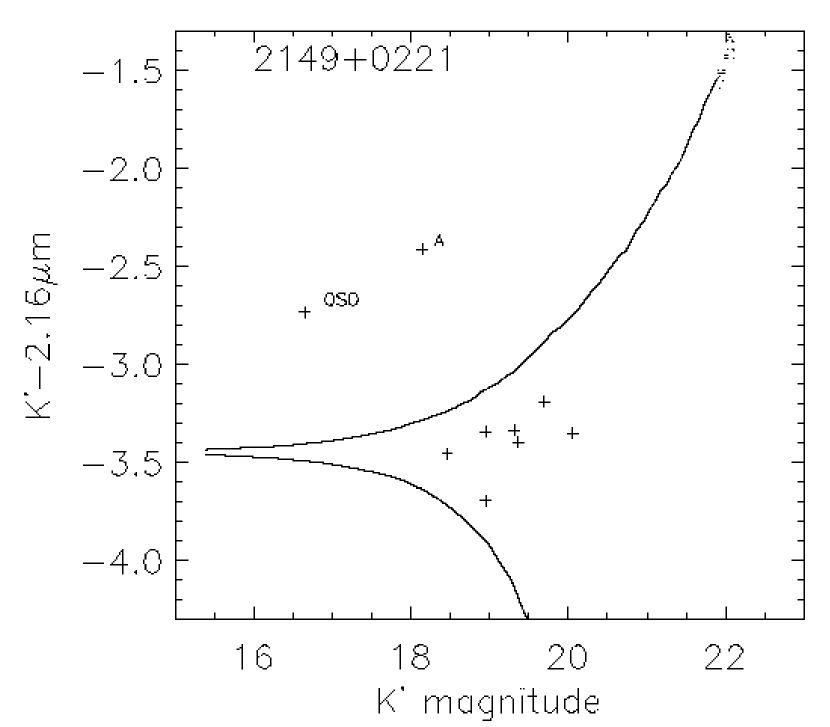
PC 2149+0221
PC 2149+0221 is a quasar at (Schneider et al., 1994). We observed the field around the QSO (see Fig. 13) in JHK′ and with the 2.16 m Br filter. Figure 14 shows that one object clearly stands out as having strong H emission. The dimensionless Equivalent Width of this line () is 1.0%. Its magnitude of K′=18.15 leads to an inferred Star Formation Rate of 217 M⊙ / year. This is the largest SFR in our sample, and would considerably higher than most other galaxies, even at this redshift. The galaxy is extremely compact, with FWHM = 0.69′′ compared to a seeing disk of 0.54′′. It lies 15′′ from the QSO, which projects to a distance of 119kpc at . The colors of this galaxy are the bluest of any in our H sample. Its extremely compact morphology and blue colors suggest that this object has an active nucleus from which we were seeing H emission, and followup spectroscopy confirmed this conclusion, showing broad lines indicative of a Seyfert 1 nucleus (Malkan et al. 1998 in preparation).
4 Survey Results
To date we have surveyed more than 11 square arcminutes, with 3 line flux sensitivities 0.5–1ergs/cm2/sec and broad band sensitivities of K′22. The faintest line-emitting galaxy has K′=22.1. We have detected a total of 5 strong H-emitting objects (ergs/cm2/s), 6 weaker ones, and two Seyfert 1 galaxies. Some of these objects are clustered in groups of two or three. Table 4 lists the K′ photometry of each QSO in the fields observed.
Figure 15 shows the SFR vs. K′ magnitude for the H-emitters excluding those where we believe the dominant flux contribution comes from a Seyfert nucleus. We have plotted MTM095355+545428 with the assumption that a third of its H emission comes from an active nuclear component. The average inferred SFR of detected galaxies is 52 M/year. This rate is significantly higher than most current day star-forming galaxies. It is also higher than some measured SFR for field galaxies at from optical surveys (Steidel et al. 1996), which find an average (without extinction correction) closer to 10 M⊙/ year. It is possible that our higher inferred star-formation rates are typical of high redshift emission-line galaxies and that optical searches systematically underestimate star-formation due to reddening of the UV-continuum. The rest-frame EW(H) we are seeing is 40Å or more, comparable to what is seen in modern spirals of type Sc or later. If some high-z galaxies have smaller EW’s, then our density estimate would be a lower limit.
We can also examine the angular distribution of the detected objects. Figure 16 compares the number of galaxy detections to the area surveyed as a function of radial distances from the QSO line of sight. If we exclude the 0953+549 detections, we find no significant edge to the possible clusters of line-emitters out to 40′′. The fact that there is no density enhancement close to the QSO line of sight indicates that the projected surface density does not change over projected separations from 20 to 250 kpc. 0953+549 is the only field that has been surveyed beyond a radius of 40′′ from the QSO line of sight. Though we detect objects in the most outlying NIRC frames in that region, all of the line-emitters are within 40′′ of the targeted QSO. This might be providing a marginal hint of an edge to the cluster of galaxies beyond 250 kpc in this field.
All of the objects detected are extremely compact. They typically show FWHM 0.9′′ 0.2′′, compared to a usual seeing disk of 0.6′′. Figure 17 shows the extent of the H-emitters. The typical sizes correspond to a projected diameter of 6-9 kpc. The high central surface brightness favors detection by our technique. It is possible that we systematically miss the most extended objects. While all the objects are compact, they vary in morphology from almost round to noticeably elliptical (b/a 0.5). Other known high redshift galaxies are also seen to be extremely compact. Lowenthal et al., 1997, report that spectroscopically confirmed galaxies in the Hubble Deep Field are seen with mean half light radii, kpc; they also report disturbed morphologies, which would not be detected at the resolution of NIRC.
Finally, we note that all of the probable star-forming objects detected have been in fields containing metal absorption-line systems, not fields at the redshift of the QSO. The only H-emitter detected at the redshift of a QSO was the Seyfert 1 in the 2149+0221 field.
5 Discussion and Conclusions
As discussed in MTM96, there is the possibility that all these galaxies have an active nuclear component that contributes to their line emission. We will address this suggestion before drawing conclusions from the H-emitting sample as a whole.
Are we detecting AGN?
The observed space density of high redshift quasars is so much smaller than our space density of detections that they are very unlikely to be the same population. Warren et al. (1994) calculate the Luminosity Function (LF) for bright QSOs at . This LF can be used to estimate the density of active galaxies at the redshifts covered by our survey. For bright quasars, with continuum absolute magnitudes on the AB system of , the space density is / Mpc-3. Using the evolving luminosity function suggested for the quasars, we can extend this LF down to the average magnitude for our detected objects, . This calculation predicts a density of /Mpc-3; or, put another way, the QSO density predicts that we should have to observe more than 100 fields to find a single AGN. Our observed density of detections is higher than this by several orders of magnitude. If all of our objects were to prove to have active nuclei, their space density is three orders of magnitude higher than expected, so we are not simply probing the usual population of quasars that are well studied by numerous surveys.
The predicted density of AGN is more consistent, however, with that detected in the Lyman Limit searches, which typically find 10% of their objects to be AGN (as estimated from counting the number of AGNs reported in, for example, Steidel et al., 1996). Our detections may be, on average, redder than the LLD galaxies, and they probably have stronger line emission (many LLD galaxies have Ly in absorption, not emission). If LLD searches were to probe the entire galaxy population at , while our survey were to be unable to find anything but AGN, one would conclude that we should arrive at a space density ten times smaller that the LLD searches. That is not what observations show, however, as our inferred space density may be as much as 5 times larger than estimates based on LLD searches.
On the other hand, our space density of objects is consistent with other searches which have been conducted for Emission Line Galaxies in the same redshift range. They, too, find clusters of ELGs. In particular, some of the rare successes of Ly searches have discovered groups of emission-line galaxies. The highest density of objects observed in a single field is the Pascarelle et al., 1996a, survey which found 18 Ly-emitting objects within 1 Mpc2 and 300 km/s of the radio galaxy 53W002. These objects have been interpreted as “subgalactic clumps” that will collapse into a L* or slightly larger galaxy. However, like one of the objects in the present survey, those ELGs show strong Ly emission, as well as CIV and NV in some cases. The same authors later detected similar objects in parallel HST observations (Pascarelle et al., 1996b). A high density of Ly- and CIV-emitting galaxies, some up to L*, would explain most of our detections. Francis et al. (1996, 1997) have detected a supercluster of Ly-emitters at z=2.38, all of which appear to have AGN characteristics in their spectra. They speculate that they are detecting a dust-reddened population of active galaxies that are the radio-quiet counterparts of the radio-galaxy population. They further suggest that they are seeing a population of galaxies undetectable in other surveys due to their red colors. While that comparison was suggested to exclude our survey based on MTM96, their I-K galaxies are not uniformly redder in I-K than objects in the present survey. We report several galaxies with I-K4, while Francis reports I-K=3.4–5.2 for various objects. This allows the possibility that both surveys could be finding a similar population.
Does the space density imply clustering?
We detect a higher density of objects than is observed either at the present day or in the LLD galaxies. We find up to galaxies/sq. arcmin. in volumes that are 1 or 2% deep in redshift (though the galaxies may occupy a smaller z if they are clustered). LLD galaxies are found with a density of 0.4–0.75/sq. arcminutes, but over a much larger redshift range. We can also consider the comoving volume density. As a typical example of an LLD search, Madau et al. (1996) finds field galaxies with in the Hubble Deep Field with a comoving number density of Mpc-3 down to L*. Calculating the comoving volume density of our detections yields 0.0135 Mpc-3, a factor of 3-5 times more than the LLD galaxies. The errors are based on Poisson statistics (Gehrels 1986). The density could be higher if these galaxies are not uniformly distributed in the surveyed redshift windows; for example, if the H-emitters were as close the the absorber in the radial direction as they are in on the sky, the density could be 20 times higher. It is difficult to say whether all of these emission line galaxies would be found by the UV technique without more direct comparisons (see for example Bechtold et al. 1997) for H observations of a galaxy with the characteristic spectrum of a UV-selected galaxy). Alternately, we consider the density of H -emitters excluding the most likely cluster (0953+549) and excluding the Seyfert 1 (2149+02). In that case, we find a comoving density of 0.008 Mpc-3, still twice that of LLD galaxies, though Poisson statistics show the difference is only at the 1.5 level.
We can also compare our observed density of objects to the current day volume density. For example, the comoving density of present-day galaxies brighter than L∗ is Mpc-3 (Loveday et al. 1992). This comparison may only be lower limit, as there may be effects of luminosity evolution to consider. For example, Cowie et al. (1996) find the normalization of the luminosity function, , approximately doubles between z=0.2 and z=1.0. However, the evolution of the LF out to is highly uncertain; different analysis of the Hubble Deep Field data set produce very different LFs (see Bershady et al. 1997 and the references therein). We adopt as a second standard of comparison, the luminosity function of Sawicki, Lin & Yee (1997; SLY) which has two magnitudes of evolution in at and a steeper faint end slop in that redshift range. SLY predict a factor of more galaxies down to today’s , or a comoving density of 1.2 Mpc-3 at .
If all our candidate galaxies are confirmed, it could imply that we are seeing clustering in the environments of metal absorption line systems. Even if the ELGs are all AGN, it would be unusual to find so many.
If we consider clustering to be a possibility, we must examine two cases – either the galaxies are in a cluster, or they are simply correlated on the large redshift scales at which we are observing. In the first case, we assume that the galaxies are at nearly identical redshifts. Specifically, we assume that they are as close in redshift as they are in projected distance, which increases our space density of detected objects by a factor of . Under this assumption, we compare our comoving density to the current day comoving density and we find that on the scale of a cubic NIRC field the correlation function, , is 5 times its present value (not accounting for possible evolution) or times the value implied by SLY at the same redshift. We note that this comparison may be an lower limit on how strongly clustered the galaxies are, if there is a gravitational effect that reduces how much the cluster expands relative to the Hubble expansion. In the second case we assume that the galaxies we detect are uniformly distributed along redshift in the window sampled by the narrowband filter. In this case, we consider a radius equal to half of the long side () of our highly rectangular search window. Comparing our comoving density to the current day, the correlation function inside that comoving volume, is then 15 times the current value (where we assume , Peebles 1973) or 5 times the value inferred from SLY.
The inferred clustering of our galaxies is somewhat stronger than what is seen between the quasar metal absorption-line systems themselves. Absorption systems have been seen to be correlated on radial scale corresponding to our z windows. Sargent, Boksenberg, & Steidel (1988) see 5—10 for CIV absorbers at scales from 200 to 600 km/s. Similarly, Steidel & Sargent (1992) see correlations of , for MgII absorbers at redshifts of 0.6z2.2. Our narrowband filters with /z=1%, probe velocity differences on the order of several times 103km/s, so we may see more clustering on this scale than is expected for absorbers.
On the other hand, the density we find seems to be consistent with surveys of QSO environments at high redshift. Ellingson et al. (1991) find that the richest environments of radio loud QSOs at are well fit by the Schechter parameters /Mpc2 and Mr*=-22.6, assuming . This predicts that down to L* we should see 0.6 excess galaxies per comoving Mpc2. In our case, we see galaxies per comoving Mpc2. Hall & Green (1998) find several radio-loud QSOs at z1.5 reside in apparent rich clusters, detected as an excess of red (in r-K) objects. Their models suggest these clusters are consistent with z, similar to the conclusions in MTM96. Hutchings, 1995, finds an excess of galaxies around QSOs at z=2.3. These counts are attributed to compact groups of starburst galaxies. The detected excess galaxies, down to R=24, is 30–84 per Mpc2. While Hutchings’ counts are not spectroscopically confirmed, they do suggest the presence of clustering at high redshifts, at least in quasar environments.
Reddening
We note that reddening could also explain the potential difference in density between LLD searches and our candidate ELGs. However, to reconcile the number counts with no clustering, we would need to be sufficiently large to make galaxies with SFRM⊙/yr unobservable spectroscopically in the optical. Depending on the reddening law, this requires mag. This amount of extinction seems incompatible with the observed g-R colors of the LLD galaxies, for any reasonable extinction law (Fitzpatrick 1986, Calzetti et al. 1994, etc.)
Even if the observed densities of LLD galaxies and H-emitters are similar (if, for example, our marginal detections prove false) reddening is still important in understanding the nature of these high redshift galaxies. In particular, consider the SFR determined from our best candidates. Even assuming (as a worst case) that there is a small (30%) AGN contribution to the line flux, we infer an average SFR M⊙/yr. This SFR is large compared to the uncorrected average SFR of the LLD galaxies (Steidel et al. 1996, Lowenthal et al. 1997)), as derived from the UV continuum. More recent estimates from the LLD galaxies (cf.Pettini et al.1997) give a factor of 3–5 redding correction, which brings the LLD average within a factor of two of ours. We can also contrast our H star formation rates with those inferred from Ly selected objects. Cowie & Hu (1998) present a dozen Ly-emitters, which would have a maximum SFR=10M⊙/yr, in the absence of extinction.
In summary, we have shown that with the Keck telescope the narrow-band near-IR search technique for emission-line galaxies at provides an effective means of detecting groups of star forming galaxies. We detect galaxies with a high comoving volume density, suggesting that it is unlikely that the line and continuum emission from these objects is dominated by active nuclei. The density further suggests that we observe clustering in the environment of metal-line absorbers. The inferred star-formation rates of these galaxies agree well with de-reddened estimates for UV-selected galaxies at similar redshifts.
References
- (1)
- (2) Bechtold, J., Yee, H.K.C., Elston, R, & Ellignson, E., 1997, ApJL, 477, 29
- (3)
- (4) Bershady, M.A., Majewski, S.R., Koo, D.C, Kron, R.G., & Munn, J.A., 1997, ApJ, 490, L41
- (5)
- (6) Bertin, E. & Arnouts, S., A&AS, 1996, 117, 393
- (7)
- (8) Calzetti, D.A., Kinney, A.L., & Storchi-Bergmann, T., 1994, ApJ, 429, 482
- (9)
- (10) Carballo, R., Barcons, X., & Webb, J.K., 1995, AJ, 109, 1531
- (11)
- (12) Cowie, L.L, Songaila, A., Hu, E.M., & Cohen, J.G., 1996, AJ, 112, 839
- (13)
- (14) Cowie, L.L. & Hu, E.M., 1998, in press in ApJ
- (15)
- (16) Ellingson, E., Yee, H.K.C., & Green, R.F., 1991, ApJ, 371, 49
- (17)
- (18) Fitzpatrck, E.L., 1986, AJ, 92, 1068
- (19)
- (20) Francis, P.J., et al., 1996, ApJ, 457, 490
- (21)
- (22) Francis, P.J., Woodgate, B.E., & Danks, A.C., 1997, ApJL, 482,25
- (23)
- (24) Gehrels, N., 1986, ApJ, 303, 336
- (25)
- (26) Hall,P.B., & Green,R.F., 1998, in press
- (27)
- (28) Hazard, C., Morton, D.C., McMahon, R.G., Sargent, W.L.W, & Terlevich, R., 1986, MNRAS 223, 87
- (29)
- (30) Howell, S.B., 1989, PASP, 101, 616
- (31)
- (32) Hutchings, J.B., 1995, AJ, 109, 1541
- (33)
- (34) Kennicut, R. 1983, ApJ 272, 54
- (35)
- (36) Kron, R.G. 1980, ApJS 43, 305
- (37)
- (38) Levshakov, S. A. 1992, AJ 104, 950
- (39)
- (40) Loveday, J., Peterson, B.A., Efstathiou, G., Maddox, S.J., 1992, ApJ, 390, 338
- (41)
- (42) Lowenthal, J.D. et al., 1997, ApJ, 481, 673
- (43)
- (44) Madau, P., Ferguson, H.C., Dickinson, M.E., Giavalisco, M., Steidel, C.C., Fruchter, A., 1996, MNRAS, 283, 1388
- (45)
- (46) Malkan, M., Teplitz, H., & McLean, I., 1995, ApJ Letters 448, L5 (MTM95)
- (47)
- (48) Malkan, M., Teplitz, H., & McLean, I., 1996, ApJ Letters 468, L9 (MTM96)
- (49)
- (50) Maoz et al., 1993, ApJ 409, 28
- (51)
- (52) McLean, I.S. & Teplitz, H., 1996, AJ, 112, 2500
- (53)
- (54) Matthews, K., & Soifer, B. T. 1994, in Infrared Astronomy with Arrays: The Next Generation, ed I. McLean (Dordrecht:Kluwer), 239
- (55)
- (56) Oke, J. B., et al.,1995, P.A.S.P, 107, 375
- (57)
- (58) Osmer, P.S., Porter, A.C., & Green, R.F., 1994, ApJ 436, 6780
- (59)
- (60) Pahre, M.A. & Djorgovski, S.G., 1995, ApJL, 449, 1
- (61)
- (62) Pascarelle, S.M., Windhorst, R.A., Keel, W.C., & Odewahn, S.C., 1996a, Nature, 383, 45
- (63)
- (64) Pascarelle, S.M., Windhorst, R.A., Keel, W.C., Scoville, N., Armus, L., 1996, BAAS, 189, 83.02
- (65)
- (66) Peebles, P.J.E., 1993, Principles of Physical Cosmology, Princeton University Press, Princeton, New Jersey
- (67)
- (68) Pettini, M., Steidel, C., Dickinson, M., Kellogg, M., Giavalisco, M., Adelberger, K., 1997, in ‘The Ultraviolet Universe at Low and High Redshift’, ed. W. Waller, (Woodbury: AIP Press)
- (69)
- (70) Sargent,W.L.W., Boksenberg,A., & Steidel,C.C., 1988, ApJS, 68, 539
- (71)
- (72) Sawicki, M.J., Lin, H., & Yee, H.K.C, 1997, AJ, 113, 1
- (73)
- (74) Schneider, D.P, Schmidt, M., & Gunn, J.E., 1994, AJ107, 1245
- (75)
- (76) Steidel, C.C., & Sargent, W.L.W., 1992, ApJS, 80, 1
- (77)
- (78) Steidel, C.C., Giavalisco, M., Pettini, M., Dickinson, M., & Adelberger, K.L., 1996, ApJ Letters 462, L17
- (79)
- (80) Thompson, D., Djorgovski, S, & Trauger, J., 1995, AJ, 110, 963
- (81)
- (82) Trager, S.C., Faber, S.M.,Dressler, A., & Oemler, A., 1997, ApJ, 485, 92
- (83)
- (84) Vogel, S. & Reimers, D., 1995, A&A, 294, 377
- (85)
- (86) Warren, S.J., Hewett, P.C., & Osmer, P.S., 1994, ApJ, 421, 412
- (87)
- (88) Wainscoat, R.J. & Cowie, L.L., 1992, AJ, 103, 332
- (89)
- (90) Yee, H.K.C., Ellingson, E., Bechtold, R.G., Carlberg,R.G., Cuillandre, J.-C., 1996, AJ111, 1783
- (91)
- (92) York,D.G., Yanny,B., Crotts,A., Carilli,C., & Garrison,E., 1991, MNRAS, 250, 24
- (93)
| Filter | central ( m) | (%)aa is defined to be the FWHM of the filter tracing. | z for H bbThe filter admits a range of z, corresponding to the redshifted FWHM limits | 1/(T:K′) ccThe transmission relative to K′ |
|---|---|---|---|---|
| H2(1–0) | 2.12 | 1.1 | 2.23 | 40 |
| Br | 2.16 | 1.0 | 2.29 | 24.0 |
| H2(2–1) | 2.24 | 1.0 | 2.41 | 40 |
| K continuum | 2.26 | 2.3 | 2.44 | 7.5 |
| CO(2–0) | 2.30 | 1.2 | 2.50 | 19.0 |
| Field | z | type | date | |||||||
|---|---|---|---|---|---|---|---|---|---|---|
| LBQS 0059-0207 | 2.300 | R.Q. | 10/12/95 | 1080 | 4320 | |||||
| Q 0114-089 | 2.2995 | CIV hhSargent, Boksenberg, & Steidel, 1988 | 01/15/98 | 1620 | 4320 | |||||
| Q 0149+335 | 2.431 | R.L. | 07/18/94 | 1080 | 2070 | |||||
| Q0153+045 (NW) | 2.4243 | CIV aaSargent, Steidel, & Boksenberg, 1989 | 01/02/96 | 1080 | 4050 | |||||
| Q0153+045 (center) | 2.423 | CIV | 11/18/96 | 1620 | 4860 | |||||
| Q0201+365 | 2.460,2.4241 | CIV,SiII,FeII,AlIIIaaSargent, Steidel, & Boksenberg, 1989 | 10/13/95 | 1620 | 5400 | |||||
| Q0216+080 | 2.2931 | CIV aaSargent, Steidel, & Boksenberg, 1989 | 07/18/94 | 540 | 2400 | |||||
| G0727+4056 | 2.500 | R.L. bbOwen, Ledlow, & Keel, 1995 | 11/18/96 | 1620 | 6480 | |||||
| SBS0747+611 | 2.487,2.4865 | assoc. ccSteidel & Sargent, 1992 | 01/02/96 | 1080 | 4320 | |||||
| Q0846+156 | 2.28 | CIV aaSargent, Steidel, & Boksenberg, 1989 | 01/13/95 | 2160 | 6480 | |||||
| SBS0953+549 (SE) | 2.50 | CII,NV ddLevshakov, 1992 | 01/13/95 | 1620 | 3600 | |||||
| SBS0953+549 (SE) | 2.449 | OVI,SiIII | 01/13/95 | 1620 | 2700 | |||||
| SBS0953+549 (NW) | 2.50 | CII,NV | 01/02/96 | 540 | 3120 | |||||
| SBS0953+549 (SW) | 2.50 | CII,NV | 11/18/96 | 1080 | 4320 | |||||
| SBS0953+549 (NE) | 2.50 | CII,NV | 01/14/98 | 1980 | 6480 | |||||
| SBS0953+549 (SSE) | 2.50 | CII,NV | 01/14-15/98 | 1380 | 6960 | |||||
| SBS0953+549 (EE) | 2.50 | CII,NV | 01/15/98 | 1680 | 6240 | |||||
| SBS0953+549 (WW) | 2.50 | CII,NV | 01/15/98 | 1200 | 6000 | |||||
| LBQS 1240+1516 | 2.297 | R.Q. | 3/25/97 | 1620 | 2160 | |||||
| [CCSS 1332+261] | 2.498 | CIV ggJunkkarinen, Hewitt ,& Burbidge, 1991 | 3/25/97 | 1620 | 4320 | |||||
| SP89 1442+295 | 2.439 | CIV,CII,OI eeCarballo, Barcons, & Webb, 1995 | 06/27/96 | 1080 | 4650 Q1623+268 | 2.490 | R.Q. | 06/28/96 | 1620 | 6480 |
| HS 1700+6416 | 2.290,2.308 | OIII,CII ffVogel & Reimers, 1995 | 06/27/96 | 1440 | 4320 | |||||
| Q1726+344 | 2.2992 | HI ggJunkkarinen, Hewitt ,& Burbidge, 1991 | 06/28/96 | 1620 | 3600 | |||||
| PC 2149+0221 | 2.304 | R.Q. | 10/13/95 | 1080 | 4320 | |||||
| Q 2233+131 | 2.4915 | CIV aaSargent, Steidel, & Boksenberg, 1989 | 07/16/94 | 630 | 1440 | |||||
| Q2343+125 | 2.4285,2.4308 | CIV,AlII,FeII,SiII hhSargent, Boksenberg, & Steidel, 1988 | 07/19/94 | 540 | 1400 | |||||
| Q2344+125 | 2.4265,2.4292,2.4371 | CIV hhSargent, Boksenberg, & Steidel, 1988 | 06/27-28/96 | 2160 | 5400 | |||||
| Q2348-011 | 2.4272 | DLA aaSargent, Steidel, & Boksenberg, 1989 | 11/18/96 | 1440 | 4860 | |||||
| Q2349+002 (NE) | 2.495 | R.Q | 10/12-13/95 | 1620 | 4320 |
Note. — R.L. = emission redshift of Radio Loud QSO; R.Q. = emission z of Radio Quiet QSO
| Object | m | Line | E.W. | K′ | H | J | I | V | B |
|---|---|---|---|---|---|---|---|---|---|
| Fluxaa10-17ergs/cm2/s | (rest Å) | ||||||||
| Q0114 A | 0.27 | 249 | 29 | 15.42 | 19.8aa10-17ergs/cm2/s | ||||
| Q0114 B | 1.0 | 15.4 | 151 | 20.3 | |||||
| Q0153+045 A | 0.8 | 6 | 126 | 21.1 | 24.9 | ||||
| Q0846+156 A | 1.4 | 5 | 264 | 22.1 | |||||
| SBS0953+549 A | 1.0 | 25 | 119 | 19.7 | 20.5 | 21.7 | 23.7 | 24.57 | 24.7 |
| SBS0953+549 B | 2.4 | 26 | 639 | 21.55 | :22 | 23.09 | 24.53 | 25.2 | 24.8 |
| SBS0953+549 C | 1.7 | 8.6 | 298 | 21.76 | :22 | 22.35 | 24.04 | 24.65 | 25.2 |
| SBS0953+549 D | 1.7 | 14.4 | 360 | 21.33 | 23.5 | 24.16 | 24.8 | ||
| SBS0953+549 E | 1.4 | 9.2 | 250 | 21.42 | 25.08 | 25.46 | 26.2 | ||
| SBS0953+549 F | 0.5 | 13.9 | 54 | 19.34 | 24.47 | 25.83 | :27 | ||
| HS 1700+6416 A | 0.5 | 8.3 | 58 | 19.9 | 21.6 | ||||
| HS 1700+6416 B | 0.75 | 8.9 | 100 | 20.4 | 23.8 | ||||
| PC 2149+0221 A | 0.9 | 580.5 | 85 | 18.15 | 18.4 | 19.00 |
| QSO | z | optical magnitude aafrom the NED catalog (see references therein) | K′ |
|---|---|---|---|
| LBQS 0059-0207 | 2.300 | 18.40 | 15.00 |
| Q 0114-089 | 3.157 | 17.4 | 15.4 |
| Q 0149+335 | 2.431 | 18.5 | 15.98 |
| Q0153+045 | 2.991 | 18.8 | 15.26 |
| Q0201+365 | 2.912 | 17.5 | 16.13 |
| Q0216+080 | 2.991 | 18.1 | 15.52 |
| SBS0747+611 | 2.487 | 17.5 | 15.29 |
| Q0846+156 | 2.928 | 18.3 | 15.63 |
| SBS0953+549 | 2.584 | 17.5 | 15.30 |
| LBQS 1240+1516 | 2.297 | 18.3 | 16.23 |
| [CCSS 1332+261] | 2.503 | 18.6 | 15.4 |
| SP89 1442+295 | 2.638 | 17 | 14.00 |
| Q1623+268 | 2.490 | 18 | 16.34 |
| HS 1700+6416 | 2.722 | 16.1 | 14.05 |
| Q1726+344 | 2.430 | 18.5 | 16.18 |
| PC 2149+0221 | 2.304 | 18.39 | 16.64 |
| Q 2233+131 | 3.274 | 18.8 | 15.66 |
| Q2343+125 | 2.515 | 13.37 | |
| Q2344+125 | 2.763 | 18.0 | |
| Q2348-011 | 3.014 | 18.0 | 16.32 |
| Q2349+002 | 2.495 | 19.90 | 15.0 |