QSO clustering and the AAT 2dF QSO redshift survey
1 Introduction
The study of QSO clustering from large homogeneous surveys is likely to provide unique information on the nature of large-scale structure (LSS) in the Universe. Even with relatively modest aperture telescopes, QSOs are readily detectable from the present cosmic epoch to a time when the Universe was less than 25% of its present age. This approximately eight billion year time interval provides a unique baseline over which to study the evolution of structure in the Universe with cosmic time. QSO clustering also yields a direct measure of clustering on comoving scales h-1Mpc∗*∗*Throughout this paper we use comoving distances, , and define the Hubble constant as h km s-1Mpc-1, providing key information (see figure 1) on LSS at scales between those provided by the COBE results (h-1Mpc, Bennett et al. 1994) and galaxy redshift surveys (h-1Mpc, Colless et al., this volume)

To date, QSO clustering has remained largely unexploited for LSS studies. This has largely been due to the lack of appropriate QSO catalogues. Although over 10000 QSOs with measured redshifts are now known (Véron & Véron-Cetty 1997, see figure 2) less than % of these QSOs form part of homogeneous catalogues suitable for detailed clustering analysis. The goal of the 2dF QSO redshift survey, currently underway at the Anglo-Australian Telescope (AAT), is to provide a new homogeneous catalogue of almost 30000 QSOs with which to carry out such an analysis. The survey is almost two orders of magnitude larger than the previous largest homogeneous survey to this depth (Boyle et al. 1990).
In § 2 we review the existing results on QSO clustering and we describe the creation of the 2dF QSO redshift survey input catalogue in § 3. We report on the initial results from the survey in § 4 and discuss the future prospects for this and other QSO surveys in § 5.
2 QSO Clustering
a QSO-QSO clustering
First attempts to detect QSO clustering from samples of QSOs yielded no significant detections of QSO clustering on any scale up to 1500h-1Mpc (see e.g. Osmer 1981). Nevertheless, a number of studies (Osmer 1981, Webster 1982) did comment on the possibly genuine nature of specific clusters of QSOs at intermediate scales h-1Mpc. The first positive detection of clustering amongst QSOs at small scales (h-1Mpc) was made by Shaver (1984) using an earlier version of the heterogeneous Véron & Véron-Cetty (1997) catalogue, which then comprised 2000 QSOs. This was followed by similar results based on more homogeneous QSO catalogues, comprising a few hundred QSOs (Shanks, Boyle & Peterson 1988, Iovino & Shaver 1988). The strength of QSO clustering in these studies was found to be similar to that of galaxies at the present day, with the two-point QSO auto-correlation function, , fitted by a power law with a scale length h-1Mpc. None of these early QSO clustering studies found any significant QSO clustering on scales h-1Mpc.
Suitable QSO sample sizes have only increased slowly over the past ten years, and latest analyses of QSO clustering (see e.g. Shanks & Croom 1996) still rely on a compilation of a few homogeneous catalogues (Durham/AAT: Boyle et al. 1990, CFHT: Crampton et al. 1989, LBQS: Hewett et al. 1995) comprising less than 2000 QSOs in total.

Using the Durham/AAT, CFHT and LBQS catalogues, Croom & Shanks (1996) demonstrated that QSO auto-correlation function at scales less than h-1Mpc was best-fit by , with h-1Mpc (figure 3). Croom & Shanks (1996) also found no evidence for any evolution in the strength of clustering with redshift. By investigating the predications of a standard biasing model, they were able to demonstrate that the low values of obtained for Seyfert galaxies (Boyle & Mo 1993) and IRAS-selected AGN (Georgantopoulos & Shanks 1994) favoured either a low universe, , with low values for the galaxy bias parameter () or an universe with a higher bias parameter (). On the basis of this model, Croom & Shanks were also able to rule out a universe with , at the level.
These results on the evolution of the QSO correlation function are, however, contested by other authors. In their earlier analysis, Iovino & Shaver (1988) found that the correlation length decreased towards high redshift, while more recently La Franca et al. (1997) claim to see an increase in the QSO correlation length with redshift, with h-1Mpc for QSOs and h-1Mpc for QSOs.
The lack of agreement between these results serves to underline the poor statistics on which the detection of QSO clustering at small scales is currently based. There are less than 40 pairs of QSOs with comoving separations h-1Mpc identified in such clustering studies, even when averaged over the full range in redshift .
At intermediate scales, h-1Mpch-1Mpc, there have been a number of claims for marginal () detections of features in the QSO auto-correlation function. However, none of these has stood up to critical examination with larger data-sets (see Croom & Shanks 1996). At these scales, the growth of LSS largely follows linear theory and thus features in at these comoving separations should not change comoving scale as a function of redshift. If detected, such features would therefore provide a useful cosmological ‘standard rod’ with which to measure the deceleration parameter or the cosmological constant .
Croom and Shanks (1996) also compared in the h-1Mpc region with an extrapolation of the CDM power spectrum normalised by the COBE data. This directly compares the fluctuations in the QSO distribution with those in the mass distribution and is thus a potentially powerful way to measure directly the QSO bias parameter. For a standard CDM model with , they obtained a QSO bias of . For a CDM model with a cosmological constant (, , h), they obtained .
The inconsistency between the small scale results, which favour a high bias for , and the COBE comparison, which favour a low bias for , could be taken to mean that a low value for may be more appropriate. However, the errors are still large, and it will take surveys such as the 2dF QSO survey to reduce them to the point where more effective discrimination between these models is possible.
Phillips et al. (1996) and Ballinger et al. (1997) have also developed a potentially useful geometric test which may be employed at these scales to place limits on the value of . The test relies of the fact that, on average, QSO clusters should be spherically symmetric i.e. with as large an extent along the line of sight as transverse to it. Since has a different effect on these two distances, clusters will appear to be spherically symmetric only when the correct value of is used. Ballinger et al. (1996) demonstrated that the 2dF QSO redshift survey would indeed be able to measure this effect, although effects such as redshift-space distortions serve to weaken the signal and complicate the analysis.
At the largest scales, all measures of the correlation function give a signal consistent with zero clustering. At comoving separations greater than 100h-1Mpc Croom & Shanks (1996) find . Isolated examples of QSO ‘superclusters’ with dimensions h-1Mpc have previously been identified (Crampton et al. 1991, Clowes & Campusano 1993), but it is unclear how representative they are of the QSO population as a whole.
b QSO-galaxy clustering
A limiting factor in the study of LSS with QSOs is the unknown bias factor which exists between the QSO population and the underlying mass distribution. Studies of the galaxy clustering around QSOs provide a useful constraint on the relationship between the QSO and galaxy bias.
The study of the galaxy environment around QSOs was first put on a sound statistical footing by Stockton (1982) and later developed by Yee and his co-workers in a series of papers, see Ellingson et al. (1991) and references therein.
The work of Ellingson et al. (1991) largely focussed on radio-loud QSOs, and demonstrated that their galaxy environment undergoes a dramatic increase in richness from low redshifts to intermediate redshifts, corresponding to an evolution in the galaxy clustering scale length around QSOs from h-1Mpc (consistent with field galaxies) at to h-1Mpc (similar to Abell richness class 1) at . Evidence for similar levels of strong galaxy clustering around radio-loud QSOs at yet higher redshifts () have been found by Tyson (1986) and Hintzen et al. (1991).


In contrast, the environments of the vast majority of QSOs which are radio-quiet appear to significantly poorer. Smith et al. (1996) demonstrated that the QSO-galaxy cross-correlation function for a sample of over 100 X-ray selected radio-quiet AGN at from the Einstein Medium Sensitivity Survey was identical to the galaxy auto-correlation function over a similar range in redshift.
Smith (1998) has now extended this analysis to higher redshift QSOs in the same X-ray selected sample, finding evidence for the evolution in the QSO-galaxy cross-correlation function in the opposite sense to that witnessed for radio-loud QSOs. The QSO-galaxy scale length decreases from h-1Mpc at to h-1Mpc in the redshift range (figure 4). The inferred evolution of the QSO-galaxy cross-correlation function may be expressed in the form , with , equivalent to the growth of structure predicted by linear theory in an Universe (Peacock 1997).
This evolution is also similar to the evolution of the galaxy scale length as inferred indirectly from the galaxy angular auto-correlation function derived from deep imaging surveys (see Efstathiou 1995) and measured directly from deep redshift surveys (Le Fèvre et al. 1996).
Based on these results we can infer that radio-loud and radio-quiet QSOs inhabit different galaxy environments, probably indicative of different levels of bias between the two populations. This is further borne out by the QSO correlation length (h-1Mpc) inferred from two-dimensional radio-source catalogues (Loan et al. 1997). This level of clustering is more consistent with recent estimates of the galaxy cluster correlation length (h-1Mpc, Dalton et al. 1994). However, the extent to which the radio-quiet QSO population is representative of the galaxy population will probably only be answered by detailed redshift-dependent QSOs clustering studies in the 2dF QSO redshift survey.
3 The 2dF input catalogue
a Creation
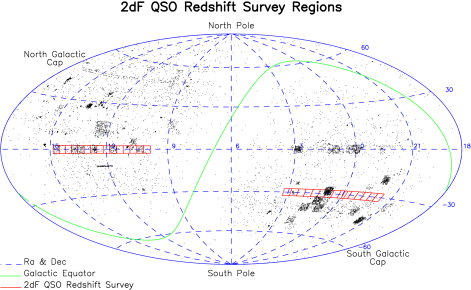
The identification of the QSO candidates for the 2dF redshift survey was based on broadband colour selection from APM measurements of UK Schmidt (UKST) photographic plates. The survey area comprises 30 UKST fields, arranged in two declination strips centred on and (see figure 5). The strip extends from to and the equatorial strip from to . The total survey area is deg2, when allowance is made for regions of sky excised around bright stars, and is a subset of the survey area for the 2dF galaxy redshift survey.

In each UKST field APM measurements of one plate, one plate and up to four plates/films were used to generate a catalogue of stellar objects with . A sophisticated procedure was devised to ensure catalogue homogeneity across plate boundaries (Smith 1998). The criteria for inclusion in the catalogue were ; ; . The full -selected catalogue is shown in figure 5. Based on the colours of QSOs which have previously been identified in the survey region, we estimate the catalogue is % complete for QSOs and comprises over 55% QSOs (see Croom 1997). Preliminary indications from the 2dF survey confirm this QSO fraction, with the principal contamination arising from galactic subdwarfs and compact blue galaxies.
b Results

Smith (1998) has measured the angular auto-correlation function, from the 2dF QSO input catalogue. To minimise the contamination from sources other than QSOs, Smith (1998) restricted the auto-correlation analysis to objects in the input catalogue with . Based on the derived contamination rates, this restricted sample comprises almost 80% QSOs.
The angular auto-correlation function derived by Smith (1998) is plotted in figure 6. Smith (1998) reports a 3 detection of clustering consistent with a scale length of h-1Mpc, assuming the scale length of the QSO correlation remains constant in comoving space as a function of redshift. This is the first detection of QSO clustering on the plane of the sky from an optically-selected catalogue and the amplitude is consistent with the scale length of QSO clustering previously derived from spatial clustering studies. It is inconsistent with the much greater scale length of h-1Mpc inferred for radio-loud QSOs by Yee & Green (1987).
At angular scales which are multiples of the mean field-to-field separation, and , does show systematic deviations from zero amplitude. Although these deviations are small () they may represent the fundamental limit of the accuracy to which large-scale structure can be measured at scales h-1Mpc (the comoving separation corresponding to at ).
4 The 2dF QSO redshift survey
2dF spectroscopic observations for the QSO redshift survey began in January 1997, although the bulk of the redshifts have been obtained in the October 1997 and January 1998 observing runs as the 2dF system has gained functionality (increased number of fibres, faster field re-configuration times). Over 1000 QSO redshifts have been obtained with the 2dF, and the 2dF QSO redshift survey is already the largest single homogeneous QSO catalogue in existence. Initial results from this survey are shown in figures 7–10.


Figure 7 shows the number-redshift, , relation for the sample. The shows a broad flat distribution, with no obvious redshift peaks or troughs due to selection biases. The auto-correlation function plotted in figure 8 is consistent with the form previously derived by Croom & Shanks (1996); . Although the error bars are still large, there is still no strong evidence for evolution of the correlation length with redshift (figure 9). The predictions for two linear theory models of structure growth confirm the result of Croom & Shanks (1996) that the lack of evolution favours a low universe in such models.
With 97% of the 2dF QSO redshift survey remaining to be completed, the survey cone diagram plotted in figure 10 is currently rather empty, but it does serve to illustrate the eventual scale of the 2dF QSO redshift survey.
The input catalogue is also useful as a resource for other QSO studies. In a separate project, we have cross-correlated the input catalogue with the NRAO/VLA sky survey (NVSS, Condon et al. 1998), yielding over 600 detections (corresponding to 5% of the QSOs in the input catalogue). Keck spectra have been obtained for almost 100 of these sources, the vast majority of which (%) are QSOs.

We have also begun a more conventional long-slit spectroscopic program to obtain redshifts for all input catalogue pairs with angular separations less than 20 arcsec. Such objects are candidate wide-separation gravitational lenses or binary QSOs. The incidence of wide-separation gravitational lenses can be used to place constraints on the value of the cosmological constant. Following Maoz et al. (1997), Croom (1997) calculates that lensing by ‘typical’ cluster masses (M⊙) would result in between four (, ) and fourteen (, ) -arcsec QSO lenses being seen in the survey. To date, we have surveyed approximately 25% of the catalogue pairs at these separations, and found only one possible lens candidate (figure 11). The two components of the possible lens (Q0101.8–3012A,B) have a separation of arcsec on the sky. At the redshift of the system (), this corresponds to a projected proper spatial separation of 71h-1kpc.
5 Future Prospects
Currently the 2dF QSO redshift survey is only 3% complete. Yet it is already the single largest homogeneous QSO redshift survey yet compiled. Many of the cosmological tests proposed above will become possible when the survey is completed, providing measures of , and as well as new information on the redshift evolution of structure in the Universe and on LSS at scales of many hundreds to thousands of megaparsecs. In addition the catalogue will provide a unique resource for damped Ly systems, and common absorption line systems. It may also prove possible to derive information on the power spectrum of mass fluctuations at through the Ly forest absorption via the method of Croft et al. (1997).
The next decade will see the completion of the 2dF QSO survey together with the Sloan Digital Sky Survey ( QSOs; see Margon, this volume). The LAMOST survey ( QSOs, see Chu & Zhao 1997) is also planned to be well into its operational phase. When QSOs were first discovered, the hope was they they could be used to carry out standard cosmological tests. Now, almost forty years on, with the advent of these new surveys, this goal may finally be realised.
References
- 1
- 2 Ballinger, W.E., Peacock, J.A. & Heavens, A.F., 1996, MNRAS, 282, 877–888
- 3 Bennett, C.L., et al., 1994, ApJ, 436, 423–442
- 4 Boyle, B.J., Fong, R., Shanks, T. & Peterson, B.A., 1990, MNRAS, 243, 1–56
- 5 Boyle, B.J & Mo, H.J., 1993, MNRAS, 260, 925–928
- 6 Clowes, R.G. & Campusano, L.E., 1994, MNRAS, 266, 317–336
- 7 Chu, Y. & Zhao, Y.-H., 1997, In New Horizons from Multi-Wavelength Surveys, (eds B.J.MacLean et al.), Dordrecht: Kluwer, 131–134
- 8 Condon, J.J., Cotton, E.W., Yin, Q.F., Perley, R.A., Taylor G.B. & Broderick J.J., 1998, AJ, in press
- 9 Crampton, D., Cowley, A.P. & Hartwick, F.D.A., 1989, ApJ, 349, 59–71
- 10 Croft, R.A, Weinberg, D.H., Katz, N. & Hernquist, L., 1998, ApJ, 495, 44
- 11 Croom, S.M., 1997, PhD Thesis, University of Durham
- 12 Croom, S.M. & Shanks, T., 1996, MNRAS, 281, 893–906
- 13 Dalton, G.B., Croft, R.A.C., Efstathiou, G., Sutherland, W.J., Maddox, S.J. & Davis, M., 1994, MNRAS, 271, 47P–51P
- 14 Efstathiou, G., 1995, MNRAS, 272, 25P–30P
- 15 Ellingson, E., Yee, H.K.C. & Green, R.F., 1991, ApJ, 371, 49–59
- 16 Georgantopoulos, I. & Shanks, T., 1994, MNRAS, 271, 773–780
- 17 Hewett, P.C., Foltz, C.B. & Chaffee, F.H., 1995, AJ, 109, 1498–1521
- 18 Hintzen, P., Romanshin, W. & Valdes, F., 1991, ApJ, 366, 7–15
- 19 Iovino A. & Shaver P.A., 1988, ApJL, 330, 13–16
- 20 La Franca, F., Andreani, P. & Cristiani S., 1998, ApJ, 497, 529
- 21 Le Fèvre, O., Hudon, D., Lilly, S.J. & Crampton, D., 1996, ApJ, 461, 534–545
- 22 Loan, A.J., Wall, J.V. & Lahav, O., 1997, MNRAS, 286, 994–1002
- 23 Maoz, D., Rix, H.-W., Gal-Yam, A. & Gould, A., 1997, ApJ, 486, 75–84
- 24 Osmer, P.S., 1981, ApJ, 247, 762–773
- 25 Peacock, J.A., 1997, MNRAS, 284, 885–898
- 26 Phillipps, S. 1996, Ap&SS, 240, 241–247
- 27 Shanks, T. & Boyle, B.J., 1994, MNRAS, 271, 753–772
- 28 Shaver, P.A., 1984, A&A, 136, L9–L10
- 29 Smith, R.J., 1998, PhD Thesis, University of Cambridge
- 30 Smith, R.J., Boyle, B.J. & Maddox, S.J., 1995, MNRAS, 277, 270–286
- 31 Stockton, A., 1982, ApJ, 257, 33–39
- 32 Tyson, J.A., 1986, AJ, 92, 691–699
- 33 Véron, P. & Véron-Cetty, M.P., 1997, Quasars and Active Galactic Nuclei (7th Edition), ESO Scientific Report.
- 34 Webster, A., 1982, MNRAS, 199, 683–705
- 35 Yee, H.K.C. & Green, R.F., 1987, ApJ, 319, 28–43