Infrared emission-line galaxies associated with damped Lyα and strong metal absorber redshifts 111Based on observations collected with the DSAZ telescopes in Calar Alto and ESO telescopes in La Silla
Abstract
Eighteen candidates for emission line galaxies were discovered in a narrow-band infrared survey that targeted the redshifts of damped Lyα or metal lines in the spectra of quasars. The presence of emission lines is inferred from the photometric magnitudes in narrow and broad band interference filters, corresponding to Hα at redshifts of 0.89 (6 objects) and 2.4 (10 objects), and [OII]3727 at a redshift of 2.3 (2 objects). Most of the candidates are small resolved objects, compatible with galaxies at the redshifts of the absorbers. Because a similar survey targeted at the redshifts of quasars themselves uncovered only one emission-line galaxy in a larger volume, the results imply substantial clustering of young galaxies or formation within filaments or sheets whose locations are indicated by the redshifts of absorption along the lines of sight to more distant quasars.
1 Introduction
Exploration of the high redshift universe and discovery of the most distant objects is still in its infancy. Only recently have the tools been available to detect normal galaxies at redshifts larger than one, when the first galaxies were created (Pascarelle, Windhorst, & Odewahn (1996); Hu & McMahon (1996); Cowie & Hu (1998); Steidel et al. (1996)). It seems likely that young galaxies will have a variety of different signatures so that it will be necessary to use several diverse techniques to uncover all of them: searches at optical, infrared, x-ray, and radio wavelengths, for example. In particular, basing the statistical studies of the high redshift galaxies only on objects detected in the rest-frame UV could miss many young galaxies (Franceschini et al. (1998); Guiderdoni et al. (1997)), and sampling longer wavelength ranges is necessary.
We carried out a survey for infrared emission-line galaxies by imaging through narrow () and broad band filters between 1 and 2.5 m, identifying objects that appeared brighter in the narrow filters ((Thompson, Mannucci, & Beckwith, 1996, hereafter TMB96)). Our first survey was designed to uncover emission lines at the redshifts of quasars within each survey field, in case there is substantial clustering marked by quasars. In an area of 276 □′, only one emission-line galaxy was discovered (Beckwith et al. (1998)). The surface density of such objects implied by these results is similar to that inferred from other surveys (Cowie et al. (1994); Graham & Dey (1996); Malkan, Teplitz, & McLean (1996); Bechtold et al. (1997)) and suggests that the infrared emission-line galaxies constitute at most a modest population of young galaxies at high redshift.
Using the same instruments, we undertook a second infrared survey for emission-line galaxies targeted at the redshifts of damped Lyα or metal absorption lines in the spectra of quasars. Damped Lyα absorbers are thought to contain as much baryonic matter as seen in all spiral galaxies today (Wolfe et al. (1986)) and may, therefore, mark sites of ongoing star formation. Several other groups (Lowenthal et al. (1991); Macchetto et al. (1993); Wolfe et al. (1992); Møller & Warren (1993); Djorgovski et al. (1996); Francis, Woodgate, & Danks (1997)) carried out similar surveys at optical wavelengths looking for Lyα emission-line galaxies in these regions. They discovered only a few such emission-line (non-AGN) galaxies, but Wolfe (1993) showed that the implied volume density was significantly higher than in the general field. Metal absorption systems also indicate that star formation has taken place, and are identifiable from the ground at lower redshifts than Lyα alone.
We selected damped Lyα systems or metal absorbers whose redshifts put the main optical lines Hα, Hβ, [OIII], and [OII] into standard narrow-band filters in the J, H and K bands. The resulting redshift ranges are: , and . Special emphasis was given to the Hα line expected to be the brightest in young star systems and the least affected by dust. This letter describes the results of the new survey.
2 Observations
As described in TMB96, pairs of narrow and broad-band images were taken of the selected fields. Most of the data, 163 □′ in 13 fields, were obtained at the Calar Alto 3.5m telescope, using the NICMOS3 2562 MAGIC cameras (Herbst et al. (1993)) with a resolution of 081 per pixel. One field, 38.6 □′, was obtained at the same telescope with the Omega Prime camera using a 10242, HgCdTe Hawaii array with 040 per pixel. Five more fields for a total of 26.2 □′ were observed with the IRAC2b camera at the 2.2m ESO/MPI telescope at La Silla. The area-weighted average limiting flux is 2.4 erg cm-2 sec-1, or 1.6 erg cm-2 sec-1, if only the Calar Alto data are considered. The comoving volume sampled by this survey at the redshift of the absorbers is about 20,600 Mpc3, assuming only the target line at the appropriate redshift could be detected. Considering all the four principal optical lines [OII], Hβ , [OIII] and Hα , the total sampled volume is 90,000 Mpc3 (, , assumed throughout this paper). For comparison, the total sampled volume by the first survey targeting quasars redshifts is 153,000 Mpc3.
3 Results
Objects were selected if well detected in the narrow-band images, with narrow-band magnitudes exceeding the broad-band magnitudes by more than 2.5 standard deviations of the combined uncertainties in the two filters, and with derived line equivalent width larger than 50 Å. These criteria are easily checked by plotting objects in a color-magnitude diagram, where the color is the broad minus narrow band magnitude. Figure 1 is a color-magnitude diagram of the Q0100+130 (PHL 957) field showing the detection of two candidates discovered in the J band. The candidates, denoted A & B, clearly stand out above the noise at high equivalent width, although A is near the narrow-band limit. This field also contains a Lyα emission-line galaxy discovered by Lowenthal et al. (1991) and subsequentely imaged in the H+[NII] lines at 2.177 m by Bunker et al. (1995). This object is not seen in our image, and its expected [OII]3727 flux (about 0.7 cgs) derived from the H flux by Bunker et al. (1995) is below our detection threshold (about 1.4 cgs). Neither A nor B is seen in the Lowenthal et al. (1991) image, while our candidate A is barely visible on the Bunker et al. (1995) narrow band image, implying faint H emission. Both A and B are visible in their broad band K image, as well, thus supporting the reality of the detections in our survey.
From the color-magnitude diagrams of five of the 19 fields in this survey, we discovered 18 candidates for emission-line galaxies. The emission lines, if spectroscopically confirmed, would correspond to Hα at redshifts of 0.89 (6 objects) and 2.4 (10 objects), or [OII]3727 at a redshift of 2.3 (2 objects). Most of the objects are a few seconds of arc in extent suggesting that they are galaxies at redshifts greater than a few tenths.
Table 1 lists the coordinates of the candidates, their offsets from the quasar, and their morphology as deduced from our images. The angular distances from the quasars are between 9″ and 120″, corresponding to projected distances between 70 kpc and 1 Mpc at the distances to the absorption-line systems. Very few, if any, of these objects could, therefore, be identified with the absorption-line objects, whose typical extents are probably those of galaxies or protogalactic clumps, kpc across (Fukugita, Hogan, & Peebles (1996); Haehnelt, Steinmetz, & Rauch (1996)). However, due to the coarse sampling in our images, no attempt was made yet to subtract a PSF from the QSO image, so objects within a few arcsec from the QSO would not have been easily seen.
Table 2 gives the magnitude, a rank of the significance of the detection, the statistical signal-to-noise ratio of the emission line, and the line flux for each candidate. The final four columns give the line identification, redshift, rest equivalent width, and derived star formation rate (Mannucci & Beckwith (1995); TMB96) assuming the line is at the redshift of the absorption-line. The derived SFRs attribute all of the line emission to HII regions, ignoring any contribution from an active galactic nucleus (AGN), an assumption that may be incorrect in at least some cases (Beckwith et al. (1998)).
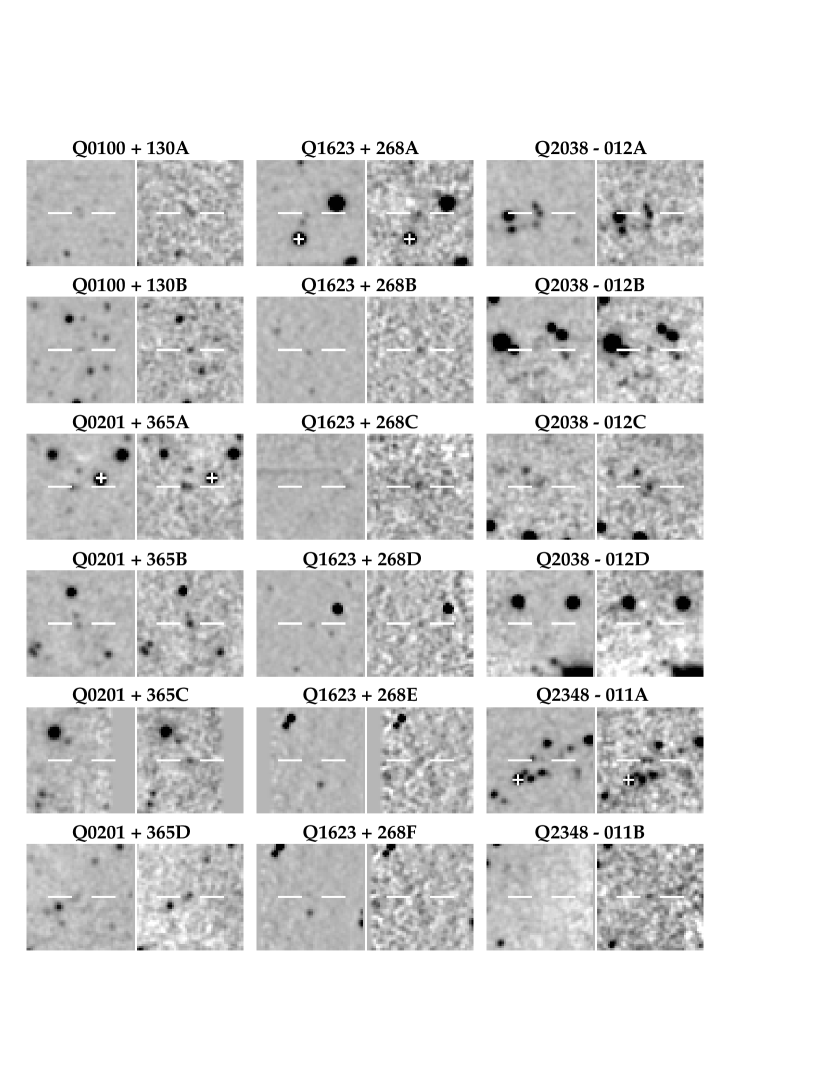
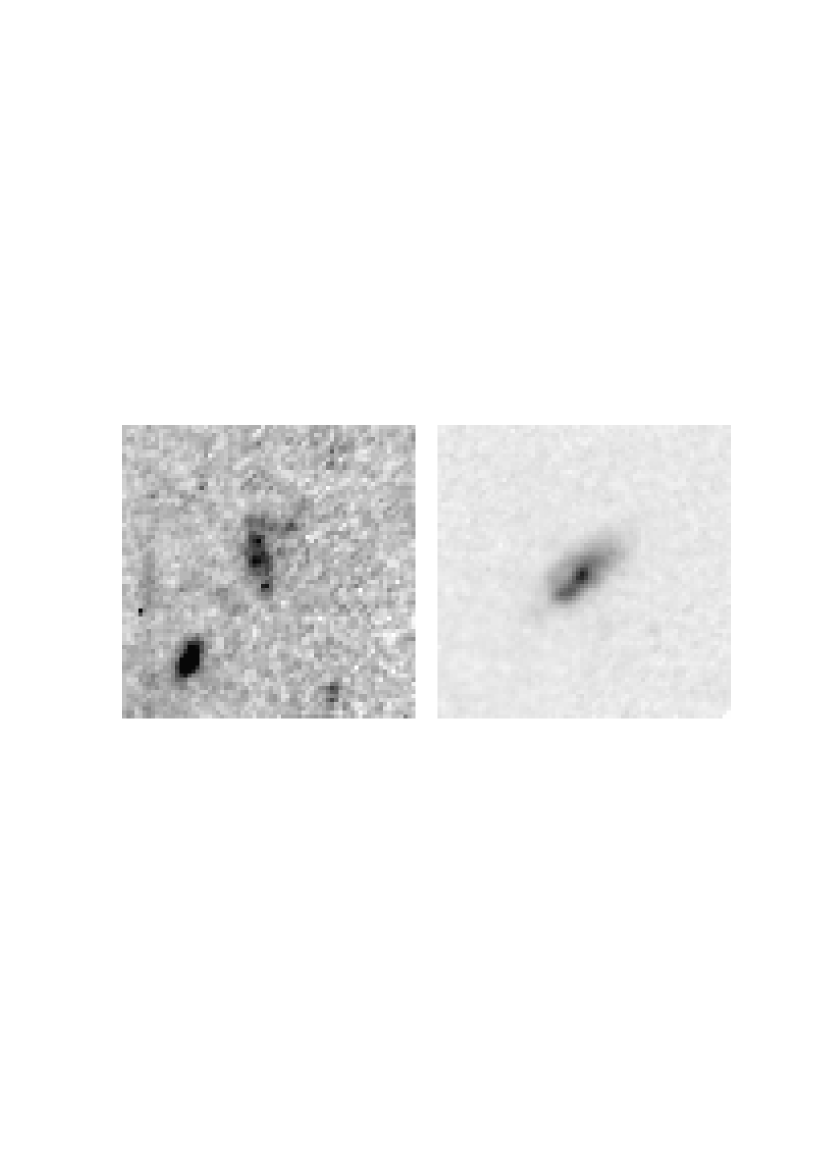
Figure 2 shows images of each candidate in the narrow and broad filters. The typical angular resolution is about 12, corresponding to about kpc for redshifts between 1 and 3. Most of the objects appear resolved even at this resolution. The field around Q1623+268 was observed by Steidel in 1996 May with the Hubble Space Telescope using the WFPC2 camera with the F702W filter and total integration time of 87 min. Two of our emission-line candidates, Q1623+268A and Q1623+268D, appear in these images, parts of which are shown in Figure 3. Both objects appear to be late-type spiral or irregular galaxies. The object sizes are 24 (Q1623+268A) and 36 (Q1623+268D), corresponding to 20 and 30 Kpc for . If these objects are at the assumed redshifts, they are large, well formed galaxies. The detected star formation activity with SFRs between 5 and 10 M⊙/yr would be the normal activity of late-type spiral or irregular galaxies.
4 Discussion
The most striking result of this survey is the large number of candidates discovered in a small area implying that by choosing the right redshift intervals, it is possible to detect emission-line objects rather easily. The total sky coverage in this survey was 228 □′ compared with 276 □′ in TMB96, yet 18 candidates were discovered in the second survey compared to a single emission-line galaxy in the first. Taken at face value, the new results suggest that damped Lyα and metal absorbers pinpoint the regions where galaxy formation is taking place.
Confirmation of the exact nature of these objects will require spectroscopic follow up and perhaps additional imaging with HST. Since not all the objects are resolved at the coarse pixel scale used, some could be stars or other nearby objects. A few objects are near the 3 detection limit. Statistical comparison must, therefore, be regarded with some caution until further data are available.
Nevertheless, we believe that the main result of this survey is robust: there are more emission-line galaxies associated with damped Lyα and metal absorber redshifts than with the redshifts of quasars or at arbitrary redshifts. First, the observational method employed was identical to that of TMB96, but the resulting number of candidates is almost 20 times larger. Second, the one candidate, cK39, discovered in the first survey by TMB96 was also coarsely sampled but is, indeed, an emission line galaxy (Beckwith et al. (1998)) spectroscopically confirmed and easily resolved with the Keck telescope. Third, the HST images of two of our least statistically significant candidates show them to be galaxies of exactly the size expected for objects at redshifts greater than a few tenths and with the kind of morphology expected of objects in late stages of assembly.
These results may be compared with similar studies of Lyα emitting galaxies in the neighborhood of damped Lyα absorption line systems. By the number of detected objects (Lowenthal et al. (1991); Wolfe et al. (1992); Macchetto et al. (1993); Møller & Warren (1993); Djorgovski et al. (1996)) and observed fields (Smith et al. (1989); Deharven, Buat, & Bowyer (1990); Lowenthal et al. (1995)) an average comoving density of these systems of about 7 Mpc-3 is derived down to a limiting SFR of about 5 M⊙/yr, assuming case B recombination and no dust. The infrared technique gives similar results, i.e., detections in about 1/4 of the fields and a density of Mpc-3. The range of SFR implied by our observations 6 - 200 M⊙/yr, is somewhat higher than that usually obtained by the optical searches, 5 - 20 M⊙/yr, but not dramatically so. If there is modest local extinction to the star formation regions in high redshift galaxies, optical derived SFRs must be increased by a factors of about 3 to get the true SFR (Pettini et al. (1998)), making their range almost coincident with ours. Our results are perhaps more consistent with the limiting SFR of 30 - 80 M⊙/yr along sightlines toward eight damped Lyα absorbers as derived from redshifted H (Bunker et al. (1998)).
On the other hand, the lines could be produced by active galactic nuclei. There are several good reasons to believe this could be the case for the one emission-line object discovered in the survey of TMB96 (Beckwith et al. (1998)), and that it could be a widespread phenomenon (Francis, Woodgate, & Danks (1997)). If so, the density of such objects in these regions is considerably higher than the cosmic average. The density of known quasars at these redshifts (e.g., Andreani & Cristiani (1992)) implies about quasars per field, meaning that we might be seeing far more AGNs than expected. Although the damped Lyα redshifts mark regions with many galaxies, the nature of each single galaxy will remain a mystery until proper follow up observations will be able to distingish between emission due to star formation and AGNs.
Cold dark matter simulations of early galaxy formation produce
filaments of galaxies (White (1994)) with groups of high redshift
metal and damped Lyα absorbers spanning up to several hundred kpc
(Rauch, Haehnelt, & Steinmetz (1997)). If the damped Lyα absorbers
actually trace the positions of these filaments, then the high
detection rate of emission line galaxies in this survey may support
the overall structure predicted by CDM. This conclusion can be
made quantitative by measuring the average overdensity of objects
near damped Lyα and metal systems with respect to TMB96.
References
- Andreani & Cristiani (1992) Andreani, P., & Cristiani, S. 1992, ApJ, 398, L17
- Bechtold et al. (1997) Bechtold, J., Yee, H. K. C., Elston, R., & Ellingson, E. 1997, ApJ, 477, L29
- Beckwith et al. (1998) Beckwith, S. V. W., Thompson, D. J., Mannucci, F., & Djorgovski, S. G. 1998, ApJ, in press
- Bunker et al. (1995) Bunker, A. J., Warren, S. J., Hewett, P. C., & Clements, D. L. 1995, MNRAS, 273, 513
- Bunker et al. (1998) Bunker, A. J., Warren, S. J., Clements, D. L., Williger, G. M., & Hewett, P. C. 1998, preprint
- Cowie & Hu (1998) Cowie, L. L., & Hu, E. M. 1998, AJ, in press (astro-ph/9801003)
- Cowie et al. (1994) Cowie, L. L., Songaila, A., Hu, E. M., Egami, , Huang, J.-S., Pickles, A. J., Ridgway, S. E., & Wainscoat, R. J. 1994, ApJ, 432, L83
- Deharven, Buat, & Bowyer (1990) Deharveng, J. M., Buat, V., & Bowyer, S. 1990, å, 236, 351
- Djorgovski et al. (1996) Djorgovski, S. G., Pahre, M. A., Bechtold J., & Elston, R. 1996, Nature, 382, 234
- Franceschini et al. (1998) Franceschini, A., Silva, L., Granato, G. L., Bressan, A., Danese, L. 1998, ApJ, in press
- Francis, Woodgate, & Danks (1997) Francis, P. J., Woodgate, B. E., & Danks, A. C. 1997, ApJ, 482, 25
- Fukugita, Hogan, & Peebles (1996) Fukugita, M., Hogan C.J., Peebles P.J.E. 1996, Nature, 381, 489
- Graham & Dey (1996) Graham, J. R., & Dey, A. 1996, ApJ, 471, 720
- Guiderdoni et al. (1997) Guiderdoni, B., Bouchet, F. R., Puget, J.-L., Lagache, G., & Hivon, E. 1997, ”The optically dark side of galaxy formation” Nature, 390, 257
- Haehnelt, Steinmetz, & Rauch (1996) Haehnelt, M.G., Steinmetz, M., & Rauch, M. 1996, ApJ, 465, L95
- Herbst et al. (1993) Herbst, T. M., Beckwith, S. V. W., Birk, Ch., Hippler, S., McCaughrean, M. J., Mannucci, F., & Wolf, J. 1993, in Infrared Detectors and Instrumentation, SPIE Conference 1946, Fowler, A. M. (ed.), p. 605
- Hu & McMahon (1996) Hu, E. M., McMahon, R. G. 1996, Nature, 382, 231
- Lowenthal et al. (1991) Lowenthal, J. D., Hogan, C. J., Green, R. F., Caulet, A., Woodgate, B. E., Brown, L., and Foltz, C. B. 1991, ApJ, 377, L73
- Lowenthal et al. (1995) Lowenthal, J.D. et al., 1995, ApJ, 451, 484
- Macchetto et al. (1993) Macchetto, F., Lipari, S., Giavalisco, M., Turshek, D. A., & Sparks, W. B. 1993, ApJ404, 511
- Malkan, Teplitz, & McLean (1996) Malkan, M. A., Teplitz, H., & McLean, I. S. 1996, ApJ, 468, L9
- Mannucci & Beckwith (1995) Mannucci, F., & Beckwith, S. V. W. 1995. ApJ, 442, 569
- Møller & Warren (1993) Møller, P., & Warren, S. J. 1993, å, 270, 43
- Pascarelle, Windhorst, & Odewahn (1996) Pascarelle, S. M., Windhorst, R. A., & Odewahn, S. C. 1996, Nature, 383, 45
- Pettini et al. (1998) Pettini, M., Steidel, C. C., Adelberger, K. L, Kellogg, M., Dickinson, M., & Giavalisco, M. 1998, astro-ph/9708117
- Rauch, Haehnelt, & Steinmetz (1997) Rauch, M., Haehnelt, M. G., & Steinmetz, M. 1997, ApJ, 481, 624
- Smith et al. (1989) Smith, H. E., Cohen, R. D., Burns, J. E., Moore, D. J., & Uchida, B. A. 1989, ApJ, 347, 87
- Steidel et al. (1996) Steidel, C. C., Giavalisco, M., Pettini, M., Dickinson, M., & Adelberger, K. L. 1996, ApJ, 462, 17
- Thompson, Mannucci, & Beckwith (1996) Thompson, D. J, Mannucci, F., & Beckwith, S. V. W. 1996, AJ, 112, 1794
- White (1994) White, S. D. M. 1994, MPA preprint, # 831.
- Wolfe (1993) Wolfe, A. M. 1993, ApJ, 402, 411
- Wolfe et al. (1992) Wolfe, A. M.,Turnshek, D. A., Lanzetta, K. M., & Oke, J. B. 1992, ApJ, 385, 151
- Wolfe et al. (1986) Wolfe, A. M., Turnshek, D. A., Smith, H. E., & Cohen, R. E. 1986, ApJS, 61, 249
| Object | RA(2000) | DEC(2000) | aaRadial uncertainty in the position | DbbProjected distance and position angle (north to east) from the QSO | P.A.bbProjected distance and position angle (north to east) from the QSO | SizeccObject sizes measured by the FWHM along respectively the major and minor axis of elliptical gaussians fitted to the objects | Shape |
|---|---|---|---|---|---|---|---|
| () | () | (deg.) | () | ||||
| Q0100+130A | 01:03:10.39 | +13 17 03.7 | 1.1 | 48 | 344.3 | 5.41.5 | possibly double |
| Q0100+130B | 01:03:13.30 | +13 16 58.7 | 0.5 | 51 | 35.3 | 1.91.2 | unresolved |
| Q0201+365A | 02:04:56.28 | +36 49 14.9 | 0.5 | 9 | 112.6 | ddnot fitted because of the presence of a nearby object | unresolved |
| Q0201+365B | 02:04:56.86 | +36 50 02.2 | 0.5 | 46 | 18.9 | 1.81.8 | resolved |
| Q0201+365C | 02:04:50.20 | +36 47 47.4 | 0.5 | 112 | 215.6 | 2.41.4 | resolved |
| Q0201+365D | 02:05:01.75 | +36 47 47.0 | 0.5 | 117 | 141.0 | 1.41.2 | core/asymm. halo |
| Q1623+268A | 16:25:48.56 | +26 47 07.9 | 0.5 | 9 | 340.9 | 1.61.0 | resolved |
| Q1623+268B | 16:25:51.30 | +26 47 21.1 | 0.5 | 40 | 56.7 | 3.82.2 | irregular, diffuse |
| Q1623+268C | 16:25:51.62 | +26 48 17.2 | 0.5 | 87 | 25.9 | 2.52.5 | irregular |
| Q1623+268D | 16:25:43.39 | +26 45 40.9 | 0.5 | 106 | 222.8 | 2.91.8 | faint, elongated |
| Q1623+268Eeethe distance between objects is only 4″ (33 Kpc); they could be one galaxy | 16:25:56.69 | +26 46 08.1 | 0.5 | 117 | 115.6 | 1.11.1 | faint, unresolved |
| Q1623+268Feethe distance between objects is only 4″ (33 Kpc); they could be one galaxy | 16:25:56.42 | +26 46 06.1 | 0.5 | 152 | 117.3 | 1.81.0 | core/asymm. halo |
| Q2038012A | 20:40:52.99 | 01 05 29.2 | 0.7 | 25 | 69.6 | 2.51.5 | elongated |
| Q2038012B | 20:40:47.62 | 01 07 15.8 | 0.7 | 113 | 210.0 | 1.51.5 | diffuse |
| Q2038012C | 20:40:53.61 | 01 07 32.6 | 0.7 | 119 | 163.7 | 2.21.2 | irregular |
| Q2038012D | 20:40:57.93 | 01 06 50.8 | 0.7 | 122 | 126.5 | 1.31.2 | unresolved |
| Q2348011A | 23:50:57.29 | 00 52 02.5 | 0.7 | 11 | 225.6 | ddnot fitted because of the presence of a nearby object | unresolved |
| Q2348011B | 23:50:54.64 | 00 52 58.4 | 0.7 | 68 | 315.6 | 1.61.2 | faint, elongated |
| Object | (NB) | NB | BB | RaaR rank degree of significance: 1 is highest, 3 is lowest; was estimated by inspection to take into account systematic uncertainties such as a very bright continuum, proximity to the edge of the field, and proximity of nearby objects making accurate magnitudes difficult to derive | S/N | Line flux | Line | z | EWr | SFR |
|---|---|---|---|---|---|---|---|---|---|---|
| m | (mag) | (mag) | ( cgs) | (Å) | ( M⊙/yr) | |||||
| Q0100+130A | 1.237 | 20.33 | 21.44 | 2 | 3.8 | 1.90.5 | [OII] | 2.31 | 7526 | 19850 |
| Q0100+130B | 1.237 | 19.88 | 20.88 | 2 | 5.6 | 2.70.5 | [OII] | 2.31 | 6314 | 28350 |
| Q0201+365AbbMagnitudes may be affected by nearby objects | 2.248 | 18.45 | 19.37 | 2 | 4.2 | 1.80.4 | Hα | 2.42 | 6520 | 6816 |
| Q0201+365B | 2.248 | 18.55 | 19.62 | 2 | 4.3 | 1.80.4 | Hα | 2.42 | 8827 | 7116 |
| Q0201+365C | 2.248 | 18.92 | 20.78 | 2 | 4.2 | 1.90.4 | Hα | 2.42 | 182 | 58–92 |
| Q0201+365D | 2.248 | 18.71 | 20.12 | 1 | 4.5 | 2.00.4 | Hα | 2.42 | 15862 | 7616 |
| Q1623+268A | 1.237 | 20.47 | 21.35 | 1 | 2.6 | 1.40.6 | Hα | 0.89 | 9149 | 63 |
| Q1623+268B | 1.237 | 19.96 | 20.98 | 2 | 4.5 | 2.50.6 | Hα | 0.89 | 11537 | 103 |
| Q1623+268C | 1.237 | 20.24 | 22.18 | 2 | 4.6 | 2.70.3 | Hα | 0.89 | 248 | 8–14 |
| Q1623+268D | 1.237 | 20.40 | 21.29 | 3 | 2.8 | 1.50.6 | Hα | 0.89 | 9247 | 63 |
| Q1623+268E | 1.237 | 20.42 | 22.18 | 3 | 3.7 | 2.10.6 | Hα | 0.89 | 180 | 6–12 |
| Q1623+268F | 1.237 | 20.50 | 21.40 | 3 | 2.6 | 1.40.6 | Hα | 0.89 | 9451 | 63 |
| Q2038012A | 2.248 | 18.09 | 18.77 | 2 | 3.5 | 1.70.4 | Hα | 2.42 | 3710 | 6816 |
| Q2038012B | 2.248 | 19.01 | 20.73 | 2 | 3.3 | 1.70.4 | Hα | 2.42 | 256170 | 6516 |
| Q2038012C | 2.248 | 18.44 | 19.66 | 1 | 4.5 | 2.30.4 | Hα | 2.42 | 32 | 8816 |
| Q2038012D | 2.248 | 18.90 | 20.84 | 1 | 3.9 | 2.00.4 | Hα | 2.42 | 194 | 60–94 |
| Q2348011AbbMagnitudes may be affected by nearby objects | 2.248 | 18.74 | 20.27 | 2 | 3.0 | 2.00.6 | Hα | 2.43 | 95 | 7821 |
| Q2348011B | 2.248 | 18.81 | 20.79 | 3 | 3.2 | 2.20.6 | Hα | 2.43 | 199 | 63–107 |