Properties of Atomic Gas in Spiral Galaxies
Abstract
Physical properties of the atomic gas in spiral galaxies are briefly considered. Although both Warm (WNM, 104 K) and Cool (CNM, 100 K) atomic phases coexist in many environments, the dominant mass contribution within a galaxy’s star-forming disk (R25) is that of the CNM. Mass fractions of 60 to 90% are found within R25. The CNM is concentrated within moderately opaque filaments with a face-on surface covering factor of about 15%. The kinetic temperature of the CNM increases systematically with galactocentric radius, from some 50 to 200 K, as expected for a radially declining thermal pressure in the galaxy mid-plane. Galaxies of different Hubble type form a nested distribution in TK(R), apparently due to the mean differences in pressure which result from the different stellar and gas surface densities. The opaque CNM disappears abruptly near R25, where the low thermal pressure can no longer support the condensed atomic phase. The CNM is apparently a prerequisite for star formation. Although difficult to prove, all indications are that at least the outer disk and possibly the inter-arm atomic gas are in the form of WNM, which accounts for about 50% of the global total. Median line profiles of the CNM display an extremely narrow line core (FWHM 6 km s-1) together with broad Lorentzian wings (FWHM 30 km s-1). The line core is consistent with only opacity broadening of a thermal profile. The spatial distribution of CNM linewidths is not random, but instead is extremely rich in structure. High linewidths occur in distinct shell-like structures with diameter of 100’s of pc to kpc’s, which show some correlation with diffuse H shells. The primary source of “turbulent” linewidth in the atomic ISM appears to be organized motions due to localized energy injection on a scale of a few 100 pc.
1 A Brief Look at HI Thermodynamics
Over the years a succession of eminent authors has considered the question of which physical processes determine the temperature of neutral atomic gas and which timescales are required to achieve (a local) thermodynamic equilibrium. This began with Field, Goldsmith and Habing (1969) and continued with Draine (1978), Shull and Woods (1985) and most recently Wolfire et al. (1995). While some of the processes involved are quite straightforward, others, like the photoelectric emission from dust grains, have had to be substantially updated to reflect our growing knowledge of the properties and abundance of interstellar dust. The consensus which has emerged is that heating is in fact dominated by the photoelectric heating from small dust grains over a wide range of conditions and environments. Cooling, on the other hand, is regulated primarily by emission in the [CII] 158 m fine structure line at densities in excess of about 1 cm-3 and by Ly emission at lower densities. The relative importance of the various mechanisms is nicely illustrated in Fig. 3 of Wolfire et al. (1995). In the same figure can be seen the characteristic phase diagram for atomic gas. Two thermodynamically stable phases are found. The first is the so-called Warm Neutral Medium (WNM) which predominates at low densities and pressures, and has a kinetic temperature that rises toward lower pressures from a value of perhaps 5000 K to 104 K, with an accompanying increase in ionization fraction, 0.1 to 0.9. The second is the Cool Neutral Medium (CNM) which is primarily found at high densities and pressures, with a kinetic temperature that decreases towards higher pressures from a value of some 200 K to perhaps as low as 20 K. Over some range of intermediate pressures thought to be typical of the interstellar medium in the local neighbourhood of the Galaxy (P/k 2000 K cm-3), the two phases can coexist in pressure equilibrium. However, given the strong gradient in the mid-plane thermal pressure which is likely to follow from the combination of a radial exponential stellar disk and a similarly declining gas surface density distribution, we can safely predict that the inner regions of disk galaxies will have predominantly rather cool CNM, while the outer regions of galaxies will eventually be dominated by the WNM. At intermediate radii we might also expect to see a radial increase in the CNM kinetic temperature in response to the declining mid-plane pressure.
2 The CNM – WNM Phase Balance
The phase balance of cool and warm neutral gas can be probed by obtaining coupled observations of the HI emission and absorption along the lines-of-sight to appropriate background sources. Observations of the many bright background sources lying near the Galactic plane in projection have provided a very good characterization of the atomic gas properties in the solar neighbourhood. It turns out that there is an excellent correlation between the observed absorption opacity and the emission brightness derived from all of the existing high quality data probing solar neighbourhood atomic gas. The distribution shown in in Fig. 1a (from Braun and Walterbos 1992) is “S-shaped” and is characterized by two asymptotic values. One is the maximum observed brightness = 107 K, where the line opacity becomes effectively infinite. The other, is the minimum observed brightness = 4 K for which vanishingly small opacities are still observed. The simplest physical model which can account for this distribution, is one with a cool component (the CNM) responsible for the majority of both emission and absorption, which is embedded in a widely distributed non-absorbing component (the WNM) that accounts for only a small fraction of the emission linestrength, but does have a substantially wider linewidth.

Although a mean CNM kinetic temperature of about 110 K is indicated for the solar neighbourhood of the Galaxy, it should be stressed that the distribution has a scatter corresponding to about a factor of 2 local variation of the CNM temperature from the mean. This same degree of temperature variation also seems to be indicated on smaller scales, by the detailed differences between individual HI emission and absorption profiles. Rather than being simple mirror images of eachother, as would be the case for a truly isothermal component, the absorption profiles are typically somewhat narrower than the corresponding emission, suggesting somewhat cooler cores within a warmer mantle. Solving for the actual column density ratio of the CNM to WNM in the solar neighbourhood gives a value of about 3:1, which is substantially higher than the value of about 1:1 which has been suggested in the past.
Comparably detailed analysis of the atomic phase balance in external galaxies has proven much more difficult due to the very small number of sufficiently bright background sources located by chance behind the galactic disk. However, the external viewing perspective does provide some advantages. In the case of M31, it reveals a clear distinction between the distributions observed at different galactocentric radii through that system’s disk (Braun and Walterbos 1992, see also Dickey and Brinks 1993). Characteristic CNM kinetic temperatures are observed to vary systematically from about 75 K at 5 kpc radius to 175 K at 15 kpc radius as shown in Fig. 1b. This is in agreement with the expectation noted above to find a positive radial gradient in the CNM kinetic temperature in response to a decrease in the mean mid-plane pressure.
3 The Two Observed Components of HI Emission
A rather striking observational result of recent years is the recognition that there are two observationally distinct components to the HI emission seen from nearby galaxy disks (Braun 1995, 1997). When sufficient physical and velocity resolution (of order 150 pc and 5 km s-1) are employed, the HI distribution is decomposed into: (1) a distinct high brightness network (HBN) of emission features which trace the regions of active star formation and (2) a diffuse component of inter-arm and outer disk gas.
3.1 The High Brightness Network
The observed HI emission brightness temperature of this component varies between about 50 and 200 K. Since and the spin temperature, , is equal to the kinetic temperature under galactic conditions, these values of provide a lower limit to the kinetic temperature of the gas. The visual appearance of this component, in the case of relatively face-on galactic disks, is that of a filamentary network, which is only marginally resolved in its narrow dimension, but is extended over 100’s of pc to kpc’s in its long dimension. In more edge-on systems, the network begins to fill the entire disk as seen in projection.

The best data on the physical extent of this component are those for M31, where a physical resolution as high as 35 pc has been obtained, with simultaneous good sampling of the spatial scales out to many kpc. The amplitude spectrum for the NE major axis region of M31 smoothed to 70 pc resolution is shown in Fig. 2 together with the overlaid functional form of a power law with an index of 1.5 tapered by a 130 pc FWHM Gaussian and added to the measurement noise floor. Both the power law index as well as the characteristic Gaussian FWHM are determined to about 10% precision. The corresponding power law index for a power-, rather than an amplitude spectrum, would be 3.0.
The critical velocity resolution needed to at least marginally resolve HI emission profiles appears to be about 5 km s-1. Velocity smoothing from 5 to 10 km s-1 leads to a mean dilution of the peak intensity of 15% in M31 (Braun 1995), while smoothing from 1 to 5 km s-1 results in a mean peak dilution of only 3% for Galactic emission profiles with a peak brightness in excess of 80 K.


The statistical properties of the HI HBN have been determined for seven of the nearest spiral galaxies which have a moderate inclination (Braun 1997). This component accounts for between 60 and 90% of the integrated HI emission inside of R25 (the radius where the blue optical light reaches a face-on surface brightness of 25 mag arcsec-2) and is concentrated to about 15% of the disk surface area. Beyond R25 this component abruptly disappears. It seems clear that the HBN is a prerequisite for active star formation. These distributions are illustrated in Fig. 3 for M101.
Another striking feature of the HBN, is the non-Gaussian form of the line profiles. High signal-to-noise line profiles generated from median co-aligned spectra within annular bins of galactocentric radius have a very distinctive shape, as seen in Fig. 4a. An extremely narrow line core (with FWHM less than about 6 km s-1) is superposed on much broader line wings with a profile that is well-fit with a Lorentzian with a FWHM of about 30 km s-1. Similar line profiles have been detected in nearby dwarf galaxies by Young and Lo (1997). The narrow line cores provide a strong upper limit to the HBN kinetic temperature of 300 K, while the observed emission brightness provides a direct lower limit of 50 to 200 K. The HBN kinetic temperature is thus very well-constrained, and it allows unambiguous identification of this component with the Cool Neutral Medium of the ISM. A close correspondence of the CNM zone with star formation activity was suggested by Elmegreen and Parravano (1994).


The entire sample of observed nearby galaxies shows the systematic trend for an increasing peak brightness temperature of the CNM with radius, as illustrated in Fig. 5a. Furthermore, the different observed galaxy types form a nested system when plotting peak observed brightness temperature against radius, in the sense that later type spirals are offset to higher peak brightness temperatures at all radii than earlier type spirals.

Fitting of the median line profiles with a simple two component radiative transfer model allows derivation of gas kinetic temperatures and column densities as function of galactocentric radius. Kinetic temperatures closely track the observed brightness temperatures within inner galaxy disks where HI opacties are typically quite high. The kinetic temperature systematically increases to larger radii as shown in Fig. 5b, with a corresponding decline in the HI opacity. Just as we discussed in the preceeding section, the theoretical expectation seems to be borne out, that there is a clear gradient in the CNM kinetic temperature with radius which is very likely tracking the decreasing mid-plane thermal pressure profile of galactic disks.
3.2 The Low Brightness Disk
As outlined above, most of the HI emission within R25 is due to the high brightness filamentary network of the CNM. However, it is still the case that half of the integrated HI emission arises within a diffuse disk component. This is illustrated in Fig. 3b, where the accumulated HI flux is plotted as function of radius for both the HBN (i.e. CNM) component and the total emission. While the HBN abruptly disappears near R25, the total flux still rises by about a factor of two. On average, diffuse HI emission accounts for only 20% of the HI flux, but represents some 85% of the face-on surface area within R25, while outside of R25 it dominates.
Since the diffuse component has an extremely low brightness temperature in emission, it is very difficult to determine it’s properties in detail. Given the typical measurement sensitivity, it is necessary to adopt spatial smoothing to kpc scales to allow direct detection of the emission. With a spatial resolution as coarse as a kpc, kinematic effects begin to have a major influence on the shape of emission line profiles. Such beam smearing substantially complicates the physical interpretation. The cleanest data currently available is that for the diffuse disk of M101 (Fig. 10 of Braun 1997). These line profiles are consistent with a dominant component of WNM with little additional broadening over the thermal linewidth (24 km s-1 FWHM) of a 104 K gas. This consistency does not provide a proof of such an identification, but it does make it plausible.
4 The Origin of HI Linewidth
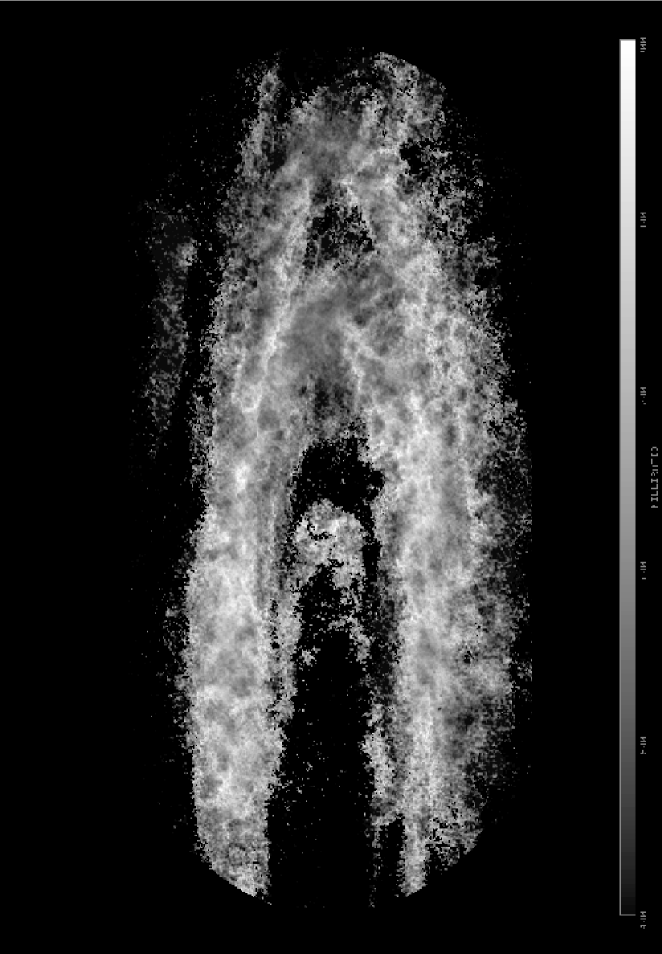
Having provided some background relevant to the physical state of the atomic gas in spiral galaxies, we can turn to an issue which is perhaps more directly related to the topic of this volume, namely, what is the primary mechanism which is responsible for the observed linewidth? In the past, moderate spatial and velocity resolution, of perhaps 1 kpc and 10 km s-1, have typically been employed for HI imaging studies of nearby galaxies. Line profiles were usually fit with a single Gaussian component and the resulting linewidths were averaged over large regions to derive estimates of the velocity dispersion, 8 km s-1 ( = FWHM/2.36), with some indication for an increase at large radii. By obtaining much higher resolution data, especially in a nearby system, it is possible to address the issue of linewidth in considerably more detail. In Fig. 6 we present an image of the HI linewidth in the North-East half of M31. Rather than fitting any assumed functional form to individual spectra, an image was made of the “velocity coherence”, defined as VC, where is the peak brightness observed at a spectral resolution of km s-1. Those lines-of-sight with profiles which are 30 or more km s-1 in width have a value of unity in this image, while the narrowest profiles result in values of VC30km/s 0.4. What is striking in this image is the wealth of structure that is apparent.
High velocity width is not a property which is randomly distributed over a galactic disk. Instead, regions of high velocity width occur in organized structures with a scale-size of some 100’s of pc to kpc’s and which are reminiscent of filamentary cavity walls. Such high linewidth “shells” are quite distinct from quiescent pockets, with similar dimensions, in which the line core is extremely narrow. As we showed previously, (in Fig. 4a) the median line profiles of the CNM can be well modeled with a combination of a purely thermal component (of 80 to 150 K) with only modest broadening by opacity effects, together with broad Lorentzian line wings. Now it becomes clear that even the core and wing components are to some extent structurally distinct.
Further insight into the processes at work comes from considering the relationship between peak line strength and the linewidth. In Fig. 4b we plot these values for a 2.5 kpc square region near the M31 NE major axis crossing at 10 kpc radius. Peak brightnesses at this radius vary by roughly a factor of two, between 80 and 140 K, and occur at the minimum velocity coherence of about VC30km/s = 0.5. This underlines the point made earlier, that at a given galactocentric radius, intrinsic kinetic temperature variations of about a factor of two are present. As the linewidth increases, the peak brightness declines systematically. The distribution has a wedge-like appearance, in which the factor of two (brightness) temperature variation is retained at all linewidths. This is suggestive of a direct correspondence between the linewidth and the HI opacity. Since we expect a typical opacity at this radius in M31 of about unity (much like the Solar Neighbourhood of the Galaxy), a linearly increasing linewidth should yield a linearly decreasing peak emission brightness temperature for a constant gas column density.
Some idea of a possible causal agent for the high linewidth structures comes from the comparison of the image in Fig. 6 with one of H emission. While there is certainly no one-to-one correspondence, there are several notable instances in which diffuse, large diameter H super-shells have high linewidth HI counterparts. In view of the rather short expected lifetimes for H emission due to localized massive star formation (less than about 5 Myr) compared to the timescale for super-shell dissipation in the ISM (more than about 30 Myr) it seems plausible that what we are seeing is the fossil signatures of localized energy injection integrated over the past 50 Myr or so.
Independent of the particular causal agent, it is quite clear that organized motions on 100 to 1000 pc scales play a dominant role in determining the line profile of atomic gas. These motions, together with the purely thermal linewidths of the CNM seem to provide a good description of the star-forming disks of spiral galaxies.
Acknowledgements.
References
- Braun & Walterbos (1992) Braun, R. & Walterbos, R.A.M. 1992 ApJ 386, 120.
- Braun (1995) Braun, R. 1995 A&AS 114, 409.
- Braun (1997) Braun, R. 1997 ApJ 484, 637.
- Dickey & Brinks (1993) Dickey, J.M. & Brinks, E. 1993 ApJ 405, 153.
- Draine (1978) Draine, B. 1997 ApJS 36, 595.
- Elmegreen & Parravano (1994) Elmegreen, B.G. & Parravano, A. 1994 ApJ 435, L121.
- Field, Goldsmith & Habing (1969) Field, G.B., Goldsmith, D.W. & Habing, H.J. 1969 ApJ 155, L149.
- Shull & Woods (1985) Shull, J.M. & Woods, D.T. 1985 ApJ 288, 50.
- Wolfire et al. (1995) Wolfire, M.G., Hollenbach, D., McKee, C.F., Tielens, A.G.G.M. & Bakes, E.L.O. 1995 ApJ 443, 152.
- Young & Lo (1997) Young, L.M. & Lo, K.Y. 1997 ApJ 490, 710.