An investigation of the molecular clouds of the Carina region/molecular cloud complex - First results
Abstract
The Carina Nebula is an extremely bright southern region embedded in a giant molecular cloud and contains some of the most massive stars known in our Galaxy. We are undertaking a multi-wavelength study of the Carina Nebula in order to examine the detailed kinematics and distribution of the molecular and ionised gas, and to look for further evidence of ongoing star formation. Here we present the results of the initial molecular cloud observations which were made by observing the 12CO(1–0) emission with the Mopra antenna. The observations reveal the clumpy morphology of the molecular gas, and allow us to identify many interesting regions for follow-up observations.
1 School of Physics, The University of NSW, Sydney, NSW, 2052, Australia
kbrooks@wodin.phys.unsw.edu.au
2 Australia Telescope National Facility, CSIRO, PO Box 76, Epping, NSW,
2121, Australia
Keywords:
regions — ISM: clouds, kinematics and dynamics — stars: formation
1 Introduction
The Carina region/molecular cloud complex is an excellent region for studying the interaction of massive stars with their parental Giant Molecular Cloud (GMC). The nebula covers an area of 4 deg2 and is bisected by a prominent V-shaped dark lane. There are over 14 star clusters in this region which have been studied extensively over the past twenty years. For excellent reviews see Feinstein (1995) and Walborn (1995). The most influential clusters of the nebula are the two OB clusters, Tr 14 and Tr 16. These clusters contain numerous O-type stars, including three O3 stars each, making them two of the most massive star clusters in our galaxy. Tr 14 is a compact cluster situated to the north-west of the nebula, adjacent to the western dust lane. Tr 16 is an open cluster centred northwards of the vertex of the dark lane. It contains one of the most massive stars known: Car. Here we will adopt the popular view (e.g. Tovmassian 1995, Walborn 1995) that Tr 14 and Tr 16 are at a common distance of about 2.2 kpc and that Tr 14 is younger than Tr 16.
Considering the extensive studies on the stellar content of the Carina Nebula, in particular Car and its surrounding Homunculus nebula, relatively little work has been done on the extended nebula in the last fifteen years. Early radio continuum observations revealed that the nebula contains a large ionised region with two peaks, Car I and Car II (Gardner & Morimoto 1968). Higher resolution radio continuum data show that both Car I and Car II are made up of a number of filamentary arcs and rings and are everywhere thermal (Retallack 1983, Whiteoak 1994). Car II is located to the north of Car and Car I is located towards the western dark lane, just west of Tr 14. The dynamics of the ionised gas in this region have been studied via hydrogen recombination line emission (Gardner et al. 1970, Huchtmeier & Day 1975) and H and [] emission observations (Deharveng & Maucherat 1975). The results show line splitting towards the Car II region which has been interpreted as an expanding shell of ionised gas.
The dark lanes consist of molecular gas and dust that are associated with the nebula (Dickel 1974). H2CO and OH absorption measurements identified two optical depth maxima which were located towards these lanes (Gardner, Dickel & Whiteoak 1970, Dickel & Wall 1974). Extended far-IR emission is confined there also (Harvey Hoffmann & Campbell 1979, Ghosh et al. 1988). There are two main CO emission regions towards the nebula; a northern and southern cloud (de Graauw et al. 1981, Whiteoak & Otrupcek 1984). Both regions are part of a much larger GMC which has a projected length of 130 pc and a mass in excess of 5105 M⊙(Grabelsky et al. 1988). The area between the southern and northern CO clouds is centred on the Keyhole Nebula, a dense dark cloud northwest of Car. Here the molecular gas exists in dense clumps of typical mass 10 M⊙ that are separated both in space and velocity (Cox & Bronfman 1995).
The picture used to describe the Carina complex is one in which the massive star clusters, Tr 14 and Tr 16, are interacting strongly with the molecular cloud from which they formed. It is generally accepted that the photons from Tr 14 and Tr 16 are responsible for the ionised emission of Car I and Car II respectively, and that their strong stellar winds are producing the general expansion of the nebula.
We are undertaking a multi-wavelength study of the Carina Complex in order to study the detailed kinematics and distribution of the molecular and ionised gas and to look for further evidence of ongoing star formation. Here we present the results of initial observations of the 12CO(1–0) emission. CO emission is thermalised in both low- and high-density gas and therefore is suitable for tracing the overall distribution and velocity structure of the molecular cloud. It also can pinpoint any ‘CO hot-spots’. These are warm molecular cores where stars could possibly be forming.
2 Observations
Observations of the 12CO(1–0) transition at 115.271 GHz were made during two periods, 1996 April-October and 1997 April-June, using the Mopra Antenna, operated by the Australia Telescope National Facility, CSIRO. At this frequency the effective diameter of the antenna is 15 m, producing a half-intensity beam width of 43 arcsec. A cryogenic 3-mm SIS receiving system was used, for which a receiver temperature (SSB) of 130 K was assumed for all observations.
Initially observations were made on a 2 arcmin grid covering an area of 1.52 deg2. This produced a coarsely sampled map which allowed us to trace the overall molecular-cloud distribution. A total of 7000 pointings were obtained. Follow-up observations were then made on a finer but still under-sampled grid of 1 arcmin towards areas of interest. We used an observing technique with a reference position offset by 2 degrees to avoid a contribution from off-source CO emission. One-minute integrations were made at each ‘source’ position, with a five-minute reference observation every thirty minutes.
The spectra were obtained using a digital correlator which was configured into 2 bands, each consisting of 1024 channels extending over 64 MHz. One band was tuned to the CO transition, giving a velocity resolution of 0.20 km s-1. For each observing run the band was centred on a radial velocity of -20 km s-1 (LSR). The second band was tuned to the 86-GHz SiO transition. A pointing accuracy of better than 10′′ was obtained by periodically observing SiO masers near Carina.
At a wavelength of 2.6-mm, atmospheric absorption is significant. We adopted the ‘chopper-wheel’ method (Ulich & Haas 1976) to correct for this attenuation. By measuring the signal from a black-body absorbing paddle every 30 mins by means of a method described by Hunt (1997), observed intensities were converted to a temperature scale corrected for atmospheric effects. To provide a temperature scale compatible with that used at the 15-m Swedish ESO Sub-millimetre Telescope (SEST), we observed the SEST calibration sources in Orion and M17 on a daily basis throughout each observing period and compared the CO temperatures to those obtained with the SEST. To make the temperature scales consistent an average scaling factor of 1.5 was applied to the Mopra data. The final intensity calibration is accurate to 10-15 percent.
The data were processed using a combination of data reduction packages on ATNF facilities. For the preliminary reduction simple baselines were subtracted from the individual spectra and Hanning smoothing was applied. The frequency scale was corrected to velocity (LSR) without a diurnal variation correction, introducing a maximum error of 0.5 km s-1. A spectral cube (RA, Dec, velocity) was made using a Gaussian algorithm to interpolate between each spatial point. A smoothing radius of 0.8 arcmin was applied, giving an effective FWHM beam of 1.75 arcmin.
3 Results & Discussion
The results from our initial observations mapped on a 2 arcmin grid show the CO emission to extend over 3 degrees in the northwest-southeast direction. This is in agreement with the Carina GMC identified in the Columbia survey (Grabelsky et al. 1981). Our higher resolution map reveals a very clumpy morphology with two strong emission areas; one centred on Car II and the other towards a region northwest of the optical emission. Here we present the results from the better sampled set of observations on a 1 arcmin grid towards the Car II region.
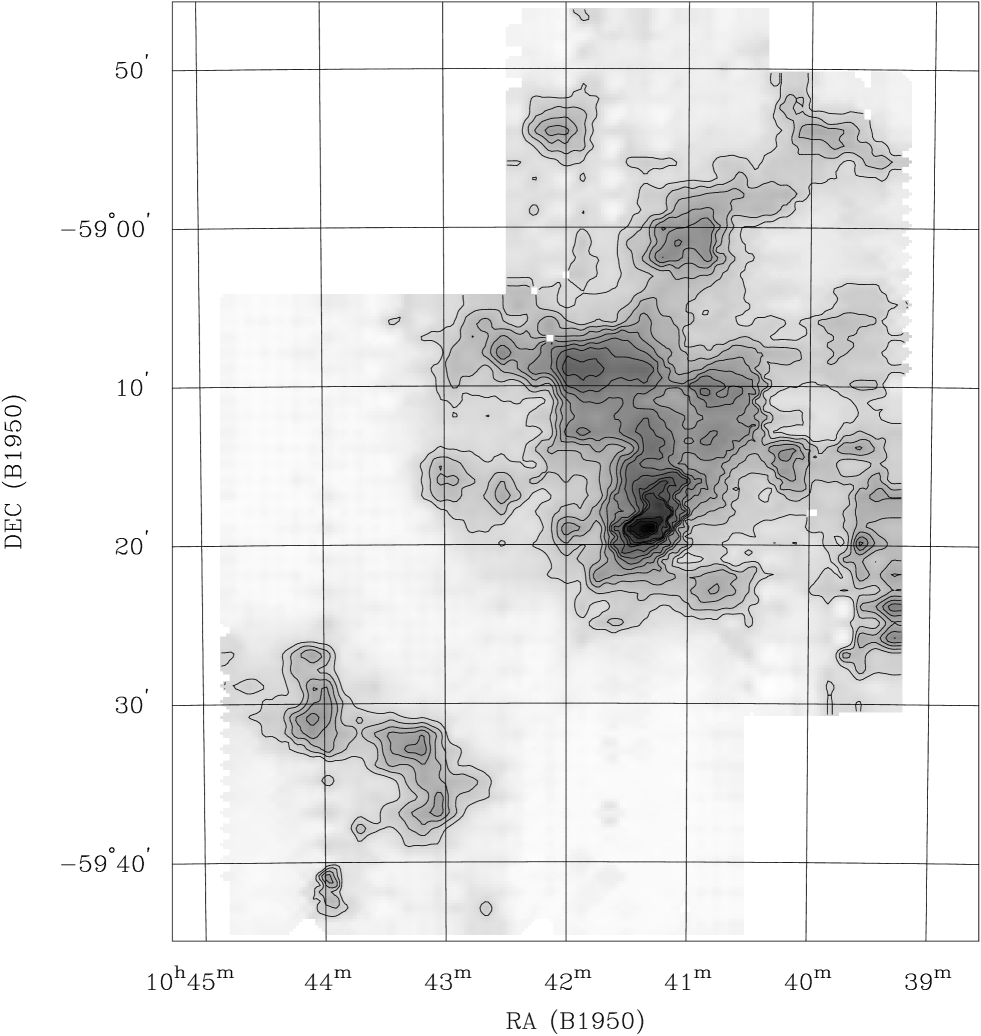
A grey-scale and contour image of the 12CO(1–0) emission integrated over a velocity range of -35 to 0 km s-1 is shown in Fig 1. The grey-scale boundaries show the region that was observed. Clearly two main emission regions are identified; a large region of emission covering the north-western part of the map and a region of fainter emission located in the south-east corner. These are the northern and southern emission clouds first distinguished by de Graauw et al. (1981) from observations of 12CO(2–1) emission using a beamwidth of 2.2 arcmin and sampled on a 4 arcmin grid.
The northern cloud contains the strongest emission. 12CO(1–0) observations of this region were first made by Whiteoak & Otrupcek (1984) using a 2.8′ beam revealing three emission concentrations. The higher resolution data presented here clearly show a more complicated morphology. Most of the strong emission is located in a large central region with branches of fainter emission extending outwards from it. One emission branch extends westwards and then expands outwards past the observed region. This emission is part of the larger GMC which extends over 2 degrees to the northwest. The strongest integrated emission is located in a small concentration at the southern part of the central emission region. Here the integrated intensity reaches a maximum of 2.0105 K/Beamm s-1. The southern cloud is a region of fainter emission, breaking up into small clumps at its southern edge.
The northern and southern cloud are separated by a region where the integrated CO emission is below 10 percent of the peak integrated intensity. This region is centred on the keyhole and Car II region. We did detect CO emission from the small-scale clumps that were found by Cox & Bronfman (1995); however the integrated intensity map shown in Fig 1 is not sensitive to such small-scale distributions.
Our results have identified many small CO concentrations in both the northern and southern cloud. These could be dense, warm clumps where star formation may next occur. In fact, Megeath et al. (1996) have detected very faint reddened stars towards one of the CO clumps in the southern cloud. If these are very recently formed stars as suggested then this is the first evidence of ongoing star formation within the Carina nebula. We are currently carrying out further observation towards the many clumps defined by this initial set of observations to look for further evidence of ongoing star formation.
Some sample spectra taken towards nine positions throughout the nebula are shown in Fig 2. The first three spectra (a-c) are representative of the southern cloud region. The emission is largely at a velocity of -27 km s-1 with a second component at -20 km s-1 seen at the western edge of the cloud. The remaining six spectra (d-i) are taken at positions in the northern cloud. Most of the emission in this northern region is found between velocities of -27 and -8 km s-1. The southern and eastern part of the cloud (d,e) has emission largely at -27, -18 and -10 km s-1 whereas for the northern and western region the main emission components are at -20 and -10 km s-1. The velocities presented here agree with those obtained by de Graauw et al. (1981).
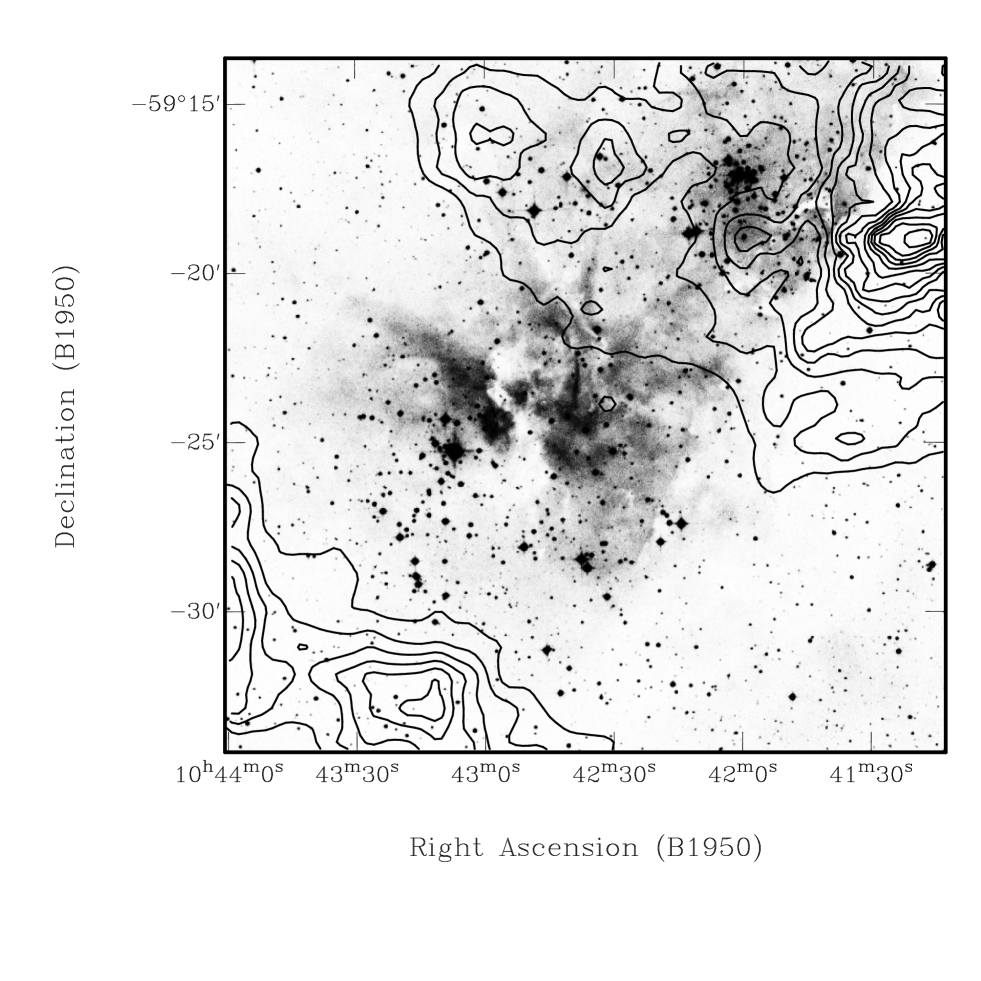
Figure 3 shows an expanded view of the area centred on the Keyhole Nebula. The contours represent the peak integrated 12CO(1–0) emission distribution and are superimposed on an R-band image showing the H distribution, obtained from the Digitised Sky Survey (DSS). The figure provides a comparison between the locations of Tr 14, Tr 16 and the optical nebulosity with the distribution of molecular gas. The keyhole region and the associated Car II radio continuum source appear to have little interaction with the main cloud emission. This supports the idea of the surrounding GMC being dispersed by the stellar winds and ionising fluxes of the massive stars in this region (Cox & Bronfman 1995). The southern cloud emission is confined to the eastern dust lane and coincides with an optical depth maximum. In the north the CO emission extends over the optical emission but the peak emission is located to the west of Tr 14 towards the western dust lane. It is coincident with a far-infrared emission peak. Adjacent to the eastern side of the CO emission peak is the radio continuum peak Car I. The sequence of the distinct emission sources; ionising cluster - radio continuum peak - far-IR-peak has been explained using a strong gradient in gas and dust density increasing from Tr 14 to the dust lane to the west (Harvey et al. 1979). de Graauw et al. (1981) described this region as a blister-type region, whereby the edge of the molecular cloud is being externally ionised by Tr 14. Our observations, which show a strong CO concentration adjacent to the radio continuum source Car I, support this blister-type model and clearly define the interface of the ionised and molecular gas.
4 Conclusion
We have presented data from the first stage of an extensive study of the GMC associated with the Carina nebula. The data consists of observations of 12CO(1–0) emission which have been used to trace the overall GMC as well as pinpoint and CO ‘hot-spots’ or dense regions where stars could possible form. The observations are at a higher resolution than previous studies and reveal the clumpy nature of the northern and southern cloud regions. They also show the positional coincidence between the far-infrared emission and the strong CO emission towards the Car I region. This supports a blister-type model for this region. Further observation of different transitions are being made to better constrain the temperature and density of the molecular gas in this interesting region.
5 Acknowledgements
We would like to thank the ATNF Receiver Group for tuning the system before remote-tuning was available and for their technical support during all the observations. This project has been funded by research grants from the ‘Small Grants’ ARC scheme. KJB acknowledges the support of an APA award.
References
Cox P., Bronfman L., A&A, 299, 583
Deharveng L., Maucherat M., 1975, A&A, 41, 27
Dickel H. R., 1974, A&A, 31, 11
Dickel H. R., Wall J. V., 1974, A&A, 31, 5
DSS; for information see http:skyview.gsfc.nasa.govcgi-binsurvcomp.pldss
Feinstein A., 1995, RevMexAA, 2, 57
Gardner F. F., Morimoto M., 1968, ApJ, 21, 881
Gardner F. F., Milne D. K., Mezger P. G., Wilson T. L., 1970, A&A, 7, 349
Gardner F. F., Dickel H. R., Whiteoak J. B., 1973, A&A, 23, 51
Ghosh S. K., et al 1988, ApJ, 330, 928
de Graauw T., et al 1981, A&A, 102, 257
Grabelsky D. A., Cohen R. S., Bronfman L., Thaddeus P., 1988, ApJ, 331, 181
Harvey P. M., Hoffmann W. F. Campbell M. F., 1979, ApJ, 227, 114
Huchtmeier W. K., Day G.A., 1975, A&A, 41, 153
Hunt M., 1997, submitted to PASA
Megeath S. T., Cox P., Bronfman L., Roelfsema P. R., 1996, A&A, 305, 296
Retallack D. S., 1983, MNRAS, 204,669
Tovmassian H. M., 1995, RevMexAA, 2, 83
Ulich B. L., Haas R. W., 1976, ApJ, 30, 247
Walborn N. R., 1995, RevMexAA, 2, 51
Whiteoak J. B., Otrupcek R. E., 1984, PASA, 5(4), 552
Whiteoak J. B. Z., 1994, ApJ, 429, 225