03(11.09.4; 11.05.2; 09.13.2; 11.19.2)
edeblok@physics.unimelb.edu.au, vdhulst@astro.rug.nl
W.J.G. de Blok
Star formation and the interstellar medium in low surface brightness galaxies
Abstract
We present deep, pointed 12CO() observations of three late-type LSB galaxies. The beam-size was small enough that we could probe different environments (Hi maximum, Hi mininum, star forming region) in these galaxies. No CO was found at any of the positions observed. We argue that the implied lack of molecular gas is real and not caused by conversion factor effects. The virtual absence of a molecular phase may explain the very low star formation rates in these galaxies.
keywords:
Galaxies: ISM – Galaxies: evolution – ISM: molecules – Galaxies: spiral1 Introduction
Low Surface Brightness (LSB) galaxies exhibit some of the most extreme properties known for disk galaxies. This class itself can be split into the group of disk dominated, late-type field galaxies with absolute magnitudes between and and central surface brightnesses mag arcsec-2, and the much smaller group of giant LSB galaxies (“Malin-1 cousins”, Sprayberry et al 1995 and Knezek 1993). Judging from their morphology these latter galaxies have undergone an evolutionary history quite different from the late-type field LSB galaxies which we will consider in this paper.
The extreme gas-richness (McGaugh & de Blok 1997) and low metallicities (McGaugh 1994) of the late-type LSB galaxies indicate that they are quite unevolved. They have low mass surface densities and this has often been suggested as a possible cause for their slow evolution (van der Hulst et al. 1987, McGaugh 1992, de Blok & McGaugh 1996).
Detailed investigations of a small sample of LSB galaxies (van der Hulst et al. 1993) show that their gas surface densities in general lie below the critical density needed for star formation, as derived by Kennicutt (1989). Although this global threshold density should be considered as a boundary condition only (local instabilities may still cause star formation), it nevertheless shows that conditions for star formation in LSB galaxies are not as favourable as in “normal” high surface brightness (HSB) galaxies.
This might simply be caused by the low densities, making dynamical timescales much longer, and therefore hampering the collapse of gas complexes into Giant Molecular Clouds (GMCs). The low metallicity may also make cooling of the Interstellar Medium (ISM) more difficult, delaying the formation of GMCs.
To get a better handle on the properties of the cold, molecular component of the ISM in LSB galaxies, one needs to observe indicators such as the CO molecule. Previous studies (Schombert et al. 1990) that have tried to detect CO, have not succeeded to rather low limits. This either means that CO does not work as a tracer in LSB galaxies – implying that large amounts of molecular hydrogen could still exist – or that LSB galaxies are deficient in their molecular component.
The case of H2-poor galaxies is especially interesting: the conditions that can then be deduced for LSB galaxies, which have obviously formed stars, might help answer questions as: where and how do stars form in an environment poor in molecular gas? Is a small molecular component, even as an intermediate agent always needed? Are GMCs always needed for star formation?
In this paper we will describe the results and implications of a few very deep pointed observations in the CO(2-1) line of various galactic environments in LSB galaxies. The higher resolution of this line with respect to the CO(1-0)-line enabled us to point at different locations within one galaxy. Positions were selected on the basis of detailed Hi (de Blok et al. 1996) and optical imaging (de Blok et al. 1995). Section 2 describes the observations; in sect. 3 the results are discussed; sect. 4 gives a discussion of the implications; and sect. 5 summarizes the results. We will assume a Hubble constant km s-1 Mpc-1 in the rest of this paper.
2 Observations
Three galaxies were chosen from the sample of LSB galaxies described in de Blok et al. (1996) and the references in the last paragraph of the previous section. We refer to these papers for a description of the detailed properties of our sample. In general, the sample contains late-type LSB galaxies with absolute magnitudes , central surface brightness -mag arcsec-2, and colour . In order to observe as wide a range of galactic environments as possible, we used Hi column density maps and H imaging to choose prominent Hi minima and maxima and star forming regions. The H images were also used to check whether any Hi features coincided with optical features. In the end four positions were observed with the 15-m James Clerk Maxwell Telesope at Mauna Kea, Hawaii, in the 12CO (J) line at 230 GHz rest-frequency.
The observations were carried out from 29 March – 3 April 1993. The A2 SIS receiver was used with the AOSC backend, giving 2048 channels over a bandwidth of 500 MHz with a 250 kHz channel separation. Because of a factor of two oversampling the effective resolution was 500 kHz. This corresponded to a velocity range of 652 km s-1, and an effective velocity resolution of 0.67 km s-1 (2 channels).
The beam size was and observations were made in beam-switching mode. The object position and a piece of sky 2 to 3′ away in azimuth were observed. Calibration was done with the help of a three-load measurement. Three resistors with known temperatures were measured and thus calibrated the temperature scale. These calibration measurements were made every half hour. The scatter in these calibration measurements was less than 5% from night to night. This calibration was deemed to be sufficiently accurate for our purpose.
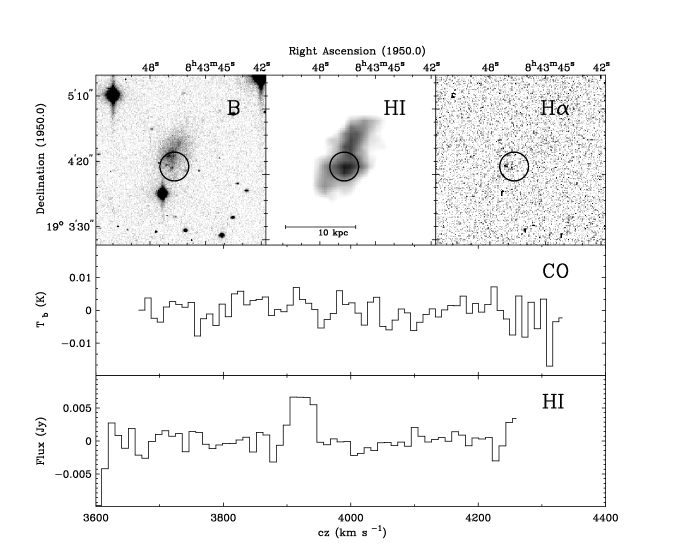
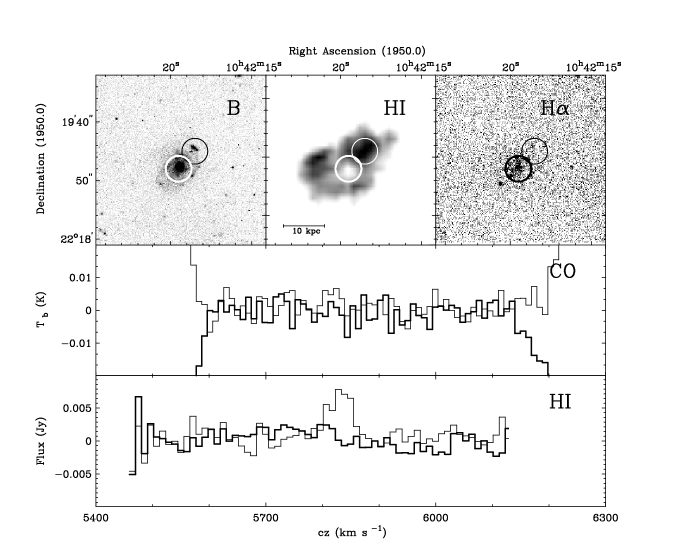
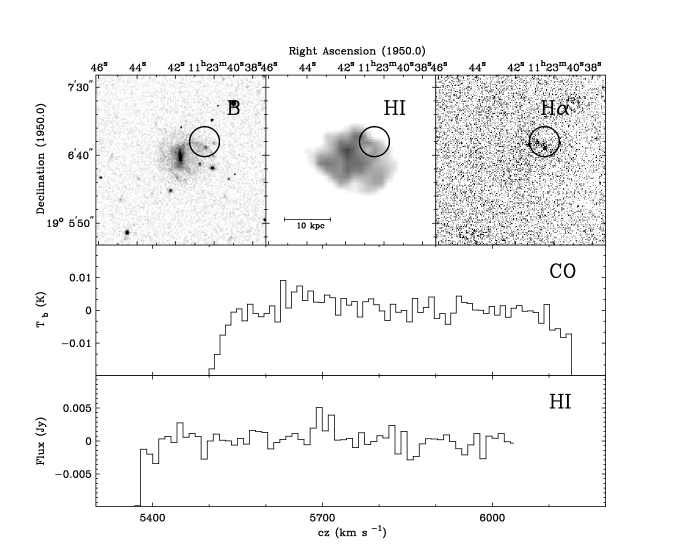
The observed positions are given in Table 1, along with the name of the galaxy, a description of the position and the total (on+off source) integration time. The top panels in Fig. 1 show the pointing positions.
| Name | typeb | |||
|---|---|---|---|---|
| F563-V1 | 08 43 46.7 | +19 04 16 | 8800 | peak |
| F568-V1 | 10 42 19.5 | +22 19 00 | 8800 | hole |
| 10 42 18.5 | +22 19 15 | 10855 | peak | |
| F571-V1 | 11 23 40.5 | +19 06 50 | 10400 | SF |
Notes: a: is total integration time in seconds. Time spent on source is half this value.
b: ‘peak’ denotes a peak in the Hi distribution, ‘hole’ a hole in the Hi distribution, ‘SF’ a region of star formation.
3 Results
No CO emission was detected at any of the positions after on-source integration times of hours per position. Typical RMS-noises at 500-kHz-resolution were mK. A beam efficieny of 0.77 was used to convert the measured antenna temperatures to brightness temperatures .
Upper limits on the CO-flux were determined using a upper limit. As the original velocity resolution is too high to get any meaningful upper limits, we have smoothed the spectra to lower resolutions. We will present the results for two different resolutions: a velocity channel separation of 5.2 km s-1, i.e., identical to the velocity channel separation of the Schombert et al. (1990) observations, and 11 km s-1, which is identical to the velocity channel separation of the VLA Hi observations in de Blok et al. (1996).
The upper limits to the H2 mass in the beam were determined following the method described in Schombert et al. (1990) and Bregman & Hogg (1988). Using the Hi velocity widths measured within the JCMT beam [extracted from the de Blok et al. (1996) Hi data cubes], we can derive an upper limit to the H2 mass as follows. For a channel spacing of 11 km s-1 we get:
where . This yields
We can then convert this to upper limits of H2 masses in the beam by using the formula given in Sanders et al. (1986):
Here is the telescope beam diameter at the distance of the source, expressed in parsecs. This formula assumes cm-2/(K km s. The H2 mass depends directly on the value of this conversion constant. In the next section we will show that our conclusions do not depend crucially upon this factor.
| 5.2 km s-1 resolution | ||||||||||
| Name | Pos | |||||||||
| (mK) | (mK) | (km s-1) | (K km s | (Mpc) | (kpc) | () | ( | |||
| (1) | (2) | (3) | (4) | (5) | (6) | (7) | (8) | (9) | (10) | (11) |
| F563-V1 | 1 | 3.76 | 4.88 | 65 | 0.268 | 51 | 5.4 | 3.57 | 12.28 | 0.28 |
| F568-V1 | 1 | 3.30 | 4.28 | 80 | 0.260 | 80 | 8.5 | 8.68 | 20.09 | 0.43 |
| F568-V1 | 2 | 2.40 | 3.12 | 80 | 0.190 | 80 | 8.5 | 6.31 | 97.95 | 0.064 |
| F571-V1 | 1 | 2.81 | 3.64 | 55 | 0.185 | 79 | 8.4 | 5.96 | 24.00 | 0.25 |
| 11 km s-1 resolution | ||||||||||
| F563-V1 | 1 | 2.77 | 3.60 | 65 | 0.276 | 51 | 5.4 | 3.63 | 12.28 | 0.30 |
| F568-V1 | 1 | 2.58 | 3.35 | 80 | 0.188 | 80 | 8.5 | 9.39 | 20.09 | 0.45 |
| F568-V1 | 2 | 2.20 | 2.86 | 80 | 0.243 | 80 | 8.5 | 8.04 | 97.95 | 0.081 |
| F571-V1 | 1 | 2.17 | 2.82 | 55 | 0.198 | 79 | 8.4 | 6.39 | 24.00 | 0.264 |
(1) Name of galaxy. (2) Position identification. (3) RMS noise in antenna temperature. (4) RMS noise in brightness temperature. (5) Velocity width Hi profile within JCMT beam. (6) Upper limit CO intensity. (7) Distance to galaxy (). (8) Diameter beam at distance of galaxy. (9) 3 upper limit H2 mass in beam. (10) Hi mass in beam. (11) Upper limit mass ratio.
Table 2 compares the RMS noises at the lower resolutions. The top panel contains the RMS-noise of the spectra smoothed to 5.2 km s-1; the bottom panel that of the 11 km s-1 spectra.
The bottom panels of Fig. 1 compare the 11 km s-1 JCMT spectra with the VLA spectra measured at the same spatial position. These latter were extracted from the data cubes using a beam size of 22\arcsec (the size of the JCMT beam). If a significant amount of CO were distributed like the Hi the CO profile should resemble the neutral hydrogen profile at that pointing, but at the position of the Hi signal, there is no hint of any CO emission.
The total masses of the Hi within the beam are compared with the upper limits to the H2 masses in Table 2. The upper limits to the (H2)/(Hi) ratios are extremely low, consistent with the previous measurements by Schombert et al. (1990) and Knezek (1993). While the observations of Schombert et al. probed entire galaxies in one observation, our pointed observations show that also more locally the amount of CO is extremely low.
Many studies list the total H2 masses of galaxies and compare them with other properties. To be able to compare our results, which only give in a part of the galaxy, with these other studies we derive an upper limit on the total H2 mass in the following way: we compute the ratio between the area of the beam and the total area of the galaxy within (1) the HI radius (radius where surface density reaches 1 pc-2) and (2) the optical radius . By multiplying the upper limits from Table 2 with this ratio we find the total H2 mass (again within either the HI radius or the optical radius). We can then compare these with the total HI mass. These results are tabulated in Table 3. We have used the 11 km s-1 results to be able to compare directly with the VLA data.
In general the CO in other galaxies is found only at radii less than half of the optical radius (Young & Knezek 1989). In this respect the numbers given in Table 3 are very optimistic numbers, as they assume that the CO extends out to the HI radius and the optical radius, respectively. The true numbers are therefore likely to be lower. We will use the results derived for 11 km s-1 and in the rest of this paper.
| 11 km s-1 resolution | |||||||
| Name | |||||||
| () | (kpc) | () | (kpc) | () | |||
| F563-V1 | 53.7 | 6.5 | 21.3 | 0.393 | 3.2 | 5.1 | 0.096 |
| F568-V1 | 245.5 | 14.3 | 106.5 | 0.432 | 6.2 | 20.1 | 0.081 |
| F568-V1 | 245.5 | 14.3 | 91.5 | 0.372 | 6.2 | 17.1 | 0.069 |
| F571-V1 | 117.5 | 9.9 | 35.4 | 0.300 | 3.8a | 6.3 | 0.054 |
a: is smaller than radius of beam. We have therefore used the H2 mass from Table 2 without changes.


4 Discussion
The non-detections of CO can be taken at face-value to suggest that LSB galaxies are poor in H2. There are, however, several factors which complicate this naive interpretation. The most important of these is the conversion factor which is used to convert the measured CO brightness temperature into an H2 mass. The value of is uncertain and is inferred to have a large range. Any interpretation of CO measurements will thus depend on the assumed values of .
In the following sections we will first discuss our results in the light of other studies of the molecular gas in late type galaxies, then explore the implications of possible variations in the conversion factor with morphological type and metallicity and finally infer that the LSB galaxies of the kind considered are here significantly poorer in H2 than their HSB counterparts.
4.1 Comparison with other galaxies
As the ISM in LSB galaxies has low metallicities (McGaugh 1994) we will compare our non-detections with observations of samples of other late-type, low-metallicity galaxies.
One such sample is that of Sage et al. (1992) of dwarf irregulars and blue compact galaxies. One of their conclusions is that for the galaxies in their sample the CO/Hi ratio did not depend on metallicity. If this were also true for our LSB galaxies then we would have expected to detect CO based on their Hi masses.
Our results therefore appear inconsistent with a constant CO/Hi ratio. This should perhaps not be expected: dwarf irregulars and especially blue compact galaxies have appreciable star formation rates or are undergoing bursts and both also have high surface densities. LSB galaxies on the other hand have low current star formation rates and low Hi surface densities.
A better comparison sample therefore is perhaps the sample of Magellanic irregular galaxies of Hunter & Sage (1993). These observations also resulted in null-detections. Based on this they suggest that molecular gas may be a transient phenomenon in dwarf galaxies, as a result of the low Hi volume densities which supposedly are not high enough to sustain H2. The low Hi densities found in LSB galaxies (de Blok et al. 1996) then suggest that similar reasoning can explain the apparent lack of CO, and thus of H2.
It is of interest also to examine as a comparison sample the sample of late-type galaxies in the Virgo cluster as described by Kenney & Young (1988). They discuss several reasons why the CO-poor but Hi-rich galaxies in their sample are most likely also H2-poor. The LSB galaxies discussed here share some of the properties of the late-type Virgo-spirals so this discussion is relevant for our results.
The sample of Virgo spirals shows a large range in CO-surface brightness (defined as ) with the most luminous galaxies having the highest values. Kenney & Young divide the group of galaxies with into two groups according to their Hi-richness. The Hi-rich galaxies turn out to be poor in CO, while the Hi-poor galaxies are rich in CO. As they find no Hi-rich galaxies that are also CO-rich, they suggest that this indicates that the Hi-rich galaxies do not contain much molecular gas. This might thus be a hint that the gas-rich late-type LSB galaxies are also poor in molecular gas.
Kenney & Young also find a correlation between the amount of far infra-red (FIR) emission (arising from dust heated by starlight) and the total amount of gas within the optical radius of a galaxy. Actual FIR measurements of LSB galaxies are to our knowledge not available (None of the late-type LSB galaxies discussed here was found in the IRAS database), but we can use the work by Bothun et al. (1989) to show that LSB galaxies must have FIR luminosities of . Comparison with the relation of Kenney & Young (their Fig. 3d) then implies that the amount of Hi present in LSB galaxies (a few times ) is (more than) enough to account for the total gas mass. This also is an indication that LSB galaxies do not contain large amounts of molecular gas.
4.2 The CO – H2 conversion factor
What conditions must a galaxy fulfill in order to be able to maintain large amounts of molecular gas? First, the metallicity must be high enough to ensure sufficient amounts of dust. Second, the total column density of gas must be large enough to shield H2 from dissociating radiation. Measurements of colours, metallicities and Hii region Balmer decrements of late-type LSB galaxies all suggests a low dust content (McGaugh 1994, van den Hoek et al. 1997). Observations of the Hi (de Blok et al. 1996) show low surface densities. LSB galaxies do not seem to obey the conditions necessary for H2.
As the H2 formation rate is thought to be proportional to the number density of the dust, the low dust content and low dust-to-gas ratio, or alternatively the low metallicity, lower this rate and also lower the fraction of star-forming-cloud mass that is in molecular form. The low dust content may make the conversion from Hi into H2 more difficult, as dust grains provide shielding from the interstellar radiation field. A larger column density of gas is thus needed to self-shield the H2. The low densities and lack of dust found in LSB galaxies make it easier for UV photons to dissociate molecules, thus destroying H2 more easily.
However, the same processes affect the CO molecules even more. Lower abundances of oxygen, and presumably carbon, in the gas means that the sizes of the clouds as traced by the CO may be smaller than the underlying H2 clouds. The CO emission will therefore be lower too. If a constant conversion factor is assumed, this then leads to an underestimate of the total amount of molecular hydrogen.
This effect is dramatically illustrated by Maloney & Black (1988) using a model of the SMC. A dust to gas ratio (equivalent to metallicity) 17 times smaller than that of the local solar neigbourhood yields an H2 peak abundance which is decreased by only 10%. The effect is much more dramatic for the CO. Whereas models for Galactic GMCs show that 99% of the carbon is locked up in CO, the GMCs in the SMC contain only 1% of the carbon in the form of CO. Self-shielding is thus very important for the survival of CO molecules in the interstellar UV radiation field. Observations of molecular clouds in the SMC (Rubio et al. 1993) do indeed show this effect and the value found for from an analysis of virial masses of individual clouds is 4 – 20 times higher than the standard Galactic value for clouds of 20 – 200 pc in size.
Similarly the CO to H2 conversion factor can be very different in the low metallicity LSB galaxies. One should keep in mind that a different value of does not imply that LSB galaxies contain large amounts of H2. It still leaves open the possibility that the absolute amount of H2 may be fairly small. We therefore discuss various approaches to the conversion factor and the implications for the H2 content of LSB galaxies in the following subsections (4.2.1-3)
4.2.1 A constant conversion factor
Young & Knezek (1989) have analysed the change in over a large range in Hubble type, and found a decreasing importance of H2 towards later Hubble types. In this analysis they kept the conversion factor constant at cm-2/(K km s, arguing that this trend cannot be caused by a change in alone, as that would imply that the temperature of the gaseous ISM would need to be some 20 times lower in late type galaxies than in early types, or alternatively the density of the gas would have to differ by a factor of 400 between early and late types.
This means that the change in would have to be caused at least partly by a true decrease in the importance of H2 towards later types. Again, if these arguments are accepted, LSB galaxies are galaxies that are poor in H2, and whose gas component is totally dominated by the neutral hydrogen.
This is illustrated in Fig. 2, where the data of Young & Knezek is schematically represented, along with LSB measurements. The upper limits derived for the LSB galaxies clearly follow the trend defined by the Hubble sequence. Assuming a constant thus makes LSB galaxies 2 orders of magnitude more poor in H2 than early-type HSB galaxies and, based on our upper limits, a factor of poorer than HSB late-type galaxies of similar Hubble type.
4.2.2 An ad-hoc conversion factor
Low H2 fractions can also be inferred from the work of Vila-Costas & Edmunds (1992) [VCE]. Amongst other things they looked at the mutual dependences in a number of HSB galaxies of metal abundances in the gas, surface densities of the gas and H2 fractions. The latter were determined from CO fluxes from the literature, by assuming a variable conversion factor that would for each galaxy give an exponential total (i.e. Hi and H2) gas distribution. They show that low gas-surface density galaxies have low oxygen abundances (their Fig. 7), and low H2 fractions.
In Fig. 3 the relation between abundance and molecular gas fraction from VCE is shown, with our measurements and those from Schombert et al. (1990) overplotted. We did not include Knezek’s (1993) sample as this consists of giant LSB galaxies who have most likely undergone a different evolutionary history.
Applying the abundance values from McGaugh (1994) and de Blok & van der Hulst (1997, Paper I) to the trend derived by VCE we find that in LSB galaxies must be less than , consistent with the actual measurements, where our measurements imply ratios of less than 0.06.
The trend as presented in VCE cannot be explained as an artefact of their variable conversion factor . VCE allow values between 0.8 and 4.8 (), which is a factor of 6. This translates in approximately a factor of 2 change in . The various values of which VCE derive are however independent of properties like Hubble type, and will therefore not introduce any systematic trends. The effect of changing in a non-systematic way as VCE have done is therefore merely a shift in the positions of individual galaxies by at most a factor of 2. In essence they have just added scatter to the relation derived by Young & Knezek (1989). This therefore does not affect the conclusion that the VCE analysis implies that the molecular component in LSB galaxies most likely constitutes only a small fraction of the total amount of gas.
4.2.3 A metallicity-dependent conversion factor
Wilson (1995) demonstrated that Maloney & Black’s (1988) ideas concerning a variation in with metallicity is borne out in observations of galaxies in the Local Group. Based on measurements of the CO luminosity and determination of the virial masses of individual clouds, Wilson finds that the conversion factor increases as the metallicity decreases. Israel (1997) investigated the metallicity dependence of in a different way using the FIR surface brightness and Hi column density to estimate the column density of H2 and found an even steeper relationship.
The average oxygen abundance for the LSB galaxies we observed is 12 + log(O/H) . Using the above results this would lead to conversion factor values of 2 – 6 times the Galactic value.
The star formation rates and Hi column densities in the galaxies used to derive the dependence of on metallicity are appreciably higher than those commonly found in LSB galaxies. The lower star formation rate implies a lower energy density of the radiation field and consequently lower dissociation of the CO and H2. The result will be that probably is not as large as in the extreme case of the SMC, so some care should be excercised in using these results for estimating the H2 mass limits for LSB galaxies.
Another effect of the low metallicities is a less efficient cooling of the ISM, which leads to higher cloud temperatures, making it difficult for a cold molecular phase to exist. Detailed modelling suggests that the lack of cooling is sufficient to prevent most of the gas from becoming cold () (see the results presented in Gerritsen & de Blok [Paper III]), and that this is one of the main causes for the low star formation rates in LSB galaxies. This implies that H2 would only be a small fraction of the total gas mass.
Bearing these effects in mind we estimate that will be times the Galactic value in our objects. In other words, LSB galaxies should contain 4 times more H2 than the Galactic value suggests.
The trend found by Young & Knezek (1989) implies a decrease in the importance of molecular gas by a factor of 300 from early- to late-type galaxies. Our LSB galaxies are furthermore at least a factor 10 more poor in molecular gas than average late-type HSB galaxies.
Assuming that the Galactic value of holds for the early-type galaxies, the metallicity dependence of increases the upper limits for the amount of molecular gas inferred in LSB galaxies by a factor of . This still makes LSB galaxies a factor more poor in molecular gas than the early-types. The metallicity dependence of implies that its value for the late-type HSB galaxies will also be larger. This means that the amount of molecular gas in LSB galaxies will increase by less than a factor of with respect to the late-type HSB galaxies, thus retaining the difference between LSB and HSB galaxies. If, as suggested by, amongst others, Israel (1997) the value of depends mainly on the radiation field, rather than metallicity, then the value of in late-type HSB galaxies could actually be than in the LSB galaxies, thus increasing the difference between HSB and LSB galaxies.
Similar arguments apply to the VCE results. The larger will decrease the slope of the VCE trend by about a factor of 3, which is however not enough to make the trend of decreasing H2 fraction with decreasing abundance disappear.
In summary, the metallicity dependence of tends to offset partly the trends found by Young & Knezek (1989) and VCE, but the effect is not strong enough to make these trends disappear. The trend of decreasing molecular gas content with Hubble type remains, although slightly less steep than given by Young & Knezek. The conclusion remains that it is likely that LSB galaxies have smaller H2 fractions than their HSB counterparts.
4.2.4 Other arguments
An additional argument why it is plausible to have small H2 fractions in LSB galaxies is the role of shear. One way of creating high column density regions where molecular gas may form is by making massive clouds. These form most likely in cloud-cloud collisions. The collision rate will be larger in galaxies where shear plays an important role. Clouds may then also grow from gravitational accretion in shearing gas layers. The rotation curves of LSB galaxies show them to have only slowly rising rotation curves with large solid-body parts, so that the amount of shear will be smaller with a consequently smaller cloud growth rate.
The cloud formation rate also depends on the mean gas volume density. For example in our Milky Way at 4 kpc 70 percent of the molecular gas is locked up in massive clouds, while at 10 kpc this is only 10 percent (see e.g. Sakamoto et al. 1997). It will be clear that the conditions for forming massive clouds will be less favourable in LSB galaxies.
These arguments thus imply that LSB galaxies probably have a low H2 content. We should note though that CO emission has been detected in a few LSB galaxies in the sample of Knezek (1993). However, as noted earlier, her sample was selected to contain giant early-type LSB galaxies. These galaxies have a much different morphology (e.g. presence of a large bulge) than the galaxies in our sample. A detailed discussion of these galaxies would be interesting but is unfortunately beyond the scope of this paper.
4.3 Caveats
Throughout this paper we have assumed a one-to-one correspondence between the CO(2-1) brightness temperature and the CO(1-0) brightness temperature. All derivations of etc. are based on the latter. In practice the correspondence is not entirely one-to-one, as the CO(1-0) and CO(2-1) lines do not necessarily trace the same gas. CO(2-1) probably traces slightly warmer and denser clouds. Chiar et al. (1994) find from observations of an ensemble of molecular clouds in the Galactic plane that the average ratio between the CO(2-1) and CO(1-0) brightness temperatures is 0.8. This implies that a conversion factor based on CO(2-1) observations should be 20 percent larger than , which is the commonly used conversion factor.
Further independent modelling by Kutner et al. (1990) shows that the ratio depends on gas density, CO abundance and temperature. They find that increases with decreasing CO abundance. One might tentatively conclude from this that the ratio in LSB galaxies might be closer to unity than the value of 0.8 mentioned above. The results of Rubio et al. (1993) for the SMC indicate a ratio of 1.2, supporting the idea that this ratio is at least unity for LSB galaxies. In the worst case assuming a one-to-one correspondence between CO(2-1) and CO(1-0) (i.e. assuming that ) thus underestimates the derived LSB H2 masses by 20 percent. This is not enough to make LSB galaxies rich in H2 and does affect neither the discussion nor the results.
5 Concluding Remarks
We have presented deep, pointed 12CO() observations of three LSB galaxies. No CO was found at any of the positions observed. This leads to a mean upper limit of the local , with individual values for the total ratio reaching less than 6% (assuming a Galactic value for the CO to H2 conversion factor ).
It is, however, unlikely that the Galactic conversion factor applies to LSB galaxies which have low metallicities and low dust content. In fact the value for is likely to be times higher. The H2 content would be correspondingly higher. Our limits then imply that LSB galaxies roughly have (less than) 25% of their gass mass in the form of H2. This is still lower than is found in HSB galaxies.
The conclusion then is that there are no large amounts of H2 hidden in LSB galaxies. The low star formation rates measured in LSB galaxies can thus be explained by the virtual absence of a molecular component. Star formation in LSB galaxies may thus proceed in a different way than in HSB galaxies. A detailed comparison between the properties of star forming regions in LSB and HSB galaxies may be a good way to put more constraints on the way stars form in environments that lack a cold component.
Acknowledgements.
We thank the anonymous referee and Tom Oosterloo for comments that have improved aspects of this paper. The James Clerk Maxwell Telescope is operated by The Joint Astronomy Centre on behalf of the Particle Physics and Astronomy Research Council of the United Kingdom, the Netherlands Organisation for Scientific Research, and the National Research Council of Canada.References
- [] Bothun G.D., Lonsdale C.J., Rice W., 1989, ApJ 341, 129
- [] Bregman J.N., Hogg D.E., 1988, AJ 96, 455
- [] Chiar J.E., Kutner M.L., Verter F., Leous J., 1994, ApJ 431, 658
- [] de Blok W.J.G., McGaugh S.S., 1996, ApJL 469, L89
- [] de Blok W.J.G., van der Hulst J.M., 1997, A&A, submitted (Paper I)
- [] de Blok W.J.G., van der Hulst J.M., Bothun G.D., 1995, MNRAS 274, 235
- [] de Blok W.J.G., McGaugh S.S., van der Hulst J.M., 1996, MNRAS 283, 18
- [] Gerritsen J.P.E., de Blok W.J.G., 1997, A&A, submitted (Paper III)
- [] Hunter D.A., Sage L.J., 1993, PASP 105, 374
- [] Israel F.P., 1997, A&A 328, 471
- [] Kennicutt R.C., 1989, ApJ 344, 685
- [] Kenney J.D., Young J.S., 1988, ApJ 326, 588
- [] Knezek P.M., 1993, PhD thesis, University of Massachusetts
- [] Kutner M.L., Verter F., Rickard L.J., 1990, ApJ 365, 195
- [] Maloney P., Black J.H., 1988, ApJ 325, 389
- [] McGaugh, S.S., 1992, PhD thesis, University of Michigan
- [] McGaugh S.S., 1994, ApJ 426, 135
- [] McGaugh S.S., de Blok W.J.G., 1997, ApJ 481, 689
- [] Rubio M., Lequeux J., Boulanger F., 1993, A&A 271, 9
- [] Sage L.J., Salzer J.J., Loose H.-H., Henkel C., 1992, A&A 265, 19
- [] Sakamoto S., Hasegawa T., Handa T., Hayashi M., Oka T., 1997, ApJ 486, 276
- [] Sanders D.B., Scoville N.Z., Young J.S., et al., 1986, ApJL 305, 45
- [] Schombert J.M., Bothun G.D., Impey C.D., Mundy L.G., 1990, AJ 100, 1523
- [] Sprayberry D., Impey C.D., Bothun G.D., Irwin, M.J. 1995, AJ 109, 558
- [] van den Hoek L.B., de Blok W.J.G., van der Hulst J.M., de Jong T., 1997, in: de Blok W.J.G., PhD Thesis, Chapter 3
- [] van der Hulst J.M., Skillman E.D., Kennicutt R.C., Bothun G.D., 1987, A&A 177, 63
- [] van der Hulst J.M., Skillman E.D., Smith T.R., et al., 1993, AJ 106, 548
- [] Vila-Costas M.B., Edmunds M.G., 1992, MNRAS 259, 121
- [] Wilson C.D., 1995, ApJL 448, L97
- [] Young J.S., Knezek P.M., 1989, ApJL 347, L55