A Study of Nine High-Redshift Clusters of Galaxies :
III. HST11affiliation: Based on observations with the NASA/ESA Hubble
Space Telescope, obtained at the Space Telescope Science Institute
(STScI), which is operated by the Association of Universities for
Research in Astronomy (AURA), Inc., under National Aeronautics and
Space Administration (NASA) Contract NAS 5-26555. Morphology of Clusters 0023+0423
and 1604+4304
Abstract
We present a detailed morphological analysis of the galaxy populations in the first two clusters to be completed in an extensive observational study of nine high-redshift clusters of galaxies (Oke, Postman & Lubin 1988). These two clusters, CL0023+0423 and CL1604+4304, are at redshifts of and , respectively. The morphological studies are based on high-angular resolution imagery taken with WFPC2 aboard the Hubble Space Telescope. These data are combined with deep, ground-based photometry and spectra taken with the Keck 10-meter telescopes. The morphological classifications presented in this paper consist of two parts. Firstly, we provide a quantitative description of the structural properties of galaxies per cluster field using the Medium Deep Survey automated data reduction and object classification software (Griffiths et al. 1994; Ratnatunga, Ostrander & Griffiths 1997). This analysis includes the galaxy position, photometry, and best-fit bulge+disk model. Secondly, for the brightest subsample of galaxies per cluster field, we provide a more detailed morphological description through a visual classification based on the revised Hubble classification scheme (e.g. Sandage 1961; Sandage & Bedke 1994).
Based on these classifications, we have examined the general relation between galaxy morphology and other photometric and spectral properties. We find that, as expected, the elliptical and S0 galaxies are redder, on average, than the spirals and irregulars. In addition, there is a strong correlation between morphology and spectral type. Of the galaxies that are visually classified as ellipticals, the majority show K star absorption spectra which are typical of nearby, red early-type galaxies; however, a few are actually blue compact galaxies with spectra characterized by fairly strong, narrow emission lines. Normal late-type galaxies typically have spectra with blue colors and [O II] emission, while the presence of strong star-formation features, such as extremely high equivalent width [O II], , and/or [O III] emission, is always accompanied by peculiar morphologies which suggest recent mergers or interactions.
We have used the statistical distributions of cluster galaxy morphologies to probe the overall morphological composition of these two systems. This analysis reveals that the two clusters contain very different galaxy populations. CL0023+0423 has a galaxy population which is more similar to groups of galaxies and the field. This system is almost completely dominated by spiral galaxies. CL1604+4304, however, has a morphological composition which is more typical of a normal, present-day cluster; early-type galaxies comprise of all galaxies brighter than in the central . The ratio of S0 galaxies to ellipticals in this cluster is , consistent with local cluster populations. The morphological results support the conclusions of the dynamical analysis presented in the second paper of this series (Postman, Lubin & Oke 1998). CL0023+0423 consists of two galaxy groups which are separated by in radial velocity. CL1604+4304, on the other hand, has a velocity distribution indicating that it is already well-formed and relaxed. The morphological composition, velocity dispersion, and implied mass of the CL1604+4304 system are consistent with an Abell richness class 2 or 3 cluster.
Submitted for publication in the Astronomical Journal
1 Introduction
The study of the galaxy populations of rich clusters provides important constraints on the formation mechanisms of both clusters and galaxies. Present–day clusters show a distinct correlation between the structure of the cluster and the galaxy population. Irregular, open clusters, such as Virgo, are spiral–rich. These systems show no single, central condensation, though the galaxy surface density is at least five times as great as the surrounding field (). These clusters are often highly asymmetric and have significant degrees of substructure. Dense, centrally concentrated clusters, such as Coma, contain predominantly early–type galaxies in their cores (Abell 1958; Oemler 1974; Dressler 1980a,b; Postman & Geller 1984). These clusters have a single, prominent concentration among the bright member galaxies and typically display a high–degree of spherical symmetry, though this does not preclude evidence of some substructure. Central densities can reach as high as (e.g Bahcall 1975; Dressler 1978). In these regions, spiral galaxies comprise less than 10% of the cluster population, while elliptical (E) and S0 galaxies make up 90% or more of the population. The ratio of S0s to ellipticals is typically S0/E (Dressler 1980a). The galaxy content of clusters is part of the general morphology–density relation of galaxies; as the local density increases, the fraction of elliptical and S0 galaxies increases, while the fraction of spiral galaxies decreases (Hubble 1936; Dressler 1980a,b; Postman & Geller 1984).
Previous studies of clusters of galaxies at have revealed significant evolution in the morphology and the color of the cluster members. One of the most notable of these changes is the progressive blueing of cluster’s galaxy population with redshift, a trend first observed by Butcher & Oemler (1984). They found that the fraction of blue galaxies in a cluster is an increasing function of redshift, indicating that clusters at redshifts of are significantly bluer than their low–redshift counterparts. At redshifts of , the fraction of blue galaxies is . Recent HST image data reveal that many of these blue galaxies are either “normal” spirals or have peculiar morphologies, resulting in non–elliptical fractions which are 3 to 5 times higher than the average current epoch cluster (Dressler et al. 1994; Couch et al. 1994; Oemler, Dressler & Butcher 1997; Dressler et al. 1997).
Detailed photometric observations of other intermediate redshift () clusters have confirmed the original results of Butcher & Oemler (e.g. Millington & Peach 1990; Luppino et al. 1991; Rakos & Schombert 1995). Even though these clusters show an increased fraction of blue galaxies, they still contain a population of E/S0s distinguished by extremely red colors and a tight color–magnitude (CM) relation (a “red envelope”). Both the mean color and the CM relation are consistent with that of present–day ellipticals (e.g. Sandage 1972; Butcher & Oemler 1984; Aragón-Salamanca et al. 1991; Luppino et al. 1991; Molinari et al. 1994; Dressler et al. 1994; Smail, Ellis & Fitchett 1994; Stanford, Eisenhardt & Dickinson 1995).
At redshifts of , the red envelope has moved bluewards with redshift (Aragón-Salamanca et al. 1993; Smail et al. 1994; Rakos & Schombert 1995; Oke, Gunn & Hoessel 1996; Lubin 1996; Ellis et al. 1997; Stanford, Eisenhardt & Dickinson 1997). At , there are few cluster members with colors nearly as red as present–day ellipticals. The color distribution of this high-redshift elliptical population is relatively narrow, and the trend is uniform from cluster to cluster; this suggests a homogeneous population which formed within a narrow time span (e.g. Bower, Lucey & Ellis 1992a,b). Dickinson (1995) finds similar results in a cluster of galaxies which is associated with the radio galaxy 3C 324. The galaxies in this cluster exhibit a narrow, red locus in the CM magnitude diagram. This branch is mag bluer than the expected “no–evolution” value, though the intrinsic rms color scatter is only 0.2 mag. The observed color trend for the red envelope of galaxies in this data is consistent with passive evolution of an old stellar population formed by a single burst of star formation at redshifts of . The reasonably small color scatter would imply closely synchronized intra–cluster star formation (Bower et al. 1992a,b; Aragón-Salamanca et al. 1993; Dickinson 1995; Ellis et al. 1997; Stanford et al. 1997).
The high-resolution imaging of HST has been essential in understanding the evolutionary processes occurring at intermediate redshifts (see e.g. Abraham et al. 1996a). Morphological classifications can be made on scales of , providing a direct comparison with ground-based classifications of nearby galaxies. A comprehensive survey of 10 clusters of galaxies at has revealed a significant change relative to local clusters in the composition and behavior of the galaxy populations (Smail et al. 1997, hereafter S97; Dressler et al. 1997, hereafter D97). The authors have visually classified over 6000 galaxies based on the Revised Hubble Scheme used to classify nearby galaxies (e.g. Sandage 1961; Sandage & Bedke 1994). These classifications are used to quantify the morphological composition of each cluster. Their results indicate that the morphology–density relation is qualitatively similar to that in the local universe in those intermediate redshift clusters which are centrally-concentrated and compact; however, the relation is non-existent in the loose, open clusters. Even so, all of the clusters exhibit a roughly similar make-up of galaxy morphologies. The fraction of ellipticals is the same or larger than that in local clusters; the S0 fraction, however, is times lower, with a corresponding increase in the cluster spiral population. These findings imply that the elliptical population is already in place by , but a large fraction of the S0 galaxies are formed between redshifts of and (D97). However, it should be noted that these classifications are typically derived from images which are not of comparable quality to the local data. Because of such uncertainty, the observed evolution in the S0 population is still in contention (e.g. Stanford et al. 1997; Andreon, Davoust & Helm 1997; Andreon 1998).
Because there appears to be significant evolution occurring between redshifts of and the present epoch, it is critical to extend these detailed observations to even higher redshifts if we are to understand the formation of galaxy morphology, as well as the mechanisms and timescales of this evolution. Therefore, we have undertaken an extensive observational program to study nine candidate clusters of galaxies at redshifts of . The cluster sample was chosen from the Gunn, Hoessel & Oke (1986) survey and the Palomar Distant Cluster Survey (PDCS; Postman et al. 1996). For each cluster, we are in the process of obtaining deep photometry from Keck and deep photometry from the KPNO 4-meter, low-resolution spectra from Keck, and high angular resolution imagery from HST. The observations and data processing procedures of this survey are the subject of the first paper in this series (Oke, Postman & Lubin 1998; hereafter Paper I).
The first two clusters to be completed in this observational program are CL0023+0423 and CL1604+4304 at redshifts of and , respectively (see Paper I). In this paper, we have used HST images to undertake a detailed morphological analysis of the galaxy populations in the central regions of these two clusters. The reduction and analysis of the Keck photometry and spectra of the galaxies in these cluster fields are discussed in the second paper of this series (Postman, Lubin & Oke 1998; hereafter Paper II). However, the galaxy parameters presented in Paper II are used in this paper, specifically for a comparison with the morphological properties.
In Sect. 2, we provide a brief description of the data. In Sects. 3 and 4, we describe the automated and visual galaxy classification procedures used in this paper and present a comparison between the two techniques. In Sect. 5, we examine the morphologies of the galaxies in the two cluster fields. This includes the relationship between morphology and other galaxy properties, as well as the overall distribution of morphologies in the cluster. A discussion and summary of our conclusions are presented in Sects. 6 and 7. In the following analyses, we have assumed (e.g Carlberg et al. 1996) and .
2 The Data
In this section, we discuss briefly those aspects of the data acquisition and processing which are applicable to the following analyses. For more details, the reader is referred to Papers I and II.
2.1 The HST Observations
All nine clusters in our sample have been or will be observed with WFPC2 on HST (see Table 3 of Paper I). The HST imaging covers one WFPC2 field-of-view () of the central region of each cluster. At the redshifts of CL0023+0423 and CL1604+4304, this corresponds to approximately .
The CL0023+0423 field was observed in the F702W filter () for a total of 17.9 ksec in 1995. These observations were conducted by the authors. The F702W filter was chosen because it was the most efficient choice for imaging clusters given the typical spectral energy distribution of the cluster galaxies combined with the relatively high quantum efficiency and broad bandpass of the filter.
The CL1604+4304 field was observed in the F814W filter () for 32.0 ksec in 1994 and for 32.0 ksec in 1995. These observations were conducted by J. Westphal. The F814W filter was most likely chosen because observations in this passband correspond roughly to in the cluster rest-frame. In the analysis of the CL1604+4304 field, we use only the 1995 observations; the 1994 data are not used as the pointing was off by one third of an arcmin. The 1995 data consist of two individual 16.0 ksec pointings which are shifted slightly (, ) relative to each other. As discussed below, we have examined the two 1995 pointings separately.
For a comparison with the Keck photometric data, we have adopted a Vega-based (“Johnson”) magnitude system for the photometric calibrations in the and filters (see also Holtzman et al. 1995a). The zero points used in this paper were computed by using the routine SYNPHOT in the STSDAS IRAF reduction package. They are 22.38 and 21.67 for the and bandpasses, respectively. These zero points are based on aperture photometry measurements made within a radius aperture (or effectively infinity for a point source; see Holtzman et al. 1995b). Figures 1 and 2 show the full WFPC2 images of CL0023+0423 and CL1604+4304, respectively.
The WFPC2 observations provide sufficient resolution to permit a detailed description of the morphological characteristics of the galaxies in the central regions of these clusters. To achieve this goal, we have performed both a qualitative and quantitative study of the morphological and structural properties of the galaxies. The HST images of each cluster field have been processed through the Medium Deep Survey (MDS; Griffiths et al. 1994) data reduction pipeline in order to detect and quantify the structural parameters of extended sources in the field. This pipeline-processing procedure includes calibration, warm pixel correction, and image stacking to remove cosmic rays. For a complete description of the MDS reduction pipeline, see Ratnatunga, Ostrander & Griffiths (1997), hereafter referred to as ROG. The final, calibrated images from this reduction procedure are used for both the automated and visual morphological classifications presented in this paper.
The automated classifications are performed by MDS software specifically designed to detect objects in WFPC2 images and to provide best-fit bulge+disk models. For the CL1604+4304 field, the automated morphological analyses are initially performed on the data from the first 1995 pointing (given the STScI dataset designation of u2845). All of the galaxies detected, analyzed and classified in this dataset are then re-examined in an identical manner using the data of the second 1995 pointing (designated as dataset u2846). The two independent analyses are compared in order to provide a valuable consistency check of the automated classification procedures (see Sect. 3.1.1). In addition, each individual pointing of CL1604+4304 observations can be directly compared to the CL0023+0423 observations because they reach roughly equivalent depths.
We present all objects classified as non-stellar by the automated MDS software that are above the completeness limit. The completeness limit corresponds to , where is the decimal logarithm of the integrated signal-to-noise ratio in a region around each object which is 1- above the estimated local sky. This limit corresponds to a surface-brightness limit of and and a total magnitude limit of roughly and for an object in the CL0023+0423 and CL1604+4304 fields, respectively. The resulting catalogs contain 674 galaxies in the CL0023+0423 field and 559 galaxies in the CL1604+4304 field.
In addition, the brightest subsample of these galaxies have been visually classified according to the Revised Hubble system of nearby galaxies (e.g. Sandage 1961; Sandage & Bedke 1994). For each cluster observation, we estimate the total magnitude limit down to which we can accurately classify galaxies by eye. The total magnitude of each galaxy is defined as the total magnitude of the best-fit galaxy model determined in the automated classification procedure (see Sect. 3.1.1; ROG). For the CL0023+0423 field, this corresponds to a limiting magnitude of and a subsample of 209 galaxies. For the CL1604+4304 field, this corresponds to a limiting magnitude of and a subsample of 205 galaxies. The median of the galaxies in these subsamples is . Finding charts for the visually-classified galaxies are shown in Figures 3 and 4 for the two HST fields, respectively. The MDS identification number is indicated at the position of each galaxy. These figures can be used as overlays with the HST images presented in Figures 1 and 2.
2.2 The Keck Observations
All of the ground-based optical observations, both broad band and spectroscopic, were taken with the Low Resolution Imaging Spectrometer (LRIS; Oke et al. 1995) on either the Keck I or the Keck II telescopes. We briefly describe below the observations and data reduction; however, the reader is referred to Papers I and II for a complete account of these observations.
2.2.1 The Photometry
The photometric survey was conducted in four broad band filters, , which match the Cousins system well. The response curves of these filters are shown in Figure 1 of Paper I. In imaging mode, LRIS covers a field-of-view of arcmin, considerably larger than the WPFC2 field-of-view (see Sect. 2.1). The Keck observations have been calibrated to the standard Cousins-Bessell-Landolt (Cape) system through exposures of a number of Landolt standard star fields (Landolt 1992). The FOCAS package (Valdes 1982) was used to detect, classify, and obtain aperture and isophotal magnitudes for all objects in the co-added images. For the color analysis presented in this paper, we use aperture magnitudes computed in a circular aperture with a radius of . This corresponds to a physical radius of at , the redshifts of CL0023+0423 and CL1604+4304, respectively. The limiting magnitudes are , , , and for a 5- detection in our standard aperture (for more details, see Sects. 3.1 and 4.1 of Paper I). Tables of the Keck photometry for these clusters are given in Paper II.
Each galaxy that has been visually classified in our subsample of brightest HST galaxies (see Sect. 2.1) is matched with the corresponding galaxy from the ground-based observations. The typical FWHM seeing in the LRIS imaging data is 0.96 arcsec, compared to the 0.1 arcsec resolution of HST. In some cases, an individual galaxy in the LRIS image is associated with more than one galaxy in the corresponding HST image (see Sect. 5.1). We have not tried to obtain ground-based photometry for the full sample of galaxies analyzed through the MDS automated object classification as, at these faint levels, the broader PSF of the LRIS images makes the cross-identification with objects in the WFPC2 images unreliable.
2.2.2 The Redshifts
Multi-slit observations of the cluster field were made with LRIS in spectroscopic mode using an grating blazed at 5000 Å. The chosen grating provided a dispersion of 2.35 Å per pixel and a spectral coverage of 5100 Å. In order to obtain the full wavelength range along the dispersion axis, the field-of-view of the spectral observations was reduced from that of the imaging mode to approximately arcmin. For each cluster field, six different slitmasks were made with approximately 35 objects per mask. The exposure time for each mask was 1 hour. In practice, about 170 spectra were taken per cluster field, with yielding measurable redshifts. Because the contamination rate is so large at our cluster redshifts, most of these galaxies turn out to be field galaxies, rather than cluster members (see Paper II). For more details on the observations and data reduction procedures, see Sects. 3.2 and 4.2 of Paper I. Sample spectra from these fields are presented in Figures 19 and 20 (see also in Figures 5, 20 and 21 of Paper II).
Because a large number of slitmasks is required to completely cover a small area on the sky, the spectroscopic sample within the HST field-of-view is very limited. Redshifts were measured for only 41 and 29 galaxies in the WFPC2 field-of-view of CL0023+0423 and CL1604+4304, respectively (see also Sect. 5). Of the galaxies for which we have taken spectra in these central regions, we have successfully measured redshifts for of them in CL0023+0423 and of them in CL1604+4304. There are 12 confirmed cluster members in each HST field. We have determined cluster membership based on the analysis of the velocity histograms in Sect. 3 of Paper II.
3 Morphological Classification of Galaxies in the HST Data
Below we present a detailed description of the automated and visual techniques used to morphologically classify all of the galaxies (both cluster and field) detected within the HST images of the two clusters.
3.1 Automated Classifications
3.1.1 The MDS Analysis
For a quantitative analysis of the galaxy properties in our two cluster fields, we have processed our WFPC2 images through the data processing procedures and the automated object detection and classification algorithms designed by the Medium Deep Survey team. In this paper, we present only a brief description of the automated object classification procedures used to quantify the galaxy morphology. More detailed information on the entire reduction and identification process can be found in ROG and Ratnatunga et al. (1994, 1995), and at the MDS website address http://astro.phys.cmu.edu/mle/index.html.
The final step in the MDS processing pipeline is the automated object classification. This process involves a two-dimensional maximum likelihood estimator (MLE) analysis which automatically optimizes the model and the number of parameters to be fit to each object image. For most of the galaxies, a 64–pixel square region around the center of galaxy is examined. For larger galaxies, a 128–pixel square region is chosen. In this selected region, a contour around each object which is 1- above the estimated local sky is determined. The total integrated signal-to-noise ratio of this region is a good measure of the information content of the object image. The completeness limit of the object finding algorithm is ; however, only those galaxies with have enough signal to be reliably fit to the full two-component model discussed below (see ROG). Therefore, though we present all of the galaxies down to the completeness limit, only those galaxies with are used in the analysis presented in this section.
Two scale-free, axisymmetric models are chosen to describe the galaxy profiles. Elliptical galaxies are assumed to have a bulge-like, de Vaucouleurs profile, while disk galaxies have a disk-like, exponential profile. Each profile is characterized by a major axis half–light radius and axis ratio. Stellar (point-like) objects are examined through the same procedure as the galaxy images, except that a Gaussian profile is adopted. A maximum likelihood parameter estimation procedure is used to determine the best model and the parameter values. For each set of model parameters, a model image of the object is created and compared with the actual object image. The likelihood function is defined as the product of the probabilities for each model pixel value with respect to the observed pixel value and its error distribution. Finally, a best-fit model and its parameters are determined for each object with the following classifications: bulge disk, disk, bulge, galaxy (if the classification as disk or bulge is not significant), stellar, or object (if there is no preference between star and galaxy). For the details on the parameter fittings and the maximum likelihood estimator, see ROG and the references listed above.
All objects that are classified as non-stellar with a reliable signal-to-noise ratio () are listed in Table 1. Tables 1a–b list the relevant parameters of these fittings for the galaxies in the CL0023+0423 and CL1604+4304 fields, respectively. These parameters include the best-fit model, centroid, total magnitude, half-light radius, orientation, axis ratios, bulge/(disk+bulge) luminosity ratio, and bulge/disk half-light radius ratio. Table 1c give notes on the parameters in Table 1a–b. Because of the size of these tables, we have chosen not to publish Tables 1a–b; instead, a machine-readable form of these tables can be obtained from the authors L. Lubin or M. Postman and from the website http://landru.stsci.edu:5000/hizclus/ftp.html (see also Note to Table 1c).
For CL1604+4304, the galaxy parameters presented in Table 1b and used in the subsequent sections are obtained from the MDS analysis of the first dataset (u2845) of these observations. The second dataset (u2846) is used only as a test of the robustness of the MDS automated model fitting (see Sect. 2.1). Using the u2846 dataset, we have re-examined in an identical manner all the galaxies analyzed in the u2845 dataset and made a comparison of the model parameters of the same galaxy derived from the two datasets. For this comparison, we use those galaxies with as only they have enough signal to be reliably fit to the full two component model (see ROG). This corresponds to a sample of 293 galaxies (including both cluster and field).
Figure 5 presents these results for the best-fit model, the total magnitude , the logarithm of the half-light radius , the disk and bulge axial ratios, and the bulge/(disk+bulge) luminosity ratio . The best-fit model, on average, is the same in both datasets; however, the scatter between components is large with 23% of the objects having a different classification in the two datasets. The median and standard deviation (as measured from the interquartile range) of the ratio of in the u2845 and u2846 datasets is , while the ratio of in the two datasets is . The medians of both the disk and bulge axial ratios are 1. In addition, the median of the bulge/(disk+bulge) luminosity ratio is 1, with 66% of all galaxies having an identical value in the second dataset. However, the scatter and the resulting pattern in these three parameters (shown in the bottom panels of Figure 5) reflect the fact that, in only 77% of the cases, the individual galaxy has the same classification in both datasets. For the brighter subsample used in the visual classifications (see Sect. 3.2), the is higher with a median value of and, therefore, the comparison is slightly better (see also ROG). The medians for all of the parameters mentioned above are consistent with 1, typically with smaller scatter. In 79% of these cases, the galaxy has the same classification (either disk, bulge, or disk+bulge) in both datasets.
3.1.2 The Asymmetry Parameter
In addition to the automated disk+bulge MDS analysis, we have also measured a simple quantitative index of visual asymmetry () in each galaxy. The asymmetry parameter has been used previously in morphological studies of the galaxies in the Medium Deep Survey (Abraham et al. 1996a) and the Hubble Deep Field (Abraham et al. 1996b; van den Bergh et al. 1996). A similarly defined parameter is also used by S97 in the morphological analysis of 10 intermediate redshift clusters of galaxies. Here, we define the parameter in the identical manner to Abraham et al. (1996a).
We use for this procedure the galaxy region which was examined in the MDS analysis (see Sect. 3.1.1) which corresponds to an isophotal area enclosed by pixels 1- above the sky level. The asymmetry parameter is determined by rotating the individual galaxy image 180 degrees about its center and subtracting the rotated image from the original. The center of rotation is defined as the pixel with the maximum value in the original galaxy image after it has been smoothed with a Gaussian kernel of pixel. The parameter is then defined as
| (1) |
where and is the total light (after sky subtraction) in the rotated image and the original image, respectively. Because the absolute value of the residual light is used in this definition, noise in the images manifests itself as a positive signal in even in perfectly symmetrical objects. Therefore, it is necessary to remove this contribution by subtracting a small correction factor from each measured asymmetry parameter. This correction factor is simply the value of for a portion of the sky with an area equal to that of the galaxy region. Typical values of the asymmetry parameter range from to (see Figure 9). Tables 1a–b include the asymmetry parameter for each galaxy analyzed in the MDS automated analysis (see Sect. 3.1.1).
3.2 Visual Classifications
Visual galaxy classification in the nearby universe has had a considerably impact on theories of galaxy formation, environment, and evolution. In light of this, we have classified by eye the brightest subsample of galaxies in our two cluster fields. Unfortunately, this can be an inherently uncertain and subjective process even locally (for a nice demonstration, see Naim et al. 1995a,b). At high redshift, the situation becomes even more complicated. Here, we must contend with limited resolution, low signal-to-noise, cosmological dimming, and a -correction which implies that we are moving into the relatively poorly observed band (see e.g. Bohlin et al. 1991; O’Connell 1997; Hibbard & Vacca 1997). Detailed studies of how morphological classifications of high-redshift galaxies differ from ground-based observations of nearby systems and the resulting observational biases are currently being made (e.g. Bershady et al. 1994; Odewahn et al. 1996). For this visual study, we present the classifications as is, with the strong caveat that these morphologies can be used to draw conclusions based only on the most broad differences in galaxy type.
For each individual HST observation, we estimate the total magnitude limit to which we can still accurately classify galaxies by eye. For the CL0023+0423 field, this corresponds to or a subsample of 209 galaxies. For the CL1604+4304 field, this corresponds to or a subsample of 205 galaxies (see Sect. 2.1). Galaxies which have been classified as “stellar” in the MDS automated analysis have been excluded. For the specifics of the galaxy classifications, we have adopted the classification procedure used by S97 to morphologically classify galaxies in intermediate redshift clusters. This galaxy classification includes four components : (1) the Revised Hubble type, (2) disturbance index – the perceived asymmetry of the galaxy image, (3) dynamical state – the interpretation of the cause of any observed disturbance, and (4) comments.
For the first component, we have based our visual classifications on the Revised Hubble scheme (e.g. Sandage 1961; Sandage & Bedke 1994). Here, early-type galaxies or spheroids are classified as either ellipticals (E) or S0s. No finer subdivisions are employed because of the limited resolution and modest signal-to-noise in the majority of cases. Because of the difficulty of distinguishing between faint ellipticals and S0 galaxies on CCD images, we have used the classes E/S0 and S0/E to specify those cases which are ambiguous. The order reflects which galaxy type is thought to be more likely. Spirals are, in principle, assigned half-classes (e.g. Sab, Sbc, Scd); however, as noted above, there is normally insufficient information for these delineations to be extremely accurate. Galaxies with obvious bars are indicated with a “B” (e.g. SBa) though, again, this specification is not meant to be inclusive or an accurate measure of the true fraction of barred galaxies in these fields.
In agreement with many previous authors (e.g. Couch et al. 1994; Dressler et al. 1994; Griffiths et al. 1994; Cowie, Hu & Songaila 1995; Abraham et al. 1996a; Lavery et al. 1996; Naim et al. 1997; Brinchmann et al. 1997), we also find a large number of galaxies which are unlike any nearby galaxy classified according to the Revised Hubble Scheme. We have adopted two new classifications which can, for the most part, encompass these galaxies. Firstly, as in S97, those galaxies whose images are too small for a reliable classification are indicated by an “X” for compact. These galaxies can be almost stellar (or point-like) in appearance, but they have been classified as galaxies in the MDS automated analysis (see Sect. 3.1.1). In some cases, the “X” classification may be similar to the “N” classification which describes a class of galaxies which are intermediate between Seyfert galaxies and quasars. Such galaxies have been observed to have a centrally peaked blue source imposed on a faint, extended red component (see e.g. Sandage 1973; Morgan & Dreiser 1983). However, this classification would also describe very distant galaxies where cosmological dimming means that only the high-surface-brightness bulges are visible. Secondly, those galaxies with extremely peculiar shapes are indicated by a “P” for peculiar. This class includes galaxies which appear severely deformed due to interactions or tidal forces; galaxies with double nuclei or other evidence of a merger; “amorphous” galaxies which appear as a high-surface-brightness, smooth, unresolved sheet of light (Sandage & Brucato 1979); and galaxies which simply cannot be classified in the traditional manner. (Examples of galaxies in these classes can be found in Figures 15 and 16.)
The second component is the disturbance index (S97). This parameter ranges from 0 to 4 with the following definitions : 0 – little or no asymmetry, 1 or 2 – moderate or strong asymmetry, and 3 or 4 – moderate or strong distortion. This classification was intended to be objective in that it is independent of the possible reason of the disturbance.
The third component is the “dynamical state.” This parameter was intended to be a subjective and interpretive judgment of the cause of the disturbance and should, therefore, be viewed only as an educated guess. The classes assigned to this parameter are : I – tidal interaction with a neighbor, M – tidal interaction suggesting a merger, T – tidal feature without obvious cause, and C – chaotic. For example, galaxies which were clearly disturbed or which had two nuclei in a common envelope were designated as M for “mergers.” (See S97 for an additional discussion of these classification procedures.) Finally, in the comments, we list the relevant details on the morphology and the nearby surroundings of each galaxy.
All of the galaxies in our HST images were classified independently on a video display by L. Lubin and M. Postman (see Sect. 4.4.3 of Paper I); in addition, expert identifications of all galaxies were provided by Allan Sandage. Most importantly, he reviewed the rather tricky separation between E and S0 galaxies. The independent identifications of the three classifiers were merged by L. Lubin. In most cases, the classifications agree to one class or better. That is, there was agreement within one Hubble class for more than 75% of all galaxies which were visually classed. For the brightest 25% of each sample, this agreement improves to . The comments listed in Table 2 describe those features which have affected the final classification, as well as those features which may have been the subject of a disagreement between the classifiers. In short, the visual morphological classifications provide a good, general indication of the class of the galaxy. Tables 2a–b list the full morphological information described above for the CL0023+0423 and CL1604+4304 cluster fields, respectively. Table 2c gives notes to the parameters in Tables 2a–b.
4 Comparison between Visual and Automated Typing
We use the brightest subsample of galaxies in the CL0023+0423 and CL1604+4304 fields to compare the parameters of the visual classifications (Sect. 3.2) with those from the automated, algorithm-based classifications (Sect. 3.1). Because of the inherent difficulties in performing visual classifications at these redshifts, we use only the general classes of elliptical (E), S0, spiral (Sp), and irregular/peculiar (Irr/Pec) in the following comparisons, even though we have visually typed on a finer scale. Note that this sample of galaxies includes both field and cluster galaxies.
First, we compare the galaxy’s Hubble type with the best-fit model from the MDS automated classification procedure for the combined fields of CL0023+0423 and CL1604+4304. Table 3 shows the percentages of galaxies visually classified as E, S0, Sp, or Irr/Pec which have automated classifications of disk (D), bulge (B), or disk+bulge (D+B). The sample contains a total of 44 E, 54 S0, 140 Sp, and 136 Irr/Pec galaxies. In 62% of the cases, galaxies classified by eye as spheroids (E or S0) have an indication of a bulge component (either B or D+B) in the MLE fittings; however, in 38% of the cases, a pure disk is the best-fit model. For elliptical and S0 galaxies, 32% and 43%, respectively, are classified as a pure disk (see Table 3). The large fraction of pure disk classifications may, in part, be caused by the inability of an law to describe all ellipticals. Studies of early-type galaxies in nearby clusters, from brightest cluster galaxies (BCGs) to dwarf ellipticals, indicate that in many cases a modified Hubble law (Oemler 1976) or a pure exponential profile is more appropriate (e.g. Binggeli, Sandage & Tarenghi 1984; Schombert 1986, 1987; Burkert 1993; Coan et al. 1993; Graham et al. 1996).
In particular, there appears to be a correlation between the power-law in the generalized de Vaucouleurs law and the galaxy luminosity. The de Vaucouleurs law appears to describe well only those galaxies with absolute magnitudes close to and where the region of the profile to be fitted is restricted to approximately (e.g. Binggeli, Sandage & Tarenghi 1984; Schombert 1986, 1987; Burkert 1993; Coan et al. 1993; Graham et al. 1996). Early-type galaxies brighter than this limit, including BCGs, are fit better with an profile, while galaxies fainter than this limit are fit better by a profile which approaches an exponential disk (). Using the median redshift of the galaxies in these fields (; see Figure 3 of Paper I) and the spectral energy distribution of a non-evolving elliptical, we can make a crude conversion to absolute which implies that only of the galaxies in these fields that we have visually classified as early-type galaxies are brighter than . In addition, the MLE fittings cover a significantly larger radial range than that specified above, especially for the early-type galaxies where the half-light (or effective) radii are small (see Figure 8). Both facts may explain the observed relation between the best-fit model and the visual classification of the early-type galaxies.
The automated classifications appear to agree better in the case of late-type galaxies. Here, 95% of all galaxies visually classified as spirals or irregulars contain a clear disk component (either D or D+B) in their best-fit models. In the case of irregulars/peculiars, 81% of all galaxies with this classification are best-fit by a pure disk. This result is further illustrated in Figure 6 which shows the distribution of bulge/(disk+bulge) luminosity ratios for different morphological types. Early-type galaxies have luminosity ratios which are spread between 0 (pure disk) and 1 (pure bulge), whereas late-type galaxies clearly are weighted much more heavily toward ratios of 0.
Figure 7 shows the distributions of axial ratios for 44 ellipticals (E), 54 S0s, and 140 spirals (Sp) from the combined cluster fields. The axial ratios of the best-fit models are plotted. In the cases where a galaxy is fit best by a disk+bulge model, the axial ratio of the brightest component (disk or bulge) is assumed. The distribution of axial ratios for elliptical galaxies show a rapid decline from , while the S0 and spiral distributions are significantly flatter. The occasionally large bin-to-bin variations are due to small number statistics, specifically in the E and S0 samples. For example, the gap in the elliptical distribution at is a fluctuation.
The results of the distant sample are compared with the distribution of axial ratios compiled by Sandage, Freeman & Stokes (1970) using a large sample of nearby field galaxies listed in the Reference Catalogue of Bright Galaxies (de Vaucouleurs & de Vaucouleurs 1964). They examined 168 E, 267 S0, and 254 Sp galaxies. (Irregular galaxies were not included in their analysis.) Their results indicate that ellipticals have only moderate intrinsic flattening, while ordinary spirals and S0s are intrinsically flatter (see Table 1 and Figure 1 of Sandage, Freeman & Stokes 1970). We have used the test applicable for two binned data sets in order to confirm that our axial ratio distributions are consistent with those of the nearby galaxies. For each of the morphological populations (E, S0, and Sp), the nearby and distant samples are consistent with a single distribution function at a level. We have estimated the isophotal limit of the Sandage, Freeman & Stokes (1970) sample to be only magnitudes brighter than ours (see Sect. 2.1). This estimate is calculated by taking into account (1) the cosmological dimming, (2) the appropriate -correction for each galaxy type, and (3) the fact that the sky is magnitudes fainter for space observations; in addition, because a surface brightness limit is not specified in the Reference Catalogue, we have assumed that this limit is roughly the same as that in the Second Reference Catalog; that is, (de Vaucouleurs, de Vaucouleurs & Corwin 1976).
We have also compared our elliptical and S0 distributions to the cluster sample of Andreon et al. (1996). This is a CCD survey of a magnitude-limited sample of galaxies in the central region of Coma. Axial ratios measured at are provided for each galaxy. Applying the corrections listed above, their limit corresponds to an isophote which is just magnitudes fainter than that used in our analysis. We have used a two sample Kolmogorov-Smirnov (KS) test to compare the axial ratios of our distant sample with their sample of 35 E and 35 S0 galaxies. We find that the two distributions are consistent. The probability that the distributions are drawn from the same parent population is 10% for the ellipticals and 20% for the S0s. Therefore, comparing surveys of roughly the same depth in surface brightness, we find that the ellipticity distribution of our distant galaxy sample is consistent with that of local field and cluster galaxies.
Figure 8 shows the distributions of the logarithm of the half-light radius for different morphological types. There is clearly a progression from early to late-type galaxies. Those galaxies visually classified as spheroids are small and compact, with a median half-light radius of 0.03 and 0.09 arcsec for the ellipticals and S0s, respectively. The late-type galaxies are larger with typical half-light radii of 0.37 and 0.17 arcsec for the spirals and irregulars/peculiars, respectively. This trend results from the correlation of galaxy morphology with central concentration and surface brightness. Late-type galaxies, on average, will be less concentrated and less luminous than early-type galaxies (Morgan & Mayall 1957; Doi, Fukugita & Okamura 1993; Abraham et al. 1996a; Smail et al. 1997). The observed range in half-light radii is consistent with results from other fields observed with HST (Griffiths et al. 1994; Casertano et al. 1995).
In Figure 9, we show the distribution of asymmetry parameter (A) for different values of the visually-determined disturbance index (D). There appears to be a good correlation between the two parameters. Our relation between the automated parameter and the visual parameter is very similar to the relation found by the classifiers in Figure 2 of S97. This suggests that it is possible to do a reasonable job at visually judging symmetry without being significantly biased by an individual classifier. As previously mentioned in S97, the disturbance index can do a better job at estimating the individual galaxy asymmetry in the case where a galaxy has a very close companion or lies on a background with a strong gradient. In both cases, the simple, automated parameter used here would overestimate the degree of asymmetry.
In summary, we have shown that there is a reasonable correlation between the parameters of the visual and automated morphological typing. In the following analysis, we therefore use the visual classifications of the brightest subsample of galaxies in each field to quantify the cluster morphology.
5 Cluster Galaxy Populations
In this section, we present a detailed study of the properties of the galaxy populations detected in the two cluster fields. This includes a general discussion of the colors and ages of all (field and cluster) galaxies, in addition to a specific discussion of the morphological composition of the cluster galaxy populations.
5.1 Color–Magnitude Diagrams
We have used the ground-based Keck imaging of the clusters to obtain color information on our HST galaxies. Tables 4a,b lists the corresponding colors of the 209 and 205 galaxies in the CL1604+4304 and CL0023+0423 fields, respectively, which have been visually classified in the HST data (see Sect. 3.2). This information includes the Keck photometric identification number of the corresponding galaxy detected in the ground-based images and the aperture magnitudes (see Sect. 2.2). If the galaxy has a measured redshift, its redshift and the characteristic age as determined from the broad band AB values are listed (see also Sect. 5.2). For more details on the galaxy photometry, spectra, and ages, see Paper II.
The morphologically segregated versus and versus color-magnitude (CM) diagrams of the two cluster fields, CL0023+0423 and CL1604+4304, are presented in Figures 10–13. Because of the better resolution of the HST observations, an individual galaxy in the LRIS image may be associated with more than one galaxy in the corresponding HST image. This occurs in of the galaxies. Only the brightest galaxies in each of these pairs are plotted in the CM diagrams of Figures 10–13; these cases are indicated in the notes to Table 4. Galaxies with measured redshifts are marked in these figures. Foreground and background galaxies are crossed out, while galaxies that are confirmed cluster members, as determined from the velocity analysis of Paper II, are circled. There are 12 confirmed cluster members in each HST field of CL0023+0423 and CL1604+4304. One of the cluster members in CL0023+0423 was not detected in the MDS analysis (Keck # 2166; see Sect. 5.2).
We examine the and colors because, in these bands, we expect to see the largest change in color between a redshift of and for a non-evolving elliptical. At redshifts approaching , we expect for a non-evolving E or S0 galaxy (e.g. Fukugita et al. 1995; Kinney et al. 1996). In both fields, we see red, elliptical cluster members that have . The observed colors are consistent with a passively evolving galaxy population formed several Gyrs ago (see Sect. 5.2 and Paper II). We do not, however, see a very tight color-magnitude relation for the early-type galaxies. Such a relation is characteristic of nearby and intermediate redshift clusters (e.g. Butcher & Oemler 1984; Couch & Newell 1984; Aragón-Salamanca et al. 1991; Luppino et al. 1991; Dressler & Gunn 1992; Dressler et al. 1994; Smail et al. 1994; Stanford et al. 1995, 1997; Ellis et al. 1997). In the case of CL0023+0423, this appears simply to be the result of the small number of ellipticals and S0s present in this cluster field. It is obvious from the morphological classifications that this field is comprised mainly of spirals and irregular/peculiar galaxies (see also Sect. 5.4 and Figure 21). On the other hand, CL1604+4304 contains a significantly larger fraction of early-type galaxies; however, many of these galaxies are at or beyond the completeness limit of the Keck photometric survey. At these faint magnitudes, the photometric errors imply an error in the color which is greater than , indicating that we would be significantly washing out a CM relation whose scatter is typically (e.g. Couch & Newell 1984; Stanford et al. 1995, 1997; Ellis et al. 1997). Indeed, deep imaging reveals tight optical–IR and IR–IR color-magnitude sequences (e.g. ) for the early-type galaxies in this cluster (see Figure 2q of Stanford et al. 1997).
In Figure 14, we show the distributions of colors for various morphological types. This figure includes all of the galaxies that are within the magnitude limits of the photometric survey. There is a clear progression in color between early- and late-type galaxies. As expected, the ellipticals and S0s are redder, on average, than the spirals and irregulars/peculiars. The median color of these distributions are for the bins, respectively. The distributions are broad because we have included galaxies over a wide range in redshift. The inset window in each panel shows the color distributions of the confirmed cluster members. Because of the small numbers, we have combined the data from both clusters, CL0023+0423 at and CL1604+4304 at . Over this narrow range in redshift, we expect the color difference for any morphological type to be less than . Though the numbers are small, the median of the elliptical color distribution appears to be redder than that of the spirals.
5.2 Redshifts and Color Ages of HST Galaxies
In Figures 15 and 16, we show images of the galaxies in the HST fields of CL0023+0423 and CL1604+4304, respectively, that have measured redshifts. There are 41 and 29 galaxies, respectively, with measured redshifts in these cluster fields. The redshift is given in the upper left of each panel; the two numbers at the bottom of each panel indicate the Keck photometric identification number and the MDS object identification number, respectively. In a few cases, some of these galaxies have not been detected in the MDS automated object identification procedure (see Sect. 3.1.1) and, therefore, no MDS identification number is listed. In particular, in the CL0023+0423 field, Keck galaxy numbers 2792, 2166 (a cluster member), 2108, and 2003 are not detected. Each of these galaxies was within of a WFPC2 CCD edge or on the border between two CCDs. Because of the variable PSF in these regions, these galaxies are excluded from the MDS analysis procedure (see ROG). In the CL1604+4304 field, two very compact galaxies, Keck galaxy numbers 1875 and 2515 (at and , respectively; see Figure 14), are not included in the analysis as they were classified as “stellar” in the MDS identification procedure.
As described in Paper II, we use the population synthesis models of Bruzual & Charlot (e.g. Bruzual 1983; Bruzual & Charlot 1993; Bruzual & Charlot 1995) to determine the spectral ages of the galaxies with measured redshifts. Here, “age” refers to the time (in Gyr) since the last period of major star formation. The free parameters in these evolutionary models are the initial mass function (IMF) and the star formation rate (SFR). We chose the traditional Salpeter (1955) IMF with lower and upper mass limits of 0.1 and 125 , respectively. For the SFR, we have chosen an exponentially decreasing SFR of with a timescale Gyr (referred to as “tau0.6” in Paper II). The normalization implies that it would take an infinite amount of time to convert all of the galaxy’s gas into stars (Bruzual 1983). The ages of the galaxies were determined independently using their spectral energy distributions (from the four AB magnitudes derived from the Keck photometric data) and the equivalent widths of features in their spectra. According to the convention of Paper II, the former is referred to as the “color age,” while the latter is referred to as the “spectral age.” The color ages appear to be more reliable, so we present these ages in the following analysis. For details on the choice of the model and a comparison between the two age determinations, see Sect. 4 of Paper II.
In Figure 17, we plot the galaxy color age as determined from the spectral energy distribution versus the galaxy redshift for each cluster field. The morphology of the galaxy is indicated by different symbols (the same symbols used in the color-magnitude diagram; see Figures 10–13). Two points in the CL0023+0423 field and four points in the CL1604+4304 panels have been offset by Gyr to avoid overlapping any of the symbols. This offset is roughly the average of the errors in the color ages (see Table 4). For galaxies at redshifts greater than , it is no longer possible to determine an accurate age from the galaxy colors when their ages exceed Gyr. At this point, the relation used to determine the age from the galaxy colors becomes flat, implying that only lower limits can be placed on the galaxy age. This degeneracy is discussed in Sect. 4 of Paper II (see also Figure 10 of Paper II). In Figure 17, we have used arrows to indicate those ages that are lower limits.
From Figure 17, we see that the majority of ages for the late-type galaxies are Gyr. (These galaxies also have strong O II emission with a median equivalent width of 29 Å; see Paper II.) However, galaxies with ages Gyr are predominately early-type galaxies, most notably in the CL1604+4304 field. This result can also be seen in Figure 18 which shows the distribution of color ages as a function of morphological class for the combined CL0023+0423 and CL1604+4304 fields. 83% (35 out of 42) of the galaxies classified as late-type (spiral or irregular/peculiar) have color ages Gyr. In contrast, 55% (11 out of 20) of the early-type (elliptical and S0) galaxies have color ages of greater than 2 Gyr, and approximately 73% (8 out of 11) of all galaxies with ages greater than 3 Gyr are classified as early-type. The typical error in these percentages is . In addition, Figure 17 shows that cluster galaxies are typically older than field galaxies at similar redshifts. This is due in part to the fact that there are more early-type galaxies in these systems.
5.3 Confirmed Cluster Members
In this section, we present the relation between the galaxy morphology and the spectral features in cluster galaxies. In particular, we highlight the spectra of several cluster members in each of the two fields. The galaxy spectra discussed below are shown in Figures 19 and 20 for clusters CL0023+0423 and CL1604+4304, respectively.
5.3.1 Early-Type Galaxies
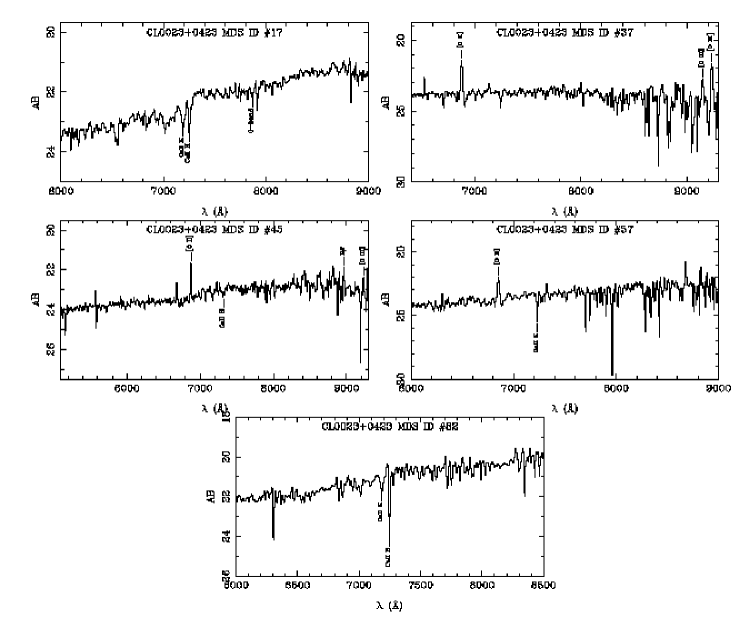
In CL0023+0423, there are four confirmed cluster members which are classified as ellipticals (MDS ID #17, 20, 45, 57), as well as one compact galaxy classified as “X” (MDS ID #155). Three of these five (#17, 20, 115) have typical elliptical spectra with Ca II H and K absorption, G-band absorption, and/or a 4000Å break (e.g. Kennicutt 1992). These galaxies are red with and have subsequent color ages of Gyr. However, the other two galaxies (MDS ID #45, 57) show star-formation features, such as [O II], and possibly H and [O III] emission. Consequently, these galaxies are bluer than the other ellipticals with and for MDS ID #45 and 57, respectively. Each of these galaxies also has a noticable asymmetric disk (see Figure 15) and has been classified as possible mergers (see Table 2a). Because of the fairly strong, narrow emission lines, their spectra appear to be more typical of blue, compact galaxies found at redshifts in previous HST observations (Koo et al. 1994, 1995). The two galaxies have a compact shape, relatively blue color [( and , respectively], and a relatively high luminosity ( and , respectively). All of these properties are consistent with this class of galaxies. Because of such characteristics, H II galaxies have been suggested to be the likely local counterparts of blue compact galaxies (Terlevich 1987; Terlevich et al. 1991; Koo et al. 1994, 1995). The blue colors and strong emission lines suggest a recent, strong burst of star formation. Koo et al. (1995) suggest that such an event would be followed by several magnitudes of fading, resulting in a galaxy with a surface brightness and velocity width which are typical of nearby low-luminosity spheroids (see Binggeli, Sandage & Tammann 1985; Kormendy & Bender 1995). Therefore, blue compact galaxies can be the progenitors of contemporary spheriodal galaxies. The wide range in redshift over which these galaxies are found implies that major star formation episodes have occurred in some spheriods over many Gyrs.
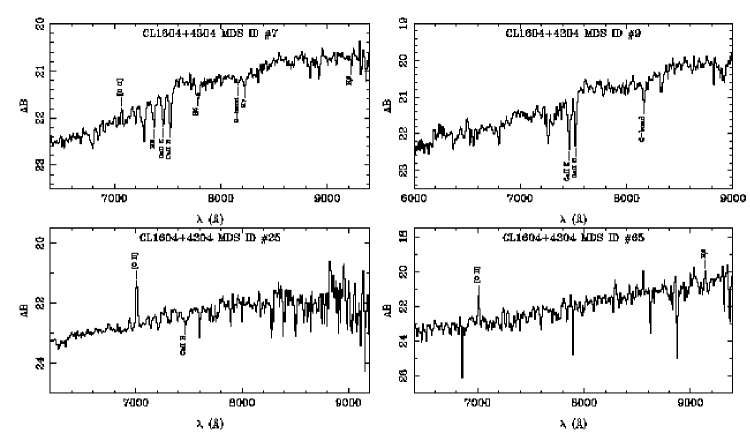
In CL1604+4304, there are three cluster members that are visually classified as ellipticals (MDS ID # 9, 13, 50) and one that is classified as an S0 (MDS ID # 65). All of the ellipticals are red with ; have typical absorption spectra with Ca II H and K absorption, G-band absorption, and a 4000 Å break; and color ages of Gyr (see Sect. 5.2). In every way, these galaxies represent the quiescent early-type cluster population whose behavior is consistent with passive evolution of an old stellar population formed in a exponentially decaying burst of star formation at redshifts of (Aragón-Salamanca et al. 1993; Rakos & Schombert 1995; Dickinson 1995; Steidel et al. 1996; Ellis et al. 1997; Stanford, Eisenhardt & Dickinson 1997; Paper II). The S0 galaxy (MDS ID # 65), on the other hand, is bluer with , a color age of 1.7 Gyr, and spectrum that shows [O II] and H emission. Such star-forming features in spectra of S0 galaxies at intermediate and high redshift are not uncommon (Trager 1997; Poggianti 1997). Indeed, if S0 galaxies form out of spirals through ram pressure stripping (e.g. Larson, Tinsley & Caldwell 1980), galaxy-galaxy interactions (e.g. Moore et al. 1996), or mergers, such spectroscopic evidence of recent or current episodes of star formation should be common in this population. In this case, the morphology, including an asymmetric lens and a close companion (see Figure 16), may also indicate the occurrence of these environmental effects.
5.3.2 Spiral, Irregular and Peculiar Galaxies
In each cluster, there is one galaxy classified as a late-type which is unusually red (see Figures 10–13). At the redshifts of these clusters, we would expect that a non-evolving spiral later than Sb to have colors of . In CL0023+0423, we find a cluster member (MDS ID #82) classified as an Irr/Pec which has and . This galaxy is situated on the border between the PC and a WFPC CCD. Consequently, only the diffuse extension of the galaxy’s disk was detected in the automated MDS procedure and, therefore, visually classified as “P” for peculiar. Though it is possible that this diffuse emission is another galaxy, the system as a whole resembles a peculiar Sa galaxy (see Figure 15). For a non-evolving Sa galaxy, the typical colors at these redshifts would be and (Kinney et al. 1996). Therefore, this cluster galaxy has a color that is close to that of a non-evolving early spiral galaxy, indicating little color evolution. This is also consistent with the galaxy spectrum which shows Ca II H and K and a 4000 Å break and with the survey at the KPNO 4m (see Paper I) which gives for this galaxy (Lubin, Oke & Postman 1998).
Similarly, in the cluster CL1604+4304, there is a spiral galaxy (MDS ID #7) that is quite red, and , and which has an estimated age of 3.8 Gyr. This galaxy has been classified as an Sa. In addition, there is clear evidence of a tidal interaction with a close companion (see Figure 16), indicating that this galaxy has likely suffered an abrupt change in its star-formation rate. A burst and/or truncation of star formation on a short timescale would make a representative galaxy become temporarily blue with emission lines and decay through a “post-starburst” spectral phase to become an optically-red system. Such signatures are often seen in detailed spectroscopic and photometric studies of intermediate redshift clusters (e.g. Aragón-Salamanca et al. 1991; Couch et al. 1994). This galaxy has a spectrum which resembles an “E+A” galaxy. An “E+A” spectrum is dominated by a young stellar population but lacks the strong emission lines characteristic of on-going star formation (Dressler & Gunn 1983; Gunn & Dressler 1988; Zabludoff et al. 1996). Such a spectrum, which shows strong Balmer absorption lines, implies that the galaxy has experienced a brief starburst within the last Gyr (Dressler & Gunn 1983; Couch & Sharples 1987). In this case, the starburst was apparently the result of a galaxy-galaxy interaction since there is clear evidence of a tidal tail.
There are also several normal late-type galaxies in both of these clusters with spectra characterized by [O II] emission and ages less than Gyr (see Sect. 5.2). In addition, we see some disturbed late-types and peculiar galaxies. In CL0023+0423, MDS ID # 37 is a disturbed Sc which contains a double nucleus. Its colors are very blue with and , implying a color age of 0.8 Gyr. Its spectrum contains extremely strong [O II], H, and [O III] emission with equivalent widths of 82.7, 12.4, and 98.6 Å respectively (see Tables 2 and 3 of Paper II). The strong emission and the double nucleus suggest a recent merger. In CL1604+4304, there is another such example, MDS ID # 25. This galaxy contains two compact, high surface-brightness nuclei. It has intermediate colors of and and a color age of 1.7 Gyr. Its spectrum contains strong [O II] emission with an equivalent width of 29 Å, indicating active star formation, plus Ca II K absorption. This system may be an elliptical merger.
In almost all cases, strong O II emission is associated with late-type galaxies. Of all confirmed cluster members in the CL0023+0423 and CL1604+4304 systems, 78% of all galaxies with O II equivalent widths of greater than 15 Å are classified as spiral or irregular/peculiar galaxies. The remaining 22% are classified as ellipticals, though their spectral and photometric properties indicate that they are more similar to blue compact galaxies (see Sect. 5.3.1).
Figures 19 and 20 show the galaxy spectra discussed above for clusters CL0023+0423 and CL1604+4304, respectively. These spectra reveal some of the difficulties associated with faint object spectroscopy. For example, in some cases, poor sky subtraction leaves obvious residual sky lines at 5577 Å, 5891 Å, and 6300,6363 Å in the blue end of the spectrum and at Å in the red end of the spectrum (see a sample sky spectrum in Figure 3 of Paper II). In addition, identified lines in the near-infrared that may not seem convincing due to the large number of residual sky lines in this region are actually obvious in the two-dimensional spectrum (see Sect. 4.2.1 of Paper I for the details of the line identification and redshift determination). The average AB magnitude error in these spectra is at 7500 Å.
As discussed above, the individual spectra show that, in general, the morphologies of the cluster galaxies appear to be consistent with the galaxy types and features (e.g. interactions or mergers) that one would predict based on their spectral features alone.
5.4 Statistical Distribution of Cluster Galaxy Morphologies
One of the primary goals of this investigation is to study the overall morphological composition of each cluster. We cannot, however, examine all the cluster members on an individual basis since our direct redshift measurements are limited in the HST field-of-view. Therefore, in this section, we examine the background-subtracted morphology distribution in each cluster. In order to determine the contribution of the background field galaxies, we use the morphologically classified galaxies from the Medium Deep Survey (MDS; Griffiths et al. 1994) and the Hubble Deep Field (HDF; Williams et al. 1996).
We use the MDS + HDF galaxy number counts in the F814W () filter presented in Abraham et al. (1996a,b). There is a discrepancy in the total MDS number counts plotted in Figure 7 of Abraham et al. (1996a) and those replotted with the total HDF number counts in Figure 6 of Abraham et al. (1996b). Therefore, to avoid any uncertainty, we have used directly the tables of galaxy magnitudes and morphological classifications presented in Table 1 of Abraham et al. (1996a) for the MDS counts and Table 1 of van den Bergh et al. (1996) for the HDF counts. The total effective area for the MDS and HDF survey are and , respectively (R.G. Abraham, private communication). We have used the galaxy classification of S. van den Bergh to split the galaxy counts of the combined MDS and HDF fields into early-types (E/S0), spirals (Sp), and irregulars/peculiars (Irr/Pec). Their Irr/Pec bin, like our bin of the same name, includes mergers, interactions, and those galaxies which are simply unclassifiable according to the standard Hubble scheme. Even though we have used van den Bergh’s galaxy classifications, these classifications and those by R.S. Ellis and the automated “machine” analysis all give consistent morphologically-segregated number counts (Abraham et al. 1996a,b). In order to combine the two field datasets, the resulting number counts of the four divisions (total, E/S0, Sp and Irr/Pec) are modeled as either a power-law or a power-law plus an exponential cut-off, depending on the shape of the distribution. The best-fit analytic functions are integrated over the appropriate magnitude range in order to determine the expected number of background galaxies per unit area for our two cluster fields. This method means that we can accurately model the galaxy counts as a function of magnitude in each morphological bin even though the absolute morphological fractions have changed from the shallower MDS survey to the deeper HDF survey (see Abraham et al. 1996a,b; van den Bergh et al. 1996).
For the cluster field CL1604+4304, we can directly use the background counts determined in the above analysis as the HST observations for this field were also taken in the F814W filter. For example, at , our total magnitude limit for the visual classification (see Sect. 2.1), the foreground/background contamination is . The breakdown in morphology is roughly 22% E/S0, 44% Sp, and 34% Irr/Pec, with typical errors in each class of . We also obtain the appropriate split between ellipticals and S0s in our E/S0 bin by examining the combined MDS+HDF data (Abraham et al. 1996a; van den Bergh et al. 1996). The field ratio of E:S0 ranges from approximately 1:1 at the bright end () to approximately 3:1 at the faint end (). At our magnitude limit, this ratio is roughly 2:1. Therefore, we have adopted this ratio for the following morphological analysis.
Because we are using field data whose galaxies have been analyzed and classified by other observers, we have examined several other sources in order to ensure that our background galaxy estimates are reasonable. Firstly, we have performed a similar analysis on data kindly provided by S.P. Driver of a deep MDS field with independent morphological classifications (Casertano et al. 1995; Driver, Windhorst & Griffiths 1995; Driver et al. 1995). Their galaxy number counts imply a field contamination of and a morphological mix of 17% E/S0, 38% Sabc, and 45% Sd/Irr. The total and the early-type number density of galaxies are consistent, within the errors assuming Poisson statistics, with the analysis of the Abraham et al. data. The data of Driver et al. are binned slightly differently with late-type Sd galaxies being included in the irregular bin. If this segregation had been made in the Abraham et al. data, the percentages would again be consistent within the errors. Finally, we have examined the deep band Keck counts of Smail et al. (1995). These data reach , and the passband is very similar to , with . If we integrate the best-fit power-law function over the same magnitude range, we find , consistent with the above results.
The analysis of the cluster field CL0023+0423 is less straightforward. The HST observations of this field were taken in the F702W () filter; therefore, we need to convert the background galaxy counts in the F814W to the F702W filter. In order to accomplish this, we use the redshift distribution of galaxies in the HDF to determine the median redshift of the field population. The redshift data are being compiled by groups at Caltech and the University of Hawaii Institute for Astronomy (Cohen et al. 1996). The median redshift of the HDF is (). We use the non-evolving spectral energy distributions (SEDs) of Coleman, Wu & Weedman (1980) to calculate the colors of the relevant morphological types at this redshift. We find ( for a galaxies, respectively. These colors are used to make an average conversion from the number counts. At , our total magnitude limit for the visual classification (see Sect. 2.1), the background contamination is , with a morphological mix of roughly 22% E/S0, 44% Sp, and 34% Irr/Pec. In addition, we have confirmed these results by converting the deep band Keck counts (Smail et al. 1995) to by using the Holtzman et al. (1995a) conversion for a galaxy with a characteristic color of (see Figure 3 of Smail et al. 1995). At , we find , consistent with the above results.
The field distributions determined are subtracted from the cluster morphological distributions. In Figure 21, we show the field-subtracted distributions of galaxy morphology for galaxies brighter than in CL0023+0423 and CL1604+4312. We have transferred to the cluster rest frame by using the observed or total magnitudes (see Lubin 1996 for details on such a transformation). The -correction at the cluster redshift and the rest-frame or color are computed by convolving the non-evolving SEDs of Coleman, Wu & Weedman (1980) for each morphological type with the system filter bandpasses (see also Frei & Gunn 1994; Fukugita et al. 1995; Kinney et al. 1996). For both clusters and all galaxy types, this absolute magnitude limit is equal to or less than the magnitude limit down to which we have visually classified galaxies. Galaxies detected in the PC have not been included in this analysis.
The most obvious result in Figure 21 is the strikingly different distribution of morphologies between the two cluster fields. CL0023+0423 is dominated by spiral galaxies, while CL1604+4304 is composed mainly of early-type galaxies. The general properties of these field-corrected distributions are quite robust. We have confirmed this by, firstly, varying the magnitude and morphological mix of the background distribution based on the variations in the values of the field data discussed above. This includes both the uncertainty in the E/S0 split and the possible range in the conversion from the to field counts. Secondly, we have examined the effect of the -correction on these distributions by using an evolving spectral energy distribution, rather than the assumed no-evolution models (see above). The evolving SED is derived from the adopted Bruzual & Charlot model (see Sect. 5.2). For each galaxy type, we have determined the appropriate age of the model from the actual observational results (see Figure 17). We find that variations of both kinds do make a small quantitative difference in the absolute numbers, especially in those bins which contain relatively few galaxies. For example, the elliptical bin in the cluster CL0023+0423 contains galaxies. We know, however, that there are at least four confirmed cluster members which have been classified as an elliptical (see Table 2 and Sect. 5.3). Though we are consistent with Poisson statistics at a 1.6- level, variations of this order can also be produced by the uncertainty in the adopted field distribution and the -correction. However, the qualitative behavior of the two distributions remains the same even if we adopt the largest deviations in these two quantities.
CL0023+0423 has a galaxy population that is more typical of the field. The numbers from the statistical analysis are consistent with 100% of the galaxies in this cluster being normal spirals; however, we know that, in the HST field-of-view, there are at least three (out of 12) confirmed cluster members which have both the morphological and spectral characteristics of an elliptical (see Sect. 5.3.1). If we assume that the errors in the total and field galaxy counts are due to Poisson fluctuations, a spiral fraction as low as 55% (1-) could be possible, completely consistent with the spectral results.
CL1604+4304, in contrast, has a morphological composition which is more characteristic of a normal, present-day rich cluster. Early-type galaxies comprise of all galaxies in the central of this cluster. The proportion of S0 galaxies and ellipticals is 48% and 28%, respectively. This implies a ratio S0/E of which is consistent with galaxy populations found in local clusters. Dressler (1980a) found an average value of S0/E for a sample of 11 clusters at . The survey included all galaxies brighter than with and . We note that the exact S0/E ratio is far from certain because of the difficulty in distinguishing between elliptical and S0 galaxies at this redshift (see Sect. 3.2 and Discussion).
The fraction of S0 galaxies in CL1604+4304 is higher than those found in recent studies of rich, intermediate-redshift clusters at . Classifiers of these cluster galaxies find elliptical fractions that are comparable to present-day clusters; however, the S0 fractions are smaller than nearby cluster populations by a factor . The ratios of S0/E for these intermediate-redshift clusters are typically less than 0.5 (D97). Of course, the results from our survey and that of D97 depend strongly on the adopted ratio of E:S0 in the field population. The survey of D97 reaches a brighter limiting magnitude of . For their morphological analysis, the authors have chosen a lower field ratio of . If we had adopted a similar mix, we would find a ratio of S0/E of , still higher than that found by D97. However, classifications of field galaxies at seem to indicate field ratios of E:S0 which are greater than 2:1 (van den Bergh et al. 1996).
The morphological results support the conclusions of the dynamical analysis presented in Paper II. This study also indicates that the two clusters are very different in nature (see Paper II). CL0023+0423 consists of two substructures with mean redshifts of 0.8274 and 0.8453 and velocity dispersions of and , respectively. The two systems are separated in velocity by approximately 2922 and are separated in the plane of the sky by kpc. The virial and projected mass estimates are and , respectively, for the low dispersion substructure and and , respectively, for the high dispersion substructure (Paper II). The velocity dispersions, masses, and morphological composition indicate that these systems are similar to local groups of galaxies (e.g. Ramella, Geller & Huchra 1989; Zabludoff & Mulchaey 1997 and references therein). Though this may be a chance projection, the dynamical and morphological evidence may imply that we are seeing the merger of two spiral-dominated galaxy groups (see Lubin, Postman & Oke 1998a).
On the other hand, CL1604+4304 has a mean redshift of 0.8967 and a velocity dispersion of (Paper II). The velocity histogram is consistent with a Gaussian distribution, implying that the cluster is already well-formed and relaxed. The virial and projected mass estimators give and , respectively. Furthermore, this cluster was detected in X-rays by ROSAT with a bolometric X-ray luminosity of (Castander et al. 1994). The X-ray–optical properties of this cluster are consistent with the local relation (Mushotzky & Scharf 1997). The velocity dispersion, cluster mass, X-ray luminosity, and morphological composition are all consistent with Abell richness class 2 and 3 clusters (Dressler 1980a; Bahcall 1981; Struble & Rood 1991; Mushotzky & Scharf 1997).
6 Discussion
The most intriguing result of this study is the striking difference in the statistical morphological distributions of CL0023+0423 and CL1604+4304. These distributions indicate that CL0023+0423 has a galaxy population which is more typical of the field. The numbers are consistent with 100% of the galaxies in this cluster being normal spirals (though the spectral results indicate that there are at least a few ellipticals in this system; see below). The velocity analysis reveals that this cluster actually consists of two smaller systems with individual dispersions of 158 and and separated by . The velocity dispersion and dynamical mass of each system are more typical of galaxy groups and poor clusters. The dynamical analysis of this two-body system is consistent with both a bound and unbound solution (Lubin, Postman & Oke 1998a); therefore, we cannot say for certain that these two systems are in the process of merging. However, high-redshift groups of galaxies such as these are likely to be the building blocks of intermediate-redshift clusters, most certainly if theories of hierarchial clustering are valid. It seems reasonable that, if such systems were to combine to form a cluster themselves, rather than simply be accreted by a larger system, they may be the progenitors of open clusters at intermediate redshift. These clusters are irregular, loose, and presumably dynamically young. Studies of this class of clusters at indicate that they have elliptical fractions between and total early-type (E + S0) fractions between (D97; Stanford, Eisenhardt & Dickinson 1997; Andreon, Davoust & Heim 1997; Couch et al. 1988).
The CL0023+0423 system does contain three (out of twelve) galaxies which are morphologically classified as either an elliptical or a compact galaxy and which have photometric and spectral properties indicating that it formed at a redshift of . The overall statistical distribution of morphologies in CL0023+0423 implies that early-type galaxies may comprise only of the total population, consistent with the 25% from the confirmed group members in the HST field-of-view. If we try to improve the statistics by examining all confirmed cluster members in the larger LRIS field-of-view, we still find that only 17% (4 out of 24) of the galaxies have a typical elliptical-like, absorption spectrum. Two-thirds of all confirmed members have very strong O II emission (equivalent widths of typically much greater than 10 Å; see Paper II). Given the correlation between active star formation and galaxy morphology (see Sect. 5.3), this implies an early-type population of 33% or less, consistent with the numbers discussed above. If these groups do combine to make irregular clusters observed at intermediate redshifts, a non-negligible fraction of early-type galaxies may be forming between redshifts of and . Therefore, we would expect to see a significant fraction of early-type galaxies in open clusters that have spectral features characteristic of star formation activity within the last Gyr. Preliminary spectral studies of a sample of 10 intermediate-redshift clusters, including both open and compact clusters, indicate that the bulk of the early-type population has passive spectra with no signs of current or recent star formation; however, there is a non-negligible fraction which show post-starburst spectral features (Poggianti 1997).
In addition, the modest early-type fractions in both galaxy groups of the CL0023+0423 system imply that the strong correlation between velocity dispersion and early-type fraction observed in nearby groups of galaxies (Zabludoff & Mulchaey 1997) does not exist at high redshift. Based on the local relation, we would expect an early-type fraction of for our low dispersion system of and for our high dispersion system of (see Figure 7 of Zabludoff & Mulchaey 1997); however, the spectroscopic results suggest that the observed fractions may be as low as (2 out of 7) and (2 out of 17) for the low and high dispersion systems, respectively. We note that the a priori probability of finding only two early-types out of 17 galaxies when the probability for success is 55% is an unlikely . If the two groups of CL0023+0423 are typical of galaxy groups at high redshift, and they are the progenitors of local groups, there appears to be a progression in the group morphological composition between redshifts of and the present epoch. At high redshift, there is no apparent correlation between velocity dispersion and early-type fraction; galaxy groups of varying mass all appear to have relatively low fractions of spheroids. This result may indicate that there is continual elliptical and S0 formation at redshifts of and that these galaxies will form only in relatively massive regions of the universe.
CL1604+4304 has a morphological composition which is characteristic of a normal, present-day rich cluster. From the statistical distribution of morphologies, we find that early-type galaxies comprise of all galaxies in the central of this cluster. The dynamical analysis indicates that this system is already well-formed and relaxed. The velocity dispersion, cluster mass and X-ray luminosity are consistent with an Abell richness class 2 or 3 cluster (Dressler 1980a; Bahcall 1981; Zabludoff, Huchra & Geller 1990; Struble & Rood 1991; Castander et al. 1994; Mushotzky & Scharf 1997). Of the early-type cluster population, the ratio of S0 galaxies to ellipticals is , consistent with galaxy populations found in local clusters (Dressler 1980a). The fraction of S0 galaxies is higher than those found in recent studies of rich, intermediate-redshift clusters at . The studies of D97 indicate elliptical fractions which are comparable to present-day clusters; however, the S0 fractions are smaller than nearby cluster populations by a factor . The ratios of S0/E for these intermediate-redshift clusters are typically less than 0.5 (D97). These findings imply that the elliptical population is already in place by ; in contrast, a large fraction of the S0 galaxies are still forming between redshifts of and , presumably out of the excess of late-type galaxies. However, these morphological fractions are far from certain. For example, Stanford et al. (1997) have independently studied the HST data for 19 galaxy clusters with redshifts between . Their sample includes CL1604+4304 and eight of the ten intermediate-redshift clusters studied by D97. They find that these clusters contain early-type (E+S0) fractions that are consistent with the fraction that we find in CL1604+4304; in addition, the fraction remains roughly constant over their entire redshift range (Stanford et al. 1997). This result is inconsistent with that of D97 as it implies that there is no decline in the frequency of early-type cluster galaxies with redshift (see also Andreon, Davoust & Heim 1997; Andreon 1998). This decline would be expected if, as suggested by D97, there exists an elliptical population which remains effectively constant and a S0 population which is increasingly depleted with redshift because it has not yet formed from the late-type galaxies.
If the morphological fractions of D97 are indeed correct, it would imply that CL1604+4304 is not the progenitor of the intermediate-redshift clusters that they have studied; it may, however, be a cluster which formed at a much earlier epoch with enough time to create a comparable fraction of S0 galaxies. If a similar morphological transformation is taking place in this cluster, we would expect a population of ellipticals that have passive spectra and a population of S0 galaxies that exhibit spectral indications of recent and/or current star formation. Though the number of confirmed cluster members is small, there are three ellipticals and one S0 galaxy in this cluster. The three ellipticals all have typical red, passive spectra and color ages implying the last major period of star formation was greater than 3.5 Gyr ago (a formation epoch of ). The S0 galaxy, on the other hand, is bluer, has a color age of 1.7 Gyr, and has a spectrum that shows [O II] and H emission. Though the numbers are too small to say anything with certainty, the morphology–spectral properties are consistent with a cluster that has an old population of ellipticals and an evolving population of S0 galaxies. We can try to examine this behavior over the larger LRIS field-of-view by sorting all of the cluster members according to their spectral characteristics. If we make the broad, and not completely valid, assumption that (1) all galaxies with a typical K star absorption spectrum are ellipticals, (2) all galaxies with a spectrum that contains K star plus emission features are S0 galaxies, and (3) all galaxies with a pure emission-line spectrum are spiral and irregular/peculiar galaxies, we find the percentages of elliptical and S0 galaxies are 32% (7 out of 22) and 36% (8 out of 22), respectively. Though this is not formally correct as the spectral properties of a particular morphological class can vary from galaxy to galaxy, these numbers are consistent with the statistical distribution of galaxy morphologies in this cluster.
The morphology–density relation is observed in both open and compact clusters in the local universe (see Introduction); however, this is apparently not the case at intermediate redshifts. D97 find that the morphology–density relation is qualitatively similar in compact clusters at intermediate redshifts, but completely absent in the open clusters at a similar epoch. The authors suggest that this result implies that morphological segregation occurs hierarchically over time. The richer, denser clusters, which obviously form at an early epoch, are affected first. The smaller, less dense systems, which are younger dynamically, form later in time and, therefore, the segregation has not proceeded as far. That is, groups which make up the irregular, open clusters at intermediate redshifts have not undergone significant morphological segregation to establish a morphology–density relation; however, by the present epoch, the groups which make up the local open clusters (such as the Virgo and Hercules cluster) would have had sufficient time to establish such a correlation. If this hypothesis is correct, clusters at high redshift should show little or no morphological segregation. In light of this, we are in process of studying the morphology–density relation for our sample of clusters at (Lubin, Postman & Oke 1998b).
7 Conclusions
As part of an observational program to study distant clusters of galaxies, we have examined the morphological properties of the galaxies in two cluster fields, CL0023+0423 at and CL1604+4304 at , using high-resolution HST images. The morphology of the individual galaxies have been studied by two methods; 1) a quantitative description of the structural properties of galaxies per cluster field is provided by the Medium Deep Survey automated data reduction and “bulge+disk” object classification software; 2) the brightest subsample of galaxies per cluster field are assigned a more detailed morphological description through a visual classification based on the revised Hubble scheme. A comparison between the two techniques shows that there is a reasonable correlation between the parameters of the automated and visual classifications (see also Lahav et al. 1995). To investigate the morphological composition of the two galaxy clusters, we have used the visual classifications of the brightest subsample of galaxies in each field. Our main conclusions are summarized below.
-
1.
The color-magnitude diagrams and the color histograms of all (field + cluster) galaxies in the two cluster field show a clear progression in color between early- and late-type galaxies. As expected, the elliptical and S0 galaxies are redder, on average, than the spirals and irregulars. This trend is also apparent in the color ages which represent the time since the last period of major star formation. 83% of the galaxies classified as late-type (spiral or irregular/peculiar) have color ages less than 2 Gyr. In contrast, 55% of the galaxies classified as early-type have color ages of greater than 2 Gyr, and 73% of all galaxies with ages greater than 3 Gyr are classified as early-type. In addition, cluster galaxies are typically older than field galaxies at similar redshifts. This is due in large part to the fact that there are more early-type galaxies in these systems.
-
2.
We see a distinct correlation between the galaxy morphology and the corresponding spectral features. We have specifically examined this relation for those galaxies which are confirmed cluster members. The majority of galaxies that are visually classified as ellipticals show spectra which are typical of nearby, red elliptical galaxies. However, some of the galaxies visually classified as ellipticals turn out to be blue compact galaxies with spectra characterized by fairly strong, narrow emission lines. Normal late-type galaxies typically have spectra with blue colors and [O II] emission, while the presence of strong star-formation features, such as extremely high equivalent width [O II], , and/or [O III] emission, is always accompanied by peculiar morphologies which suggest recent mergers or interactions.
-
3.
Despite being at very similar redshifts, the two cluster systems contain very different galaxy populations as indicated by their background-subtracted morphological distributions. We have examined all galaxies brighter than in the central of the cluster. CL0023+0423 has a galaxy population which is more typical of groups and the field population. The numbers from the statistical distribution are consistent with almost all of the galaxies being normal spirals. The spectral results support these numbers, independently indicating spiral fractions of 66% or more. CL1604+4304, in contrast, has a morphological composition which is characteristic of a normal, present-day rich cluster. Early-type galaxies comprise 76% of all galaxies in this region. In this population, the ratio of S0 galaxies to ellipticals is , consistent with galaxy populations found in local clusters (Dressler 1980a).
-
4.
The morphological results support the conclusions of the dynamical analysis presented in Paper II. CL0023+0423 is apparently two independent systems separated in velocity by . The velocity dispersions and implied masses indicate that these systems are similar to local galaxy groups or poor clusters. Though this may be a chance projection, the dynamical and morphological evidence may indicate that we are seeing the merger of two spiral-dominated galaxy groups (see Lubin, Postman & Oke 1998a). The velocity histogram of CL1604+4304, on the other hand, is consistent with a Gaussian distribution, implying that this system formed at an earlier epoch and is already relaxed. The velocity dispersion and implied mass of this system are consistent with an Abell richness class 2 or 3 cluster.
We thank the anonymous referee for his thorough review of this paper. Alan Dressler, Chris Fassnacht, and Ian Smail are thanked for useful discussions, comments, and material aids to this paper. It is also a great pleasure to thank Allan Sandage for his generous gift of time and invaluable expertise to this project. The W.M. Keck Observatory is operated as a scientific partnership between the California Institute of Technology, the University of California, and the National Aeronautics and Space Administration. It was made possible by generous financial support of the W. M. Keck Foundation. LML graciously acknowledges support from a Carnegie Fellowship. This research was supported in part by HST GO analysis funds provided through STScI grant GO-06000.01-94A and HST Archival grant 7536.
References
- (1) Abell, G.O. 1958, ApJS, 232, 689
- (2) Abraham, R.G., van den Bergh, S., Glazebrook, K., Ellis, R.S., Santiago, B.X., Surma, P. & Griffiths, R.E. 1996a, ApJ, 107, 1
- (3) Abraham, R.G., Tanvir, N.R., Santiago, B.X., Glazebrook, K., Ellis, R.S. & van den Bergh, S. 1996b, MNRAS, 279, L47
- (4) Andreon, S., Davoust, E., Michard, R., Nieto, J.L., Poulain, P. 1996, A&AS, 116, 429
- (5) Andreon, S., Davoust, E. & Heim, T. 1997, A&A, 323, 337
- (6) Andreon, S. 1998, ApJ, in press, astro-ph/9802097
- (7) Aragón-Salamanca, A., Ellis, R.S. & Sharples, R.M. 1991, MNRAS, 248, 128
- (8) Aragón-Salamanca, A., Ellis, R.S., Couch, W.J. & Carter, D. 1993, MNRAS, 262, 764
- (9) Bahcall, N.A. 1975, ApJ, 198, 249
- (10) Bahcall, N.A. 1981, ApJ, 247, 787
- (11) Bershady, M.A., Hereld, M., Kron, R.G., Koo, D.C., Munn, J.A. & Majewski, S.R. 1994, AJ, 108, 870
- (12) Bertin, E. & Arnouts, S. 1996, A&A, 117, 393
- (13) Binggeli, B., Sandage, A. & Tarenghi, M. 1984, AJ, 89, 64
- (14) Binggeli, B., Sandage, A. & Tammann, M. 1985, AJ, 90, 1681
- (15) Bohlin, R.C., Cornett, R.H., Hill, J.K., Hill, R.S., Landsman, W.B., O’Connell, R.W., Neff, S.G., Smith, A.M. & Stecher, T.P. 1991, ApJ, 368, 12
- (16) Bower, R.G., Lucey, J.A. & Ellis, R.S. 1992a, MNRAS, 254, 589
- (17) Bower, R.G., Lucey, J.A. & Ellis, R.S. 1992b, MNRAS, 254, 601
- (18) Brinchmann, J., Abraham, R., Schade, D., Tresse, L., Ellis, R.S., Lilly, S.J., Le Fevre, O., Glazebrook, K., Hammer, F., Colless, M., Crampton, D. & Broadhurst, T. 1997, ApJ, in press, astro-ph/9712060
- (19) Bruzual, A.G. 1983, ApJ, 273, 105
- (20) Bruzual, A.G. & Charlot, S. 1993, ApJ, 405, 538
- (21) Bruzual, A.G. & Charlot, S. 1995, private communication
- (22) Burkert, A. 1993, A&A, 278, 23
- (23) Butcher, H. & Oemler, A. 1978, ApJ, 226, 559
- (24) Butcher, H. & Oemler, A. 1984, ApJ, 285, 426
- (25) Carlberg, R.G., Yee, H.K.C., Ellingson, E., Abraham, R., Gravel, P., Morris, S. & Pritchet, C.J. 1996, ApJ, 462, 32
- (26) Casertano, S. et al. 1995, ApJ, 453, 599
- (27) Castander, F.J., Ellis, R.S., Frenk, C.S., Dressler, A. & Gunn, J.E. 1994, ApJ, 424, L79
- (28) Caon, N., Capaccioli, M. & D’Onofrio, M. 1993, MNRAS, 265, 1013
- (29) Cohen, J.G., Cowie, L.L., Hogg, D.W., Songaila, A., Blandford, R., Hu, E. & Shopbell, P. 1996, ApJ, 471, L5
- (30) Coleman, G.D., Wu, C.C. & Weedman, D.W. 1980, ApJS, 43, 393
- (31) Couch, W.J. & Newell, E.B. 1984, ApJS, 56, 143
- (32) Couch, W.J. & Sharples, R.M. 1987, MNRAS, 229, 423
- (33) Couch, W.J., Ellis, R.S., Sharples, R.M. & Smail, I. 1994, ApJ, 430, 121
- (34) Couch, W.J., Barger, A.J., Smail, I., Ellis, R.E. & Sharples, R.M. 1998, MNRAS, in press, astro-ph/9711019
- (35) Cowie, L.L., Hu, E.M. & Songailia, A. 1995, Nat, 377, 603
- (36) Dickinson, M. 1995, in Fresh Views on Elliptical Galaxies, ed. A. Buzzoni, ASP Conference Series.
- (37) Doi, M., Fukugita, M. & Okamura, S. 1993, MNRAS, 264, 832
- (38) Dressler, A. 1978, ApJ, 226, 55
- (39) Dressler, A. 1980a, ApJ, 236, 351
- (40) Dressler, A. 1980b, ApJS, 42, 565
- (41) Dressler, A. & Gunn, J.E. 1983, ApJ, 270, 7
- (42) Dressler, A. & Gunn, J.E. 1992, ApJS, 78, 1
- (43) Dressler, A., Oemler, A., Butcher, H.R. & Gunn, J.E. 1994, ApJ, 430, 107
- (44) Dressler, A., Oemler, A., Couch, W.J., Smail, I., Ellis, R.E., Barger, A., Butcher, H., Poggianti, B.M. & Sharples, R.M. 1997, ApJ, 490, 577 (D97)
- (45) Driver, S.P., Windhorst, R.A., Ostrander, E.J., Keel, W.C., Griffiths, R.E. & Ratnatunga, K.U. 1995, ApJ, 449, L23
- (46) Driver, S.P., Windhorst, R.A. & Griffiths, R.E. 1995, ApJ, 453, 48
- (47) Ellis, R.S., Smail, I., Dressler, A., Couch, W.J., Omeler, A., Butcher, H. & Sharples, R. 1997, ApJ, 483, 582
- (48) Frei, Z. & Gunn, J.E. 1995, AJ, 108, 1476
- (49) Fukugita, M., Shimasaku, K. & Ichikawa, T. 1995, PASP, 107, 945
- (50) Graham, A., Lauer, T.R., Colless, M. & Postman, M. 1996, ApJ, 465, 534
- (51) Griffiths, R.E. et al. 1994, ApJ, 435, L19
- (52) Gunn, J. E., Hoessel, J. G. & Oke, J. B. 1986, ApJ, 306, 30
- (53) Hibbard, J.E. & Vacca, W.D. 1997 AJ, 114, 1741
- (54) Holtzman, J. et al. 1995a, PASP, 107, 156
- (55) Holtzman, J. et al. 1995b, PASP, 107, 106
- (56) Hubble, E.P. 1936, Realm of the Nebulae, Yale University Press
- (57) Kennicutt, R.C. 1992, ApJS, 79, 255
- (58) Kinney, A.L., Calzetti, D., Bohlin, R.C., McQuade, K., Storchi-Bergmann, T. & Schmitt, H.R. 1996, ApJ, 467, 38
- (59) Lahav, O., Naim, A., Buta, R.J., Corwin, H.G., De Vaucouleurs, G., Dressler, A. & Huchra, J.P. 1995, Sci, 267, 859
- (60) Landolt, A. U. 1992, AJ, 104, 340
- (61) Kormendy. J. & Bender, R. 1993, in Dwarf Galaxies, ESO/OHP Workshop, eds. G. Meylan & P. Pringniel (Garching : ESO), p. 161
- (62) Koo, D.C, Bershady, M.A. & Wirth, G.D. 1994, ApJ, 427, L9
- (63) Koo, D.C, Guzmán, R., Faber, S.M., Illingworth, G.D., Bershady, M.A. Kron, R.G. & Takamiya, M. 1995, ApJ, 440, L49
- (64) Larson, R.B., Tinsley, B.M. & Caldwell, C.N. 1980, ApJ, 237, 692
- (65) Lavery, R.J., Seitzer, P., Suntzeff, N.B., Walker, A.R. & Da Costa, G.S. 1996, ApJ, 467, L1
- (66) Lubin, L.M. 1996, AJ, 112, 23
- (67) Lubin, L.M., Oke, J.B. & Postman, M. 1998, AJ, in preparation
- (68) Lubin, L.M., Postman, M. & Oke, J.B. 1998a, AJ, to be submitted
- (69) Lubin, L.M., Postman, M. & Oke, J.B. 1998b, AJ, in preparation
- (70) Luppino, G.A., Cooke, B.A., McHardy, I.M. & Ricker, G.R. 1991, AJ, 102, 1
- (71) Millington, S.J.C. & Peach, J.V. 1990, MNRAS, 242, 112
- (72) Molinari, E., Banzi, M., Buzzoni, G., Chincarini, G. & Pedrana, M.D. 1994, A&AS, 103, 245
- (73) Moore, B., Katz, N., Lake, G., Dressler, A. Oemler, A. 1996, Nat, 379, 613
- (74) Morgan, W.W. & Mayall, N.U. 1957, PASP, 69, 291
- (75) Morgan, W.W. & Drieser, R.D. 1983, ApJ, 269, 438
- (76) Mushotzky, R.F. & Scharf, C.A. 1997, ApJ, 482, L13
- (77) Naim, A., Lahav, O., Buta, R.J., Corwin, H.G., De Vaucouleurs, G., Dressler, A., Huchra, J.P., van den Bergh, S., Raychaudhury, S., Sodre, L. & Storrie-Lombardi, M.C. 1995a, MNRAS, 274, 1107
- (78) Naim, A., Lahav, O., Sodre, L. & Storrie-Lombardi, M.C. 1995b, MNRAS, 275, 567
- (79) Naim, A., Ratnatunga, K.U. & Griffiths, R.E. 1997 ApJ, 476, 510
- (80) O’Connell, R.W. 1997, to appear in The Ultraviolet Universe at Low and High Redshift, ed. W.H. Waller
- (81) Odewahn, S.C., Windhorst, R.A., Driver, S.P. & Keel, W.C. 1996, ApJ, 472, 13
- (82) Oke, J. B. et al. 1995, PASP, 107, 375
- (83) Oke, J. B., Gunn, J. E. & Hoessel, J. G. 1996, AJ, 111, 29.
- (84) Oke, J. B., Postman, M. & Lubin, L.M. 1998, AJ, submittted (Paper I)
- (85) Oemler, A. 1976, ApJ, 209, 693
- (86) Oemler, A., Dressler, A. & Butcher, H. 1997, AJ, 474, 561
- (87) Poggianti, B.M. 1997, astro-ph/9712034
- (88) Postman, M. & Geller, M.J. 1984, ApJ, 281, 95
- (89) Postman, M., Lubin, L. M., Gunn, J. E., Oke, J. B., Hoessel, J. G., Schneider, D. P. & Christensen, J. 1996, AJ, 111, 615
- (90) Postman, M., Lubin, L.M. & Oke, J.B. 1998, AJ, submitted (Paper II)
- (91) Rakos, K.D. & Schombert, J.M. 1995, ApJ, 439, 47
- (92) Ramella, M., Geller, M.J. & Huchra, J.P. 1989, ApJ, 344, 57
- (93) Ratnatunga, K.U., Griffiths, R.E., Casertano, S., Neuschaefer, L.W. & Wyckoff, E.W. 1994, AJ, 108, 2362
- (94) Ratnatunga, K.U., Griffiths, R.E., Neuschaefer, L.W. & Ostrander, E.J. 1995, in Proc. HST Calibration Workshop II, eds. A. Koratkar and C. Leitherer, p. 351
- (95) Ratnatunga, K.U., Ostrander, E.J. & Griffiths, R.E. 1997, ApJ, in preparation (ROG)
- (96) Salpeter, E.E. 1955, ApJ, 121, 161
- (97) Sandage, A. 1961, The Hubble Atlas, The Carnegie Institution of Washington Publication
- (98) Sandage, A. 1972, ApJ, 176, 21
- (99) Sandage, A. 1973, ApJ, 180, 687
- (100) Sandage, A., Freeman, K.C. & Stokes, N.R. 1970, ApJ, 160, 831
- (101) Sandage, A. & Brucato, R. 1979, AJ, 84, 472
- (102) Sandage, A. & Bedke, J. 1994, The Carnegie Atlas of Galaxies, The Carnegie Institution of Washington Publication
- (103) Schombert, J.M. 1986, ApJS, 60, 603
- (104) Schombert, J.M. 1987, ApJS, 64, 643
- (105) Smail, I., Ellis, R.S. & Fitchett, M.J. 1994, MNRAS, 270, 245
- (106) Smail, I., Hogg, D.W., Yan, L. & Cohen, J.G. 1995, ApJ, 449, 105
- (107) Smail, I., Dressler, A., Couch, W.J., Ellis, R.E., Oemler, A., Butcher, H.R. & Sharples, R.M. 1997, ApJS, 110, 213 (S97)
- (108) Stanford, S.A., Eisenhardt, P.R.M. & Dickinson, M. 1995, ApJ, 450, 512
- (109) Stanford, S.A., Eisenhardt, P.R.M. & Dickinson, M. 1997, ApJ, 492, 461
- (110) Steidel, C.C., Giavalisco, M., Pettini, M., Dickinson, M. & Adelberger, K.L. 1996, ApJ, 462, L17
- (111) Struble, M.F. & Rood, H.J. 1991, ApJS, 77, 363
- (112) Terlevich, R. 1987, in High Redshift and Primeval Galaxies, eds. J. Bergeron et al. p. 281
- (113) Terlevich, R., Melnick, J., Masegosa, J., Moles, M. & Copetti, M.V.F. 1991, A&AS, 91, 285
- (114) Trager, S.C. 1997, PhD Thesis, University of California, Santa Cruz
- (115) Valdes, F. 1982, Proc. SPIE, 331, 465
- (116) Vaucouleurs, G. de & Vaucoulers, A. de 1964, A Reference Catalogue of Bright Galaxies, University of Texas Press
- (117) Vaucouleurs, G. de, Vaucoulers, A. de & Corwin, H.G. 1976, The Second Reference Catalogue of Bright Galaxies, University of Texas Press
- (118) van den Bergh, S., Abraham, R.G., Ellis, R.S., Tanvir, N.R., Santiago, B.X. & Glazebrook, K. 1996, AJ, 112, 359
- (119) Williams, R.E. et al. 1996, AJ, 112, 1335
- (120) Zabludoff, A.I., Zaritsky, D., Lin, H., Tucker, D., Hashimoto, Y., Shectman, S.A., Oemler, A. & Kirshner, R.P. 1996, ApJ, 466, 104
- (121) Zabludoff, A.I., Huchra, J.P. & Geller, M.J. 1990, ApJS, 74, 1
- (122) Zabludoff, A.I. & Mulchaey, J.S. 1997, ApJ, in press, astro-ph/9708132
Table 1c : Notes on Parameters listed in Tables 1a–b
| Column | Parameter | Units | Comments |
|---|---|---|---|
| 1 | MDS ID | MDS object identifieraaOriginal identification number from the MDS reduction pipeline. Those numbers which are excluded indicate detected objects which were classified as stars or which did not reach the required signal-to-noise (see Sect. 3.1.1). | |
| 2 | Model # | MLE model numberbbMDS model number : 1, disk; 2, bulge; 3, disk+bulge. | |
| 3 | Total number of pixels in selected regioncc is the total number of usable pixels in the selected 64 or 128–pixel square region around each object; is the number of pixels which are more than 1- above the estimated local sky background (see Sect. 3.1.1). | ||
| 4 | Total number of pixels in selected region above 1-cc is the total number of usable pixels in the selected 64 or 128–pixel square region around each object; is the number of pixels which are more than 1- above the estimated local sky background (see Sect. 3.1.1). | ||
| 5 | Number of parameters in MLE modelddThe number of parameters in the fit which actually vary. A maximum of 12 parameters are fit, though in most cases one or more parameters are held fixed (see e.g. table note m). | ||
| 6 | Chip # | WFPC2 CCD numbereeCCD chip number : PC = 1; WFC = 2,3,4. | |
| 7 | X | Pixels | X coordinate of centroid of MLE ModelffThe mean error between the model centroid and the actual centroid of the object image is 0.2 pixels. Coordinates are relative to each individual chip. |
| 8 | Y | Pixels | Y coordinate of centroid of MLE ModelffThe mean error between the model centroid and the actual centroid of the object image is 0.2 pixels. Coordinates are relative to each individual chip. |
| 9 | Sky | Mag | MLE model sky magnitudeggA maximum likelihood estimate for the local sky background is determined simultaneously with the other model parameters. Sufficient pixels are used to ensure that the sky level is determined to an accuracy of 0.5%. The sky background is assumed to be flat over the small region selected for analysis. |
| 10 | Mag | Total MLE model magnitudehhSmall differences between the analytic total magnitude and the true total magnitude may arise because the true galaxy is not smooth, and the model may not average properly over bright regions of star formation; for details, see references listed in text. | |
| 11 | Mag | Error on above | |
| 12 | Log(arcsec) | Log half-light radius of MLE modeliiThe radius within which half of the light of the unconvolved model would be contained if it were radially symmetric (an axis ratio of unity). Lower and upper limits of 0.1 pixel and one-half of the maximum radius of the region selected for analysis have been imposed. The half-light radius of the individual components can be derived used the Bulge/Disk half-light radius ratio (column 22). | |
| 13 | Log(arcsec) | Error on above | |
| 14 | PA | Radians | Orientation of MLE modeljjThe adopted position angle (measured East from North) is that of the axis of symmetry of the model. It is set equal to zero when the source is assumed to be azimuthally symmetric with an axis ratio of unity. For disk+bulge models, the orientation is assumed to be the same for both components. |
| 15 | Radians | Error on above | |
| 16 | Disk axis ratio of MLE modelkkThe ratio of the minor axis half-light ratio to that of the major axis. For disk+bulge models it is defined independently for each component. If the axis ratio is not significantly different from unity, it is fixed at 1. A ratio of 0 indicates that this component was not fit to the data. | ||
| 17 | Error on above | ||
| 28 | Bulge axis ratio of MLE modelkkThe ratio of the minor axis half-light ratio to that of the major axis. For disk+bulge models it is defined independently for each component. If the axis ratio is not significantly different from unity, it is fixed at 1. A ratio of 0 indicates that this component was not fit to the data. | ||
| 19 | Error on above | ||
| 20 | Bulge/(Disk+Bulge) luminosity ratiollThe luminosity of the individual components can be derived from this parameter and the total magnitude (column 10). | ||
| 21 | Error on above | ||
| 22 | Log ratio of Bulge/Disk half-light radius of MLE model | ||
| 23 | Error on above | ||
| 24 | Log integrated signal-to-noise ratio | ||
| 25 | Class | Name of MLE classificationmmObject classification : object, galaxy, disk, bulge or disk+bulge. | |
| 26 | A | Asymmetry parameternnA value of 99.99 denotes an undefined measurement. | |
| ††footnotetext: |
| MDS ID # | Class | D | Interp | Comments | |
|---|---|---|---|---|---|
| 1 | 19.06 | Sc | 1 | – | face-on |
| 2 | 19.31 | S0 | 0 | – | possible AGN |
| 3 | 19.26 | Sa | 2 | – | face-on; 1 distinct arm; several bright knots |
| 7 | 19.43 | S0 | 1 | T,M? | peculiar; tidal jet |
| 9 | 20.19 | Sa | 3 | – | two asymm arms |
| 10 | 20.47 | Sab | 2 | – | several arms; structure in disk |
| 12 | 20.59 | Sc | 1 | I | grand design spiral; 2 very close, faint comps @4,5 |
| 13 | 21.15 | Sa | 1 | – | bright bulge, asymm arms |
| 14 | 21.08 | Sc | 3 | – | 2 small arms; large, diffuse disk |
| 15 | 21.35 | Sc | 4 | M | double nucleus; small comp (#158) @8 |
| 16 | 20.87 | Sc | 3 | T? | strong feature at end of arm - another galaxy @11? |
| 17 | 21.66 | E | 0 | – | face-on; round |
| 18 | 21.18 | Sc | 2 | – | peculiar; ring galaxy; comp to #183 |
| 20 | 21.91 | E | 0 | – | |
| 21 | 21.25 | Sa | 1 | – | one-armed; 1 bright knot; very low SB and compact comps (#187,115) @5,12 |
| 22 | 21.46 | SBc | 3 | – | possible bar; many knots, chaotic arms; faint comp @11 |
| 23 | 21.80 | Sa | 1 | – | peculiar; large w/ faint, amorphous disk |
| 24 | 22.11 | Sa | 0 | – | bright nucleus; 2 faint arms; compact comp (#153) @2; very faint comp @4 |
| 25 | 21.82 | Sc | 4 | – | 2 asymmetric arms, 1 blob; close comp to #44 |
| 26 | 21.45 | Sc | 2 | – | several bright knots; compact comp (#162) @12 |
| 27 | 21.92 | Sc | 4 | T,M | double nucleus; tidal tail @5 |
| 28 | 21.67 | SBc | 3 | M? | two-armed spiral; double nucleus; possible bar |
| 29 | 21.80 | Sc | 2 | – | face-on; bright knots; comp to #59 |
| 30 | 22.00 | SBb | 0 | – | distant grand design spiral |
| 31 | 21.87 | Sb | 2 | – | edge-on late-type; slightly asymm |
| 32 | 22.39 | S0 | 0 | – | inclined; asymm bulge; faint comp @2 |
| 33 | 22.32 | Sb | 0 | – | edge-on; comp (#40) @11 |
| 34 | 22.30 | S0 | 0 | – | slightly asymm disk |
| 35 | 22.37 | Sc | 2 | – | peculiar; several bright knots in diffuse disk |
| 36 | 22.05 | SBa | 1 | – | ring galaxy |
| 37 | 21.93 | Sc | 4 | I,M | disturbed spiral; double nucleus; bright knot at arm end; comp to #31 |
| 38 | 22.59 | E/Sa? | 0 | – | small, round bulge; possible faint ring? |
| 39 | 22.22 | Sc | 4 | T,M? | peculiar; triple nucleus - merger?; bow-shaped disk - tidal?; comp to #249 |
| 40 | 22.52 | E | 0 | – | bright, late-type comp @5 |
| 41 | 22.71 | E | 0 | – | compact, high SB |
| 42 | 22.12 | Sc | 3 | C | peculiar; several knots |
| 43 | 22.57 | Sc | 3 | I? | tidal tail @6 connecting a small, round low SB galaxy; several small comps |
| 44 | 22.56 | Sbc | 2 | – | edge-on w/ flare; comp to #25 |
| 45 | 22.57 | E | 0 | M? | peculiar; asymm - merger? |
| 46 | 22.56 | Sd | 0 | – | edge-on |
| 47 | 22.41 | Sa | 1 | – | edge-on; slightly asymm arms |
| 48 | 22.37 | Sc | 2 | I,M? | large two-arm spiral; bright knot at end of arm - possible merger |
| 49 | 22.56 | Sc | 2 | – | peculiar; face-on spiral; asymm disk w/ structure |
| 50 | 22.72 | Sa | 2 | I? | disk galaxy; possible faint comp in disk @4? |
| 51 | 22.78 | Sa | 1 | – | bright nucleus; faint disk; indication of arm? |
| 52 | 22.66 | Sc | 2 | I? | disturbed spiral; 2 comps - compact E (#79) @2; very low SB, small galaxy @6 |
| 53 | 22.75 | Sa | 0 | – | bright bulge; indication of arms; chain galaxy comp (#218) @11 |
| 54 | 22.72 | S0 | 1 | – | slight asymm lens |
| 55 | 22.32 | Sc | 3 | M? | 2 bright knots; another galaxy in disk @11? |
| 56 | 22.40 | Sa | 2 | – | bright, round nucleus; 1 prominent arm |
| 57 | 22.91 | E | 1 | M? | peculiar; asymm - merger? |
| 58 | 22.63 | Sd | 2 | I? | dusty; possible comp @11 |
| 59 | 22.56 | Sbc | 0 | – | highly inclined; small, faint comp @3 |
| 60 | 23.02 | Sc | 1 | – | edge-on; slightly asymm disk; compact comp @8 |
| 61 | 22.91 | Sbc | 2 | M? | asymm disk; 1 bright knot |
| 62 | 22.78 | Sab | 1 | I? | edge-on; slightly asymm disk; strong feature at end of arm - galaxy @2? |
| 63 | 22.49 | SBb | 1 | I? | edge-on; warp/distortion due to possible, low SB comp (#134) @2; very low SB comp @3 |
| 64 | 23.01 | P | 3 | M | edge-on linear galaxy; double nucleus; 1 bright knot; asymm disk |
| 65 | 22.71 | Sa | 3 | I | disturbed spiral; several faint, interacting comps - distant group? |
| 66 | 22.84 | P | 3 | C,M.I | 4 small knots; 5 possible faint comps; distant compact group? |
| 67 | 23.27 | E | 0 | – | compact; high SB |
| 68 | 22.99 | SBa | 0 | – | faint amorphous disk |
| 69 | 22.79 | P | 4 | C | chaotic; 3 bright knots |
| 71 | 22.87 | SBa | 0 | – | possible bar; faint, amorphous disk |
| 72 | 23.26 | SBb | 1 | – | barred, wide-armed spiral |
| 73 | 23.33 | Sb | 2 | I? | on edge; disturbed w/ small, faint comp @11 (#171) |
| 74 | 23.43 | S0 | 1 | – | peculiar; asymm disk |
| 75 | 22.75 | Irr | 3 | – | diffuse; low SB |
| 76 | 22.96 | SB0 | 0 | – | edge-on; possible bar |
| 77 | 23.33 | S0 | 0 | – | slightly asymm disk |
| 78 | 22.95 | P | 2 | I? | disturbed late-type due to comp #128? |
| 79 | 23.80 | E | 0 | – | compact; several comps (incl. #52,144) |
| 80 | 23.61 | E | 0 | – | faint late-type comp @7 |
| 81 | 23.05 | P | 3 | C,M? | distorted disk galaxy; several bright knots; warp |
| 82 | 22.68 | Irr | 3 | – | low SB, highly curved; just below CCD border; extension of large galaxy @11 (above CCD border)? |
| 83 | 23.29 | Sa | 1 | – | several bright knots; faint arms |
| 84 | 23.60 | E/S0 | 1 | – | peculiar; asymm disk |
| 85 | 23.23 | E | 0 | – | small compact comp @9 |
| 86 | 23.53 | P | 1 | M | compact; double nucleus |
| 87 | 23.42 | P | 3 | M | chaotic; 2 comps in diffuse disk; compact comps (#154,160) @7,9 |
| 88 | 23.39 | Sc | 1 | – | peculiar; diffuse, low SB disk |
| 89 | 23.24 | P | 3 | M? | several knots - possible merger?; close, faint comp @4 |
| 90 | 23.77 | P | 2 | M | double nucleus; compact comp @1 |
| 91 | 23.56 | SBb | 0 | – | possible bar; comp to #134 |
| 92 | 23.78 | S0 | 1 | – | peculiar; elongated disk; comp to #182 |
| 93 | 23.58 | P | 1 | – | amorphous; slightly asymm |
| 94 | 23.47 | Sb | 0 | – | edge-on spiral; faint comp (#217) @9 |
| 95 | 23.44 | Irr | 2 | I | disturbed irr; low SB comp @1 |
| 96 | 23.75 | Sc | 1 | – | peculiar; disk galaxy w/ distorted bulge |
| 97 | 24.70 | P | 2 | – | three compact sources - distant group? |
| 98 | 23.79 | P | 0 | – | amorphous; high SB |
| 99 | 23.62 | Sc | 1 | – | peculiar; diffuse, low SB disk |
| 100 | 23.90 | X | 0 | – | compact |
| 101 | 23.86 | X | 0 | – | compact |
| 102 | 23.70 | Sc | 0 | – | late-type w/ bright knot at end of each arm |
| 103 | 23.66 | Sd | 1 | – | edge-on; slightly asymm disk; 1 bright knot |
| 104 | 24.01 | P | 1 | – | amorphous; compact comp @2 |
| 105 | 23.75 | Sc | 0 | – | very low SB, disk galaxy; faint comp @4 |
| 106 | 23.72 | P | 0 | – | amorphous; several faint comps |
| 107 | 23.96 | S0 | 1 | – | peculiar; asymm lens |
| 108 | 23.97 | P | 3 | M? | disturbed; bright knot in arm - another galaxy?; low SB and compact comp (#157) @2,3 |
| 109 | 23.32 | Sa/S0? | 1 | T? | peculiar; 2 jets/arms @11,3 |
| 110 | 23.84 | Sc | 0 | – | edge-on |
| 111 | 23.62 | P | 3 | – | low SB irreg; 2 bright knots; comp @1 |
| 112 | 23.99 | S0 | 0 | – | faint disk; comp @4 |
| 114 | 23.78 | Sc | 0 | – | diffuse, low SB disk; compact comps @4,9,11 |
| 115 | 24.12 | X | 0 | – | compact; comp (#21) @6 |
| 116 | 23.81 | P | 0 | – | 2 compact comps @10,12 |
| 117 | 24.33 | P | 2 | M | two high SB bodies in faint envelope; low SB comp @12 (incl. #299) |
| 118 | 24.02 | P | 3 | – | small nucleus; 1 bright arm |
| 119 | 24.06 | P | 2 | – | diffuse; low SB; faint comp @3,7 |
| 120 | 23.79 | P | 2 | – | several bright knots in diffuse disk |
| 121 | 24.07 | P | 2 | I | pair of linear late-types |
| 122 | 23.73 | Sb | 0 | – | faint edge-on; compact comp (#197) @3 |
| 123 | 23.88 | P | 2 | M | low SB; double nucleus |
| 124 | 24.59 | X | 0 | – | compact |
| 126 | 24.40 | X | 0 | – | compact |
| 127 | 24.22 | P | 2 | M? | 2 nuclei?; comp to #20 |
| 128 | 23.92 | Irr | 0 | – | comp to #78 |
| 130 | 24.09 | Irr | 0 | – | very low SB irr; close comp to #89 |
| 131 | 24.10 | P | 1 | – | bulge w/ asymm disk; compact comp @9 |
| 132 | 23.91 | Sc | 0 | – | peculiar; small nucleus; very low SB disk |
| 133 | 23.85 | Sc | 1 | I | disturbed w/ very low SB companion @10 - tidal tail; comps @11,12 |
| 134 | 24.22 | S0 | 0 | – | comp to #63,91 |
| 135 | 24.08 | P | 1 | – | amorphous; slightly asymm disk w/ structure |
| 136 | 24.37 | X | 0 | – | compact |
| 138 | 24.17 | S0 | 0 | – | |
| 139 | 24.20 | X | 0 | – | compact |
| 141 | 24.38 | E/S0 | 0 | – | small, slightly elongated |
| 142 | 23.85 | X | 0 | – | very compact, nearly stellar; comp to #127 |
| 143 | 24.31 | Sb | 0 | – | edge-on |
| 144 | 23.97 | Sc | 0 | – | distant; compact comp (#79) @9 |
| 145 | 24.36 | Sc | 1 | – | faint, edge-on late-type |
| 146 | 24.38 | P | 2 | I,M? | bright knots; curved disk; 2 possible low SB comps in arm |
| 147 | 23.21 | P | 3 | C,M,I | several small knots; 4 possible faint comps including #172; distant compact group? |
| 148 | 23.88 | S0 | 0 | – | small; faint disk |
| 149 | 24.05 | Sb | 3 | I | linear late-type; tidal connection to close comp (#210) @12 |
| 150 | 24.64 | E? | 0 | – | very distant |
| 151 | 24.57 | X | 0 | – | compact |
| 152 | 24.19 | Irr | 1 | – | low SB, diffuse disk |
| 153 | 24.45 | X | 0 | – | compact; comp to #24 |
| 154 | 24.44 | P | 2 | M? | galaxy pair?; comps (#87,160) @3,7 |
| 156 | 24.58 | Sb | 0 | – | distant; several faint comps |
| 157 | 24.62 | X | 0 | – | compact; comps (incl. #108) @5,7 |
| 158 | 23.95 | Sc | 1 | – | distant disk galaxy; large comp (#15) @2 |
| 159 | 24.19 | X | 0 | – | compact |
| 160 | 24.47 | S0 | 0 | – | compact; indication of lens; comp (#154) @2 |
| 161 | 24.55 | P | 1 | – | linear late-type; 2 close, low SB comps @6,12 |
| 162 | 24.40 | X | 0 | – | compact; close comp to #26 |
| 163 | 24.21 | S0 | 2 | – | bright bulge, asymm disk |
| 164 | 23.40 | Irr | 1 | – | low SB, diffuse disk |
| 165 | 24.22 | Irr | 0 | – | low SB, diffuse disk |
| 166 | 24.33 | P | 2 | – | linear late-type; asymm disk; bright knot on end of one arm |
| 168 | 24.40 | Irr | 1 | – | low SB disk; low SB comp @2 |
| 169 | 24.36 | Sc | 0 | – | distant, face-on spiral; peculiar; comp (#171) @8 |
| 170 | 24.29 | X | 0 | – | compact; small comp @6 |
| 171 | 24.52 | S0 | 0 | – | peculiar; comps (#73,169) @2,5 |
| 172 | 24.55 | P | 0 | – | peculiar; asymm bulge; faint disk |
| 173 | 24.61 | P | 2 | – | small; asymm disk - one arm |
| 174 | 24.57 | P | 1 | – | distant; high ellipticity |
| 179 | 24.63 | X | 0 | – | compact; comp to #43 |
| 181 | 24.65 | Sc | 2 | – | distant; close comp @3 |
| 182 | 24.50 | Scd | 0 | – | edge-on; comp to #92 |
| 183 | 24.32 | Irr | 0 | – | small, diffuse disk; comp to #18 |
| 185 | 24.43 | Sa | 1 | – | bright bulge; 1 arm |
| 186 | 24.40 | Sc | 1 | – | peculiar; face-on low SB disk; small bulge |
| 187 | 24.26 | Irr | 1 | – | low SB, diffuse disk; several comps incl. #21,65 |
| 188 | 24.59 | P | 0 | – | amorphous; high SB |
| 190 | 24.40 | S0 | 0 | – | distant; edge-on |
| 191 | 24.64 | P | 1 | I,M | double nucleus; tidal connection to small comp @2 |
| 193 | 24.67 | Irr | 0 | – | small, low SB disk; comps (#24,153) @10,11 |
| 194 | 24.62 | P | 2 | I | 2 interacting late-types |
| 195 | 24.67 | P | 2 | – | highly asymm disk |
| 197 | 24.58 | X | 0 | – | compact; comp #122 |
| 199 | 24.64 | Irr | 1 | – | compact comp @11 |
| 202 | 24.61 | S0 | 0 | – | distant, edge-on; comps @3,9 |
| 205 | 24.43 | Irr | 2 | – | low SB; 1 bright knot; close comp @9; compact comp (#80) @7 |
| 206 | 24.54 | Sc | 0 | – | distant, edge-on |
| 209 | 24.60 | Sd | 0 | – | distant, edge-on |
| 210 | 24.52 | P | 2 | I,M | double nucleus in diffuse disk; tidal connection to close comp (#149) @6 |
| 213 | 24.63 | P | 0 | – | amorphous; high SB |
| 214 | 24.38 | Sb | 0 | – | distant |
| 215 | 24.58 | Sd | 0 | – | edge-on |
| 217 | 24.53 | P | 2 | I? | pair of galaxies?; comp (#94) @3 |
| 218 | 24.58 | P | 1 | – | chain galaxy; comp (#53) @5 |
| 222 | 24.69 | X | 0 | – | compact |
| 224 | 24.62 | P | 2 | M? | small bulge, warped disk |
| 227 | 24.56 | P | 1 | I? | small bulge, asymm disk; very close, faint comp @9 |
| 235 | 24.46 | P | 2 | I? | low SB disk w/ 2 bright knots - interacting pair?; small, compact comp @1 |
| 239 | 24.65 | P | 2 | M | 3 compact components |
| 244 | 24.54 | Irr | 1 | – | low SB disk; small comp (#277) @9 |
| 246 | 24.67 | Irr | 2 | – | diffuse disk; compact comps @4,7 |
| 248 | 24.59 | X | 0 | – | compact; comp to #38 |
| 249 | 24.68 | Irr | 1 | – | diffuse disk w/ 1 bright knot; comp to #39 |
| 252 | 24.61 | X | 0 | – | compact |
| 256 | 24.60 | P | 2 | I | compact core w/ tidal connection to low SB galaxy |
| 261 | 24.40 | Irr | 2 | – | low SB, diffuse disk; comp to #69 |
| 264 | 24.36 | X | 0 | – | compact |
| 268 | 24.59 | X | 0 | – | compact |
| 277 | 24.41 | Irr | 1 | – | face-on, slightly asymm disk; comp (#244) @3 |
| 281 | 24.55 | P | 3 | – | ring; diffuse disk w/ 1 bright knot |
| 283 | 24.68 | Sa? | 1 | – | distant; large bulge; asymm disk - arm? |
| 298 | 24.27 | Irr | 2 | – | low SB, diffuse disk w/ 1 knot; several small comps |
| 299 | 24.65 | X | 2 | – | compact; close comp to #116 |
| 301 | 24.32 | Irr | 0 | – | small, low SB disk; several small comps |
| 311 | 24.56 | Irr | 1 | – | very low SB disk; several small comps |
| 331 | 24.58 | Irr | 1 | – | very low SB disk |
| 338 | 24.23 | X | 0 | – | compact; comp (#43) @12 |
| 344 | 24.44 | Irr | 1 | – | very low SB disk |
Note. — Machine-readable forms of Tables 1a–b can be obtained from the website address http://landru.stsci.edu:5000/hizclus/ftp.html (see Sect. 3.1.1). In addition, all of the data from the MDS reduction (including the processing information, the raw and reduced images, and the full catalogs) are publically available from the STScI archive. The data for both cluster fields can be found at http://archive.stsci.edu/mds/mds.cgi. Here, one must first choose the option “Define Fields” to specify the fields of interest by an RA/Dec range and the minimum number of exposures in a given passband. The option “Find Fields” will then retrieve the specified observations. The CL0023+0423 observations are designated dataset u2vk1, and the CL1604+4304 observations are designated datasets u2845 and u2845.
| MDS ID # | Class | D | Interp | Comments | |
|---|---|---|---|---|---|
| 2 | 18.40 | S0 | 0 | – | very small comp (#255) @1 |
| 3 | 19.37 | S0 | 1 | – | distinct structure in disk |
| 7 | 20.48 | Sa | 2 | I | face-on; 2 arms w/ bright knot on one end; bright comp @5 - tidal |
| 8 | 20.47 | E | 0 | – | |
| 9 | 20.42 | E/S0 | 0 | – | faint comps (incl. #165) @2,12 |
| 10 | 20.60 | S0 | 0 | – | very low SB comp (#376) |
| 12 | 21.57 | Sc | 1 | – | highly inclined |
| 13 | 20.73 | E | 0 | – | |
| 16 | 21.00 | Sa | 0 | – | face-on, two-armed; bright knot in one arm; compact comp (#46) @7 |
| 18 | 21.10 | Sb | 3 | I | face-on; bright feature on arm - another galaxy?; low SB comp (#186) @9 |
| 19 | 21.21 | Sb | 2 | M? | diffuse disk w/ structure and several small arms; several small, faint comps |
| 20 | 20.87 | Sb | 1 | – | face-on; messy arms; ring-like |
| 21 | 21.59 | Sb | 0 | – | disk system; structure in bulge; several faint comps |
| 22 | 21.22 | Sb | 3 | – | face-on; one distinct arm |
| 23 | 21.46 | S0/E | 0 | – | extended disk; small comp @12 |
| 24 | 21.18 | P | 4 | C,M | chaotic; several bright knots |
| 25 | 21.64 | P | 2 | M | high SB; double nucleus; comp (#65) @8 |
| 26 | 21.52 | Sa | 0 | – | bright knot at disk edge; small, low SB comp @11 |
| 27 | 21.68 | S0 | 0 | – | bright comp @8 |
| 28 | 21.86 | S0 | 0 | – | |
| 29 | 21.74 | Sc | 2 | – | peculiar; asymm, diffuse disk; low SB comp (#104) @10; comp (#126) @6 |
| 30 | 21.63 | Sa | 1 | – | asymm disk; indication of 1 small arm |
| 31 | 21.67 | S0/Sa | 0 | – | diffuse disk w/ hint of structure; compact comp (#141) @2 |
| 32 | 21.92 | P | 2 | I,T? | high SB bulge w/ curved, diffuse disk - tidal?; E w/ comp? interaction? |
| 33 | 21.93 | Sa | 0 | – | highly inclined |
| 34 | 21.86 | E/S0 | 0 | – | slightly asymm disk |
| 35 | 21.65 | Sb | 0 | – | edge-on; low SB comp (#116) @3 |
| 36 | 21.87 | E | 0 | – | compact; close diffuse, linear comp (#92) @5 |
| 37 | 21.71 | Sc | 0 | – | highly inclined, large late-type; small, faint comp @10 |
| 38 | 22.34 | Sbc | 4 | I,M? | peculiar; 2 components - dust lane or two galaxies?; faint comp @3 |
| 39 | 21.82 | Sab | 1 | – | face-on; indication of 2 arms; slightly asymm disk |
| 40 | 21.99 | Sb | 3 | T? | peculiar; asymm, diffuse disk |
| 41 | 22.03 | S0/Sa | 1 | – | large, elongated; asymm disk |
| 42 | 22.10 | P | 2 | M | faint disk; double nucleus - merger? |
| 43 | 21.84 | Sd | 2 | – | large, inclined late type |
| 44 | 21.93 | P | 1 | – | amorphous; very faint comp @11 |
| 45 | 22.04 | S0 | 0 | I | peculiar; tidal connection to very small, faint comp @5 |
| 46 | 22.11 | S0 | 0 | – | comp (#16) @1 |
| 48 | 22.15 | E | 0 | – | close spiral comp (#84) @8; compact comp (#154) @1 |
| 49 | 22.04 | SBa | 0 | – | face-on |
| 50 | 21.97 | E | 0 | – | compact comp (#136) @12 |
| 51 | 21.79 | P | 0 | – | amorphous |
| 54 | 22.20 | Sa | 1 | – | diffuse disk; 1 bright arm |
| 55 | 22.07 | Sb | 3 | – | peculiar; low SB, knotty disk |
| 56 | 22.96 | X | 0 | – | compact |
| 57 | 22.38 | S0/E | 0 | – | |
| 58 | 22.20 | E | 1 | T? | slightly asymm disk in direction of very faint comp @6 |
| 59 | 22.31 | E | 0 | – | compact, round |
| 60 | 22.26 | E | 0 | – | compact; bright comp @8; faint comps @1,11 |
| 61 | 22.17 | Sd | 3 | I? | diffuse, inclined galaxy; object at end of arm - another galaxy? |
| 62 | 22.44 | S0/E | 0 | – | compact; compact comp (#157) @10 |
| 63 | 22.47 | Sa | 1 | – | peculiar; asymm disk; compact comp (#177) @11 |
| 64 | 22.36 | SBa | 0 | – | face-on; possible bar; structure in disk w/ 1 knot; faint comps @4,7,11 |
| 65 | 22.49 | S0 | 1 | – | peculiar; highly asymm lens; close comp (#25) @2 |
| 66 | 22.81 | X | 0 | – | compact |
| 67 | 22.53 | P | 0 | I | amorphous; tidal connection to very low SB comp (#289) @11 |
| 68 | 22.61 | P | 2 | M | double nucleus - merger; very faint comp @12 |
| 69 | 22.26 | S0/E | 0 | – | |
| 70 | 22.69 | Sa | 1 | – | slightly asymm disk |
| 71 | 22.60 | S0 | 0 | – | |
| 72 | 22.68 | Sa | 1 | – | small; indication of 2 small arms; close, faint comp (#191) @3 |
| 73 | 22.34 | Irr | 2 | – | face-on; diffuse, low SB disk |
| 74 | 22.73 | E | 0 | – | round |
| 75 | 22.61 | Sc | 0 | – | edge-on; close comp to #102 |
| 76 | 22.82 | P | 0 | – | amorphous |
| 77 | 22.48 | E | 0 | – | compact |
| 78 | 22.58 | P | 3 | M? | bright knot at end - another galaxy? |
| 79 | 22.83 | S0/Sa | 0 | – | slightly asymm disk |
| 80 | 22.85 | E | 0 | – | 2 compact comps @5,9 |
| 81 | 22.58 | P | 3 | I? | large face-on; diffuse, low SB disk; warped arm? |
| 82 | 22.72 | Sa | 1 | – | highly inclined; slight warp; knots at end |
| 83 | 22.57 | Irr | 2 | C | 5 bright knots; extremely low SB comp (#636) @10 |
| 84 | 22.30 | Sb | 4 | I,M? | peculiar; winding arm w/ distinct feature on end - another galaxy?; close comp (#48) @2 |
| 85 | 22.83 | Sc | 4 | – | chain galaxy; bright knots on both ends; 2 close comps @6,12 |
| 86 | 22.30 | P | 4 | M? | several bright knots in diffuse disk |
| 88 | 22.69 | Sb | 2 | – | bright knot on one end; comp (#142) @8 |
| 89 | 22.90 | S0/Sa | 0 | – | edge-on |
| 90 | 22.73 | Sb | 0 | I? | peculiar; very low SB comp @2; connected by diffuse tail? |
| 91 | 22.93 | Sa | 0 | – | peculiar |
| 92 | 22.89 | Sd | 1 | – | highly-inclined late type; close comp (#36) @11 |
| 94 | 22.53 | S0 | 0 | – | slightly asymm disk; close comp (#140) @2 |
| 95 | 23.03 | P | 1 | – | amorphous; asymm disk; small comp @7 |
| 96 | 22.71 | S0 | 1 | – | slightly asymm disk; faint comps @7,9,11 |
| 97 | 22.51 | Sb | 1 | – | edge-on; asymm disk; compact comps @7,11 |
| 98 | 22.94 | E | 0 | – | peculiar |
| 99 | 23.07 | P | 0 | – | strong warp; s-shaped bulge; 2 faint comps |
| 100 | 23.11 | Sab | 0 | – | large disk; small, faint comp @4 |
| 102 | 23.28 | X | 0 | – | compact; close comp to #75 |
| 103 | 23.04 | Scd | 0 | – | highly inclined; low SB |
| 104 | 21.87 | Irr | 2 | – | large, diffuse, low SB disk; small comp @9; bright irregular comp (#29) @4 |
| 105 | 23.33 | P | 2 | M? | highly asymm; merger? |
| 106 | 23.32 | E | 0 | – | spheroid; compact comp @2; low SB, linear comp @6 |
| 107 | 23.28 | S0 | 0 | I? | small, diffuse disk; close, faint comp @6 |
| 108 | 23.24 | P | 1 | – | amorphous |
| 109 | 23.28 | E | 0 | – | compact; 2 faint comps @3,4 |
| 110 | 23.06 | P | 3 | I? | diffuse disk w/ bright knot at end - another galaxy? |
| 111 | 23.23 | S0 | 0 | – | highly inclined; extended lens; faint comps @4,10 |
| 112 | 23.27 | E | 0 | – | compact; diffuse, low SB comp @12 |
| 113 | 22.84 | Irr | 2 | – | face-on; low SB disk |
| 115 | 23.10 | Sb | 2 | – | face-on; large, diffuse disk; compact comp @6 |
| 116 | 23.30 | S0 | 1 | – | peculiar; close comp (#35) @9 |
| 117 | 23.35 | P | 0 | – | amorphous |
| 118 | 23.18 | E | 0 | – | compact |
| 119 | 23.16 | S0 | 0 | – | distant early type; indication of disk |
| 120 | 23.36 | S0 | 1 | – | peculiar; asymm lens; close comp to #129 |
| 121 | 23.28 | Scd | 2 | – | edge-on; asymm disk w/ bright knot on one end |
| 122 | 23.12 | P | 3 | I? | several small galaxies incl. #178,195; distant group? |
| 123 | 23.11 | P | 3 | M | faint disk; double nucleus - merger? small, low SB @6 |
| 124 | 23.42 | X | 1 | – | compact; hint of asymm disk; diffuse comp (#219) @7 |
| 125 | 23.42 | E | 0 | – | comps (incl. #203) @1,5,6 |
| 126 | 23.40 | Sa | 1 | – | slight warp; large, irregular comp (#29) @11 |
| 127 | 23.47 | Sb | 1 | – | edge-on; distant; distinct knot on end |
| 128 | 22.54 | Irr | 3 | – | face-on; very diffuse, low SB disk; several bright knots |
| 129 | 23.71 | P | 1 | I,M? | double nucleus?; very close, faint comp; nearby galaxies incl. #120,133 - distant group? |
| 130 | 23.56 | E/S0 | 0 | – | faint comps @1,5 |
| 131 | 23.61 | P | 3 | I | face-on; diffuse, warped disk; very small, faint comp @6 |
| 132 | 23.64 | Sa | 1 | – | small, face-on; indication of 1 arm |
| 133 | 23.61 | E | 1 | I? | compact; 7 close comps incl. #129 - distant group? |
| 134 | 23.59 | X | 0 | – | compact; hint of asymm disk; comp @7 |
| 135 | 23.30 | E | 2 | – | peculiar; 2 close comps @5,7 |
| 136 | 23.69 | E | 0 | – | compact comp (#50) @6 |
| 137 | 23.30 | Irr | 2 | – | low SB, diffuse disk |
| 138 | 23.13 | Sd | 0 | – | edge-on; very low SB; several close, faint comps |
| 139 | 23.69 | E | 0 | – | faint comps @7,10 |
| 140 | 23.65 | E | 0 | – | close comp (#94) @8 |
| 141 | 23.72 | E | 0 | – | close comp (#31) @8 |
| 142 | 23.49 | Scd | 2 | – | low SB; bright knot on one end; comp (#88) @2 |
| 144 | 23.46 | P | 0 | – | amorphous; 2 small comps (incl. #163) @11,12 |
| 145 | 23.74 | Sc | 2 | I? | highly inclined, large knot on one end |
| 146 | 23.55 | P | 2 | I | distant galaxy w/ tidal connection to another faint, nearby comp |
| 147 | 23.67 | S0 | 1 | – | slightly asymm bulge; compact comp @6 |
| 148 | 23.07 | S0 | 0 | – | inclined, extended lens |
| 149 | 23.65 | Scd | 2 | – | low SB; several close, faint comps |
| 150 | 23.84 | E | 1 | I? | low SB, compact center w/ asymm disk or interaction w/ dwarf |
| 151 | 23.66 | Scd | 1 | – | edge-on; low SB |
| 152 | 23.82 | Irr | 2 | – | diffuse, low SB; comps (incl. #175) @3,12 |
| 153 | 23.39 | X | 0 | – | compact |
| 154 | 23.72 | E | 0 | – | distant; bright compact comp (#48) @7 |
| 155 | 23.63 | Sa/S0 | 0 | – | distant; 2 faint comps @4,6 |
| 156 | 23.82 | S0 | 0 | – | peculiar |
| 157 | 24.16 | S0 | 0 | – | hint of disk; compact comps (#62,195) #4,10 |
| 158 | 23.78 | Sa | 0 | – | edge-on, extended lens; small, low SB comp @8 |
| 159 | 23.58 | S0 | 1 | – | peculiar; edge-on |
| 160 | 23.83 | X | 0 | – | compact |
| 161 | 23.88 | Sc | 0 | – | highly-inclined; small, low SB comp (#277) @6 |
| 162 | 23.62 | P | 4 | M? | distorted late-type; possible double |
| 163 | 23.27 | Sa? | 0 | – | small disk galaxy; 2 close, faint comps (incl. #144) @4,5 |
| 164 | 23.74 | S0 | 0 | – | peculiar; structure in disk; comp @5 |
| 165 | 23.84 | X | 0 | – | compact; close comp (#9) @6 |
| 166 | 23.22 | Sa | 2 | – | peculiar; one prominent arm |
| 167 | 23.71 | P | 3 | – | diffuse disk w/ two bright knots; bright (#159) comp @5; low SB comp @1 |
| 168 | 23.84 | S0 | 0 | – | |
| 170 | 24.03 | S0 | 1 | – | edge-on; slightly asymm |
| 171 | 24.02 | P | 2 | M? | highly asymm disk - pair of galaxies?; compact comp @12 |
| 173 | 23.18 | Sc | 2 | – | compact center w/ diffuse disk; indication of 1 arm; compact comp @7 |
| 174 | 23.69 | P | 4 | – | low SB disk w/ several knots |
| 175 | 23.34 | SBb | 2 | I? | diffuse, low SB barred spiral; comps (incl. #152) @5,6 |
| 176 | 24.10 | X | 0 | – | compact; faint comps @6,12 |
| 177 | 24.21 | X | 0 | – | compact; comp (#63) @5 |
| 178 | 23.73 | P | 0 | I? | several small galaxies incl. #122,195; distant elliptical group? |
| 180 | 23.95 | E | 0 | – | distant late type; slightly asymm disk |
| 181 | 23.79 | P | 1 | I? | pair of compact galaxies |
| 182 | 24.05 | P | 1 | – | distant late-type; slight warp |
| 183 | 24.18 | P | 3 | I,M | 4 components (incl. #276) in a diffuse disk - merger?; compact comp @11 |
| 184 | 23.60 | Irr | 2 | – | face-on; diffuse, low SB disk |
| 185 | 23.77 | S0 | 0 | – | compact |
| 186 | 23.74 | P | 2 | – | distant late type; slightly asymm disk; comp to #18 |
| 188 | 23.69 | Irr | 2 | – | very low SB |
| 189 | 23.58 | Sc | 1 | – | edge-on late type; low SB |
| 190 | 24.15 | P | 3 | – | chain galaxy; several bright knots; warp; several faint ocmps |
| 191 | 24.22 | Sa? | 0 | – | disk galaxy; close comp (#72) @9 |
| 192 | 24.29 | S0 | 0 | – | distant early type |
| 194 | 23.98 | X | 1 | – | compact; on edge of field |
| 195 | 24.26 | P | 1 | I? | several small galaxies incl. #122,178; distant elliptical group? |
| 196 | 24.12 | E | 0 | – | low SB comp @7 |
| 197 | 22.78 | Irr | 1 | – | low SB, asymm disk |
| 198 | 24.09 | Sa | 1 | – | 1 small arm; very faint comps @1,11 |
| 199 | 24.08 | P | 1 | – | amorphous; asymm disk |
| 200 | 24.20 | X | 0 | – | compact |
| 201 | 24.19 | P | 4 | M? | irregular disk; 1 large arm or connection to another galaxy |
| 203 | 24.11 | Sa? | 0 | – | distant; extended disk; diffuse comp @3; compact comp (#125) @12 |
| 205 | 24.12 | P | 1 | – | smooth disk; small, faint comp @5 |
| 206 | 24.24 | P | 2 | M | high SB; doubl nucleus |
| 207 | 24.13 | Irr | 3 | I? | very low SB disk w/ 1 bright knot - another galaxy?; comp @7 |
| 210 | 24.27 | P | 2 | M | high SB; double nucleus |
| 213 | 23.86 | S0 | 0 | – | distant; asymm disk; close faint comp @7 |
| 215 | 24.20 | P | 2 | M? | large bulge w/ 1 protrusion; close compact comp @11 |
| 219 | 24.02 | Irr | 3 | – | low SB, face-on; compact comp (#124) @2; diffuse comp @8 |
| 220 | 24.09 | Irr | 3 | – | low SB, diffuse disk |
| 228 | 24.07 | X | 0 | – | compact |
| 230 | 23.58 | X | 0 | – | compact |
| 231 | 23.72 | P | 2 | – | low SB disk |
| 237 | 24.26 | Sc | 0 | – | highly inclined; low SB, compact comp @11 |
| 238 | 24.26 | P | 4 | M | compact galaxy w/ 4 distinct components |
| 243 | 24.23 | X | 1 | – | compact |
| 255 | 23.18 | X | 0 | – | compact; close comp to #2 |
| 268 | 24.12 | P | 2 | – | chain galaxy; very low SB; several bright knots |
| 276 | 23.83 | P | 4 | I,M | disturbed spiral; 4 components (incl. #183) in a diffuse disk; compact comp @11 |
| 277 | 24.06 | Irr | 1 | – | small, diffuse; low SB comps (incl. #161) @6,12 |
| 289 | 24.22 | Irr | 2 | I | low SB, diffuse disk; tidal connection to close comp (#67) |
| 290 | 24.27 | P | 3 | I,M | 3 components w/ diffuse tidal connections; 2 interacting galaxies? |
| 376 | 23.47 | Irr | 0 | – | extremely low SB emission on the edge of a large galaxy (#10) |
| 383 | 24.22 | Irr | 0 | – | low SB |
| 453 | 24.28 | X | 0 | – | compact |
| 636 | 23.98 | Irr | 2 | I | extremely diffuse, low SB emission connected to comp #83 |
| Column | Heading | Comments |
|---|---|---|
| 1 | ID | MDS object identifieraaMDS indentification number as given in Table 1. |
| 2 | Analytic total magnitudebbTotal magnitude of best-fit analytic model in either (CL0023+0423) or (CL1604+4304) as given in Table 1. | |
| 3 | Class | Hubble classccThe standard Hubble classification scheme (E, S0, Sa, Sab, Sb…) with the addition of the following : E/S0 or S0/E, cannot distinguish between E or S0; X, compact object (likely non-stellar, but too compact to see structure); P, peculiar or unclassifiable. |
| 4 | D | Disturbance indexddDisturbance index : 0, normal; 1, moderate asymmetry; 2, strong asymmetry; 3, moderate distortion; 4, strong distortion. |
| 5 | Interp | Interpretation of the disturbanceeeInterpretation of disturbance index : M, merger; I, tidal interaction with neighbor; T, tidal feature; C, chaotic. |
| 6 | Comments | Description of object morphologyffHere, comp is short for “companion”; @ indicates position relative to the galaxy going clockwise, e.g. @7 = “at 7 o’clock.” |
Table 3. Comparison Between Visual and Automated Typing
| Classification | E | S0 | Sp | Irr/Pec |
|---|---|---|---|---|
| D | 32% | 43% | 62% | 81% |
| B | 43% | 26% | 9% | 9% |
| D+B | 25% | 31% | 29% | 10% |
| MDS ID #aaMDS identification number as given in Table 1 (see Sect. 3.1.1). | Keck #bbCorresponding number from the Keck photometry tables (see Paper II). | ccKeck aperture photometry. A value of indicates no detection in that band (see Paper II). | ccKeck aperture photometry. A value of indicates no detection in that band (see Paper II). | ccKeck aperture photometry. A value of indicates no detection in that band (see Paper II). | ccKeck aperture photometry. A value of indicates no detection in that band (see Paper II). | z | AgeddGalaxy age and errors (in Gyr) determined from a comparison between the Gyr Bruzual & Charlot population synthesis model and the broad band AB magnitudes derived from the Keck photometry. Upper limits are indicated as values with no errors (see Sect. 5.2 and also Paper II). | AgeddGalaxy age and errors (in Gyr) determined from a comparison between the Gyr Bruzual & Charlot population synthesis model and the broad band AB magnitudes derived from the Keck photometry. Upper limits are indicated as values with no errors (see Sect. 5.2 and also Paper II). |
|---|---|---|---|---|---|---|---|---|
| 1 | 2589 | 21.26 | 20.19 | 19.41 | 18.69 | |||
| 2 | 2645 | 21.68 | 20.24 | 19.42 | 18.74 | |||
| 3 | 1572 | 20.90 | 20.05 | 19.63 | 19.13 | 0.1851 | 1.40 | 0.10 |
| 7 | 1845 | 21.66 | 20.91 | 20.45 | 20.40 | |||
| 9 | 1552 | 21.79 | 20.93 | 20.49 | 20.04 | 0.1852 | 1.40 | 0.10 |
| 10 | 1711 | 23.31 | 22.29 | 21.24 | 20.13 | |||
| 12 | 1480 | 22.69 | 21.91 | 21.23 | 20.34 | |||
| 13 | 1526 | 22.83 | 21.96 | 21.32 | 20.77 | 0.4083 | 1.00 | 0.10 |
| 14 | 1336 | 23.09 | 22.34 | 21.64 | 20.96 | 0.5776 | 1.00 | 0.10 |
| 15eeBecause of the better resolution of the HST observations, an individual galaxy in the Keck image may be associated with more than one galaxy in the corresponding HST image. Therefore, these HST galaxies have the same Keck number. The following pairs occur in this field : MDS ID # 25, 44 = Keck # 1375; MDS ID # 26, 162 = Keck # 1684; MDS ID # 73, 171 = Keck # 1689; MDS ID # 21, 187 = Keck # 1833; MDS ID # 39, 249 = Keck # 1922; MDS ID # 15,185 = Keck # 1964; MDS ID # 87, 154 = Keck # 1968; MDS ID # 24, 153, 193 = Keck # 2078; MDS ID # 18, 183 = Keck # 2121; MDS ID # 122, 197 = Keck # 2177; MDS ID # 116, 299 = Keck # 2686; MDS ID # 53, 218 = Keck # 2764 (see Sect. 5.1). | 1964 | 22.94 | 22.31 | 21.66 | 20.81 | |||
| 16 | 1662 | 23.43 | 22.72 | 21.96 | 20.80 | |||
| 17 | 2035 | 24.35 | 23.87 | 22.21 | 20.56 | 0.8274 | 3.50 | 0.20 |
| 18eeBecause of the better resolution of the HST observations, an individual galaxy in the Keck image may be associated with more than one galaxy in the corresponding HST image. Therefore, these HST galaxies have the same Keck number. The following pairs occur in this field : MDS ID # 25, 44 = Keck # 1375; MDS ID # 26, 162 = Keck # 1684; MDS ID # 73, 171 = Keck # 1689; MDS ID # 21, 187 = Keck # 1833; MDS ID # 39, 249 = Keck # 1922; MDS ID # 15,185 = Keck # 1964; MDS ID # 87, 154 = Keck # 1968; MDS ID # 24, 153, 193 = Keck # 2078; MDS ID # 18, 183 = Keck # 2121; MDS ID # 122, 197 = Keck # 2177; MDS ID # 116, 299 = Keck # 2686; MDS ID # 53, 218 = Keck # 2764 (see Sect. 5.1). | 2121 | 23.73 | 22.84 | 22.04 | 20.89 | 0.8281 | 1.90 | 0.20 |
| 20 | 1699 | 24.83 | 23.25 | 22.16 | 20.77 | 0.8435 | 3.50 | 0.20 |
| 21eeBecause of the better resolution of the HST observations, an individual galaxy in the Keck image may be associated with more than one galaxy in the corresponding HST image. Therefore, these HST galaxies have the same Keck number. The following pairs occur in this field : MDS ID # 25, 44 = Keck # 1375; MDS ID # 26, 162 = Keck # 1684; MDS ID # 73, 171 = Keck # 1689; MDS ID # 21, 187 = Keck # 1833; MDS ID # 39, 249 = Keck # 1922; MDS ID # 15,185 = Keck # 1964; MDS ID # 87, 154 = Keck # 1968; MDS ID # 24, 153, 193 = Keck # 2078; MDS ID # 18, 183 = Keck # 2121; MDS ID # 122, 197 = Keck # 2177; MDS ID # 116, 299 = Keck # 2686; MDS ID # 53, 218 = Keck # 2764 (see Sect. 5.1). | 1833 | 23.99 | 23.03 | 22.19 | 20.75 | |||
| 22 | 1971 | 23.10 | 22.60 | 22.00 | 21.18 | 1.1074 | 1.60 | 0.10 |
| 23 | 1628 | 23.49 | 22.54 | 22.17 | 21.52 | 0.5875 | 0.90 | 0.10 |
| 24eeBecause of the better resolution of the HST observations, an individual galaxy in the Keck image may be associated with more than one galaxy in the corresponding HST image. Therefore, these HST galaxies have the same Keck number. The following pairs occur in this field : MDS ID # 25, 44 = Keck # 1375; MDS ID # 26, 162 = Keck # 1684; MDS ID # 73, 171 = Keck # 1689; MDS ID # 21, 187 = Keck # 1833; MDS ID # 39, 249 = Keck # 1922; MDS ID # 15,185 = Keck # 1964; MDS ID # 87, 154 = Keck # 1968; MDS ID # 24, 153, 193 = Keck # 2078; MDS ID # 18, 183 = Keck # 2121; MDS ID # 122, 197 = Keck # 2177; MDS ID # 116, 299 = Keck # 2686; MDS ID # 53, 218 = Keck # 2764 (see Sect. 5.1). | 2078 | 24.37 | 23.36 | 22.42 | 21.00 | |||
| 25eeBecause of the better resolution of the HST observations, an individual galaxy in the Keck image may be associated with more than one galaxy in the corresponding HST image. Therefore, these HST galaxies have the same Keck number. The following pairs occur in this field : MDS ID # 25, 44 = Keck # 1375; MDS ID # 26, 162 = Keck # 1684; MDS ID # 73, 171 = Keck # 1689; MDS ID # 21, 187 = Keck # 1833; MDS ID # 39, 249 = Keck # 1922; MDS ID # 15,185 = Keck # 1964; MDS ID # 87, 154 = Keck # 1968; MDS ID # 24, 153, 193 = Keck # 2078; MDS ID # 18, 183 = Keck # 2121; MDS ID # 122, 197 = Keck # 2177; MDS ID # 116, 299 = Keck # 2686; MDS ID # 53, 218 = Keck # 2764 (see Sect. 5.1). | 1375 | 23.20 | 22.67 | 22.17 | 21.37 | 0.6284 | 0.60 | 0.10 |
| 26eeBecause of the better resolution of the HST observations, an individual galaxy in the Keck image may be associated with more than one galaxy in the corresponding HST image. Therefore, these HST galaxies have the same Keck number. The following pairs occur in this field : MDS ID # 25, 44 = Keck # 1375; MDS ID # 26, 162 = Keck # 1684; MDS ID # 73, 171 = Keck # 1689; MDS ID # 21, 187 = Keck # 1833; MDS ID # 39, 249 = Keck # 1922; MDS ID # 15,185 = Keck # 1964; MDS ID # 87, 154 = Keck # 1968; MDS ID # 24, 153, 193 = Keck # 2078; MDS ID # 18, 183 = Keck # 2121; MDS ID # 122, 197 = Keck # 2177; MDS ID # 116, 299 = Keck # 2686; MDS ID # 53, 218 = Keck # 2764 (see Sect. 5.1). | 1684 | 23.57 | 23.14 | 22.42 | 21.82 | |||
| 27 | 1767 | 24.40 | 23.28 | 22.48 | 21.05 | |||
| 28 | 2680 | 23.99 | 23.28 | 22.64 | 21.39 | 1.0235 | 1.90 | 0.20 |
| 29 | 1642 | 23.12 | 22.68 | 22.19 | 21.40 | |||
| 30 | 2144 | 23.83 | 23.31 | 22.65 | 22.15 | 0.8444 | 1.10 | 0.20 |
| 31 | 2061 | 24.15 | 23.22 | 22.75 | 21.08 | |||
| 32 | 1854 | 23.46 | 22.67 | 22.24 | 21.95 | |||
| 33 | 2212 | 23.54 | 22.65 | 21.89 | 21.04 | 0.3297 | 1.90 | 0.20 |
| 34 | 1749 | 23.67 | 22.94 | 22.74 | 21.93 | 0.0811 | 1.60 | 0.40 |
| 35 | 1577 | 22.34 | 21.54 | -1.00 | -1.00 | |||
| 36 | 2110 | 23.57 | 23.06 | 22.88 | 21.64 | 1.0858 | 1.10 | 0.10 |
| 37 | 2075 | 23.38 | 22.96 | 22.78 | 21.46 | 0.8447 | 0.80 | 0.10 |
| 38 | 1994 | -1.00 | 23.67 | 23.49 | 21.15 | |||
| 39eeBecause of the better resolution of the HST observations, an individual galaxy in the Keck image may be associated with more than one galaxy in the corresponding HST image. Therefore, these HST galaxies have the same Keck number. The following pairs occur in this field : MDS ID # 25, 44 = Keck # 1375; MDS ID # 26, 162 = Keck # 1684; MDS ID # 73, 171 = Keck # 1689; MDS ID # 21, 187 = Keck # 1833; MDS ID # 39, 249 = Keck # 1922; MDS ID # 15,185 = Keck # 1964; MDS ID # 87, 154 = Keck # 1968; MDS ID # 24, 153, 193 = Keck # 2078; MDS ID # 18, 183 = Keck # 2121; MDS ID # 122, 197 = Keck # 2177; MDS ID # 116, 299 = Keck # 2686; MDS ID # 53, 218 = Keck # 2764 (see Sect. 5.1). | 1922 | 23.19 | 22.89 | 22.77 | 21.66 | 1.3341 | 1.30 | 0.20 |
| 40 | 2232 | -1.00 | 23.01 | 22.09 | 21.08 | |||
| 41 | 1473 | 26.56 | 25.05 | 23.28 | 21.67 | |||
| 42 | 2092 | 24.40 | 23.77 | 22.57 | 21.90 | 0.5162 | 1.50 | 0.40 |
| 43 | 2664 | 23.82 | 23.42 | 22.64 | 21.82 | 0.7208 | 0.90 | 0.10 |
| 44eeBecause of the better resolution of the HST observations, an individual galaxy in the Keck image may be associated with more than one galaxy in the corresponding HST image. Therefore, these HST galaxies have the same Keck number. The following pairs occur in this field : MDS ID # 25, 44 = Keck # 1375; MDS ID # 26, 162 = Keck # 1684; MDS ID # 73, 171 = Keck # 1689; MDS ID # 21, 187 = Keck # 1833; MDS ID # 39, 249 = Keck # 1922; MDS ID # 15,185 = Keck # 1964; MDS ID # 87, 154 = Keck # 1968; MDS ID # 24, 153, 193 = Keck # 2078; MDS ID # 18, 183 = Keck # 2121; MDS ID # 122, 197 = Keck # 2177; MDS ID # 116, 299 = Keck # 2686; MDS ID # 53, 218 = Keck # 2764 (see Sect. 5.1). | 1375 | 23.20 | 22.67 | 22.17 | 21.37 | 0.5780 | ||
| 45 | 2415 | 24.99 | 23.74 | 23.24 | 21.51 | 0.8451 | 2.40 | 0.30 |
| 46 | 2477 | 24.24 | 23.30 | 22.91 | 21.84 | 0.1034 | 2.80 | 1.00 |
| 47 | 1913 | 25.08 | 23.93 | 23.53 | 22.01 | |||
| 48 | 1989 | 24.02 | 23.55 | 23.39 | 22.05 | |||
| 49 | 2640 | 24.79 | 24.06 | 23.34 | 22.00 | 0.9131 | 1.90 | 0.30 |
| 50 | 1912 | 24.69 | 24.21 | 22.91 | 21.63 | 0.8444 | 2.20 | 0.40 |
| 51 | 2506 | 24.65 | 23.86 | 23.28 | 21.73 | |||
| 52 | 1392 | 23.63 | 23.08 | 22.66 | 21.86 | 0.9142 | 1.00 | 0.10 |
| 53 | 2764 | 24.22 | 23.45 | 22.95 | 22.13 | 0.7210 | 1.10 | 0.20 |
| 54 | 2103 | 24.25 | 23.52 | 23.04 | 21.82 | 0.3524 | 1.10 | 0.30 |
| 55 | 2400 | 23.79 | 23.35 | 23.05 | 21.77 | 1.1079 | 1.30 | 0.20 |
| 56 | 2219 | 24.84 | 23.53 | 23.64 | 21.64 | |||
| 57 | 2213 | 24.17 | 23.75 | 23.08 | 22.37 | 0.8380 | 1.00 | 0.20 |
| 58 | 1915 | 24.58 | 23.84 | 23.12 | 21.97 | |||
| 59 | 1608 | 23.78 | 23.19 | 22.87 | 21.79 | |||
| 60 | 2323 | 23.95 | 23.64 | 23.26 | 21.65 | |||
| 61 | 2651 | 24.45 | 23.67 | 23.20 | 22.55 | |||
| 62 | 2059 | 24.72 | 23.91 | 23.20 | 21.87 | |||
| 63 | 1534 | 23.89 | 23.33 | 22.90 | 21.80 | |||
| 64 | 1943 | 23.68 | 23.27 | 23.23 | 21.78 | |||
| 65 | 1797 | 23.52 | 22.91 | 22.67 | 21.78 | |||
| 66 | 2733 | 24.16 | 23.61 | 23.15 | 22.13 | 0.4072 | 0.50 | 0.20 |
| 67 | 1973 | 24.93 | 23.74 | 22.97 | 22.07 | |||
| 68 | 1470 | 24.77 | 23.98 | 23.33 | 21.97 | 0.4416 | 2.00 | 0.50 |
| 69 | 1947 | 24.30 | 24.36 | 24.38 | 21.56 | |||
| 71 | 1717 | 24.63 | 24.63 | 23.70 | 22.09 | |||
| 72 | 1635 | 24.97 | 24.27 | 23.78 | 21.90 | |||
| 73eeBecause of the better resolution of the HST observations, an individual galaxy in the Keck image may be associated with more than one galaxy in the corresponding HST image. Therefore, these HST galaxies have the same Keck number. The following pairs occur in this field : MDS ID # 25, 44 = Keck # 1375; MDS ID # 26, 162 = Keck # 1684; MDS ID # 73, 171 = Keck # 1689; MDS ID # 21, 187 = Keck # 1833; MDS ID # 39, 249 = Keck # 1922; MDS ID # 15,185 = Keck # 1964; MDS ID # 87, 154 = Keck # 1968; MDS ID # 24, 153, 193 = Keck # 2078; MDS ID # 18, 183 = Keck # 2121; MDS ID # 122, 197 = Keck # 2177; MDS ID # 116, 299 = Keck # 2686; MDS ID # 53, 218 = Keck # 2764 (see Sect. 5.1). | 1689 | 23.58 | 23.35 | 23.03 | 21.79 | 1.4679 | 2.00 | 0.20 |
| 74 | 1798 | 23.77 | 23.75 | 23.48 | 22.19 | |||
| 75 | 2563 | 23.18 | 22.28 | 22.23 | 21.11 | |||
| 76 | 1926 | 25.78 | 24.89 | 24.69 | 22.09 | |||
| 77 | 2013 | 25.66 | 25.52 | 24.03 | 22.03 | |||
| 78 | 1558 | 24.10 | 23.37 | 22.90 | 22.03 | |||
| 79 | 1412 | 23.54 | 22.94 | -1.00 | -1.00 | 0.9137 | 1.60 | 0.20 |
| 80 | 2442 | 23.79 | 23.37 | 23.14 | 22.04 | |||
| 81 | 2692 | 24.61 | 24.11 | 24.07 | 22.71 | |||
| 82 | 2055 | 24.35 | 22.65 | 21.50 | 19.95 | 0.8266 | 3.90 | 0.20 |
| 83 | 2466 | 24.40 | 24.10 | 23.56 | 22.07 | |||
| 84 | 2603 | 24.43 | 24.21 | -1.00 | -1.00 | |||
| 85 | 1690 | 25.49 | 25.39 | 23.76 | 22.02 | |||
| 86 | 1855 | 25.18 | 24.62 | 24.02 | 22.26 | |||
| 87eeBecause of the better resolution of the HST observations, an individual galaxy in the Keck image may be associated with more than one galaxy in the corresponding HST image. Therefore, these HST galaxies have the same Keck number. The following pairs occur in this field : MDS ID # 25, 44 = Keck # 1375; MDS ID # 26, 162 = Keck # 1684; MDS ID # 73, 171 = Keck # 1689; MDS ID # 21, 187 = Keck # 1833; MDS ID # 39, 249 = Keck # 1922; MDS ID # 15,185 = Keck # 1964; MDS ID # 87, 154 = Keck # 1968; MDS ID # 24, 153, 193 = Keck # 2078; MDS ID # 18, 183 = Keck # 2121; MDS ID # 122, 197 = Keck # 2177; MDS ID # 116, 299 = Keck # 2686; MDS ID # 53, 218 = Keck # 2764 (see Sect. 5.1). | 1968 | 23.70 | 23.53 | 22.92 | 22.20 | |||
| 88 | 2336 | 25.10 | -1.00 | 25.04 | 22.26 | 0.8251 | 1.70 | 0.50 |
| 89 | 1679 | 23.90 | 23.53 | 23.32 | 21.94 | |||
| 90 | 1811 | 22.37 | 20.89 | 20.41 | 19.19 | |||
| 91 | 1576 | 24.66 | 24.46 | 25.15 | 21.93 | |||
| 92 | 2191 | -1.00 | 24.50 | 23.51 | 22.06 | |||
| 93 | 1882 | 25.40 | 25.09 | -1.00 | -1.00 | |||
| 94 | 1784 | 24.35 | 23.95 | 23.30 | 22.16 | |||
| 95 | 1511 | 24.00 | 23.87 | 23.31 | 22.24 | 1.3351 | 1.80 | 0.30 |
| 96 | 2270 | 24.60 | 24.03 | 25.01 | 22.22 | |||
| 97 | 1515 | 25.14 | 24.43 | 25.77 | 22.52 | |||
| 98 | 1573 | 24.57 | 24.58 | -1.00 | -1.00 | |||
| 99 | 2294 | 24.93 | -1.00 | 23.32 | 21.76 | |||
| 100 | 2145 | 25.82 | 25.36 | -1.00 | -1.00 | |||
| 101 | 2034 | 25.70 | 26.26 | -1.00 | -1.00 | |||
| 102 | 1546 | 25.06 | 24.58 | 24.31 | 22.59 | |||
| 103 | 2565 | 25.13 | 24.84 | 24.51 | 22.22 | |||
| 104 | 2768 | 25.17 | 24.47 | 24.47 | 22.25 | |||
| 105 | 1702 | 25.06 | 24.30 | 24.68 | 22.78 | |||
| 106 | 1881 | 24.74 | 24.47 | 23.43 | 21.87 | |||
| 107 | 1451 | 25.55 | 24.90 | -1.00 | -1.00 | |||
| 108 | 2286 | 24.39 | 24.05 | 23.72 | 21.83 | |||
| 109 | 2056 | 24.39 | 24.04 | -1.00 | -1.00 | |||
| 110 | 2341 | 25.74 | 24.89 | 24.58 | 22.16 | |||
| 111 | 2404 | 25.34 | 24.46 | 24.71 | 22.48 | |||
| 112 | 2054 | 24.80 | 24.35 | 23.47 | 22.61 | |||
| 114 | 2459 | 24.59 | 24.16 | 23.68 | 22.17 | |||
| 115 | 1846 | 24.42 | 24.52 | 22.97 | 21.06 | 0.8465 | 2.70 | 0.20 |
| 116eeBecause of the better resolution of the HST observations, an individual galaxy in the Keck image may be associated with more than one galaxy in the corresponding HST image. Therefore, these HST galaxies have the same Keck number. The following pairs occur in this field : MDS ID # 25, 44 = Keck # 1375; MDS ID # 26, 162 = Keck # 1684; MDS ID # 73, 171 = Keck # 1689; MDS ID # 21, 187 = Keck # 1833; MDS ID # 39, 249 = Keck # 1922; MDS ID # 15,185 = Keck # 1964; MDS ID # 87, 154 = Keck # 1968; MDS ID # 24, 153, 193 = Keck # 2078; MDS ID # 18, 183 = Keck # 2121; MDS ID # 122, 197 = Keck # 2177; MDS ID # 116, 299 = Keck # 2686; MDS ID # 53, 218 = Keck # 2764 (see Sect. 5.1). | 2686 | 25.07 | 24.93 | 23.32 | 22.13 | |||
| 117 | 1485 | 24.76 | 24.31 | 23.56 | 22.75 | |||
| 118 | 2004 | -1.00 | -1.00 | 24.21 | 22.31 | |||
| 119 | 2701 | 25.19 | 24.57 | 26.07 | 22.39 | |||
| 120 | 2131 | 24.09 | 23.52 | 24.37 | 22.23 | |||
| 121 | 1559 | -1.00 | -1.00 | 25.55 | 23.03 | |||
| 122eeBecause of the better resolution of the HST observations, an individual galaxy in the Keck image may be associated with more than one galaxy in the corresponding HST image. Therefore, these HST galaxies have the same Keck number. The following pairs occur in this field : MDS ID # 25, 44 = Keck # 1375; MDS ID # 26, 162 = Keck # 1684; MDS ID # 73, 171 = Keck # 1689; MDS ID # 21, 187 = Keck # 1833; MDS ID # 39, 249 = Keck # 1922; MDS ID # 15,185 = Keck # 1964; MDS ID # 87, 154 = Keck # 1968; MDS ID # 24, 153, 193 = Keck # 2078; MDS ID # 18, 183 = Keck # 2121; MDS ID # 122, 197 = Keck # 2177; MDS ID # 116, 299 = Keck # 2686; MDS ID # 53, 218 = Keck # 2764 (see Sect. 5.1). | 2177 | 25.38 | 24.21 | 24.42 | 21.87 | |||
| 123 | 1741 | 25.87 | 24.71 | 24.23 | 21.84 | |||
| 124 | 1672 | 23.94 | 23.27 | -1.00 | -1.00 | |||
| 126 | 1769 | 20.15 | 19.79 | 19.42 | 18.85 | |||
| 127 | 1681 | 24.98 | 23.50 | 23.92 | 22.02 | |||
| 128 | 1558 | 24.10 | 23.37 | 22.90 | 22.03 | |||
| 130 | 1668 | 24.15 | 23.70 | 23.66 | 21.90 | |||
| 131 | 1880 | 25.79 | 25.12 | -1.00 | -1.00 | |||
| 132 | 1843 | 25.49 | 24.93 | -1.00 | -1.00 | |||
| 133 | 1747 | 24.61 | 24.66 | 23.84 | 22.05 | |||
| 134 | 1554 | 24.03 | 23.50 | 23.09 | 21.94 | |||
| 135 | 2510 | 25.15 | 24.89 | 25.07 | 22.05 | |||
| 136 | 1824 | 25.51 | 24.53 | 24.19 | 23.24 | |||
| 138 | 1715 | 24.87 | 23.98 | -1.00 | -1.00 | |||
| 139 | 2163 | 25.32 | 25.15 | -1.00 | -1.00 | |||
| 141 | 1897 | 25.80 | 25.53 | 24.33 | 22.24 | |||
| 142 | 1681 | 24.98 | 23.50 | 23.92 | 22.02 | |||
| 143 | 2233 | 25.70 | 25.05 | 24.07 | 21.99 | |||
| 144 | 1423 | 23.98 | 23.38 | 23.52 | -1.00 | |||
| 145 | 1807 | 25.23 | 26.43 | 26.73 | 22.30 | |||
| 146 | 2139 | 24.86 | 25.19 | -1.00 | 22.39 | |||
| 147 | 2288 | 24.44 | 23.87 | -1.00 | -1.00 | |||
| 148 | 1839 | -1.00 | -1.00 | -1.00 | 22.11 | |||
| 149 | 2526 | 25.06 | 24.77 | 24.38 | 22.57 | |||
| 150 | 2007 | 25.08 | 23.99 | -1.00 | -1.00 | |||
| 151 | 1675 | 25.07 | 24.47 | 25.88 | 21.96 | |||
| 152 | 1649 | 25.61 | 25.00 | 23.90 | 22.40 | |||
| 153eeBecause of the better resolution of the HST observations, an individual galaxy in the Keck image may be associated with more than one galaxy in the corresponding HST image. Therefore, these HST galaxies have the same Keck number. The following pairs occur in this field : MDS ID # 25, 44 = Keck # 1375; MDS ID # 26, 162 = Keck # 1684; MDS ID # 73, 171 = Keck # 1689; MDS ID # 21, 187 = Keck # 1833; MDS ID # 39, 249 = Keck # 1922; MDS ID # 15,185 = Keck # 1964; MDS ID # 87, 154 = Keck # 1968; MDS ID # 24, 153, 193 = Keck # 2078; MDS ID # 18, 183 = Keck # 2121; MDS ID # 122, 197 = Keck # 2177; MDS ID # 116, 299 = Keck # 2686; MDS ID # 53, 218 = Keck # 2764 (see Sect. 5.1). | 2078 | 24.37 | 23.36 | 22.42 | 21.00 | |||
| 154eeBecause of the better resolution of the HST observations, an individual galaxy in the Keck image may be associated with more than one galaxy in the corresponding HST image. Therefore, these HST galaxies have the same Keck number. The following pairs occur in this field : MDS ID # 25, 44 = Keck # 1375; MDS ID # 26, 162 = Keck # 1684; MDS ID # 73, 171 = Keck # 1689; MDS ID # 21, 187 = Keck # 1833; MDS ID # 39, 249 = Keck # 1922; MDS ID # 15,185 = Keck # 1964; MDS ID # 87, 154 = Keck # 1968; MDS ID # 24, 153, 193 = Keck # 2078; MDS ID # 18, 183 = Keck # 2121; MDS ID # 122, 197 = Keck # 2177; MDS ID # 116, 299 = Keck # 2686; MDS ID # 53, 218 = Keck # 2764 (see Sect. 5.1). | 1968 | 23.70 | 23.53 | 22.92 | 22.20 | |||
| 156 | 1990 | 24.99 | 23.82 | 23.10 | 22.54 | |||
| 157 | 2309 | 24.13 | 23.69 | 23.64 | 21.74 | |||
| 158eeBecause of the better resolution of the HST observations, an individual galaxy in the Keck image may be associated with more than one galaxy in the corresponding HST image. Therefore, these HST galaxies have the same Keck number. The following pairs occur in this field : MDS ID # 25, 44 = Keck # 1375; MDS ID # 26, 162 = Keck # 1684; MDS ID # 73, 171 = Keck # 1689; MDS ID # 21, 187 = Keck # 1833; MDS ID # 39, 249 = Keck # 1922; MDS ID # 15,185 = Keck # 1964; MDS ID # 87, 154 = Keck # 1968; MDS ID # 24, 153, 193 = Keck # 2078; MDS ID # 18, 183 = Keck # 2121; MDS ID # 122, 197 = Keck # 2177; MDS ID # 116, 299 = Keck # 2686; MDS ID # 53, 218 = Keck # 2764 (see Sect. 5.1). | 1964 | 22.94 | 22.31 | 21.66 | 20.81 | |||
| 159 | 1388 | 25.52 | 24.92 | 23.98 | 22.46 | |||
| 160 | 1959 | 23.99 | 23.52 | 23.21 | 22.10 | |||
| 161 | 1980 | 25.14 | 25.46 | 24.97 | 22.37 | |||
| 162eeBecause of the better resolution of the HST observations, an individual galaxy in the Keck image may be associated with more than one galaxy in the corresponding HST image. Therefore, these HST galaxies have the same Keck number. The following pairs occur in this field : MDS ID # 25, 44 = Keck # 1375; MDS ID # 26, 162 = Keck # 1684; MDS ID # 73, 171 = Keck # 1689; MDS ID # 21, 187 = Keck # 1833; MDS ID # 39, 249 = Keck # 1922; MDS ID # 15,185 = Keck # 1964; MDS ID # 87, 154 = Keck # 1968; MDS ID # 24, 153, 193 = Keck # 2078; MDS ID # 18, 183 = Keck # 2121; MDS ID # 122, 197 = Keck # 2177; MDS ID # 116, 299 = Keck # 2686; MDS ID # 53, 218 = Keck # 2764 (see Sect. 5.1). | 1684 | 23.57 | 23.14 | 22.42 | 21.82 | |||
| 163 | 2168 | 24.82 | 25.11 | 23.25 | 20.59 | |||
| 164 | 2112 | 25.54 | 26.80 | 24.51 | 22.89 | |||
| 165 | 1610 | 26.21 | 25.29 | 24.30 | 22.39 | |||
| 166 | 1995 | 25.77 | 24.73 | 24.82 | 21.98 | |||
| 168 | 2005 | 25.11 | 24.06 | -1.00 | 22.34 | |||
| 169 | 1709 | 23.94 | 24.20 | 23.34 | 21.88 | |||
| 170 | 2730 | 26.00 | 25.06 | 24.28 | 22.46 | |||
| 171eeBecause of the better resolution of the HST observations, an individual galaxy in the Keck image may be associated with more than one galaxy in the corresponding HST image. Therefore, these HST galaxies have the same Keck number. The following pairs occur in this field : MDS ID # 25, 44 = Keck # 1375; MDS ID # 26, 162 = Keck # 1684; MDS ID # 73, 171 = Keck # 1689; MDS ID # 21, 187 = Keck # 1833; MDS ID # 39, 249 = Keck # 1922; MDS ID # 15,185 = Keck # 1964; MDS ID # 87, 154 = Keck # 1968; MDS ID # 24, 153, 193 = Keck # 2078; MDS ID # 18, 183 = Keck # 2121; MDS ID # 122, 197 = Keck # 2177; MDS ID # 116, 299 = Keck # 2686; MDS ID # 53, 218 = Keck # 2764 (see Sect. 5.1). | 1689 | 23.58 | 23.35 | 23.03 | 21.79 | |||
| 172 | 2307 | 24.86 | 24.27 | 24.04 | 22.26 | |||
| 173 | 2313 | 25.48 | 25.54 | -1.00 | -1.00 | |||
| 174 | 2707 | 25.50 | 24.62 | 23.41 | 22.35 | |||
| 179 | 2666 | 24.09 | 23.65 | 23.28 | 22.19 | |||
| 181 | 2036 | 26.06 | 24.78 | -1.00 | -1.00 | |||
| 182 | 2180 | 25.22 | 24.31 | -1.00 | -1.00 | |||
| 183eeBecause of the better resolution of the HST observations, an individual galaxy in the Keck image may be associated with more than one galaxy in the corresponding HST image. Therefore, these HST galaxies have the same Keck number. The following pairs occur in this field : MDS ID # 25, 44 = Keck # 1375; MDS ID # 26, 162 = Keck # 1684; MDS ID # 73, 171 = Keck # 1689; MDS ID # 21, 187 = Keck # 1833; MDS ID # 39, 249 = Keck # 1922; MDS ID # 15,185 = Keck # 1964; MDS ID # 87, 154 = Keck # 1968; MDS ID # 24, 153, 193 = Keck # 2078; MDS ID # 18, 183 = Keck # 2121; MDS ID # 122, 197 = Keck # 2177; MDS ID # 116, 299 = Keck # 2686; MDS ID # 53, 218 = Keck # 2764 (see Sect. 5.1). | 2121 | 23.73 | 22.84 | 22.04 | 20.89 | |||
| 185 | 1742 | 25.82 | 28.33 | -1.00 | 22.14 | |||
| 186 | 1648 | 25.94 | 24.64 | -1.00 | -1.00 | |||
| 187eeBecause of the better resolution of the HST observations, an individual galaxy in the Keck image may be associated with more than one galaxy in the corresponding HST image. Therefore, these HST galaxies have the same Keck number. The following pairs occur in this field : MDS ID # 25, 44 = Keck # 1375; MDS ID # 26, 162 = Keck # 1684; MDS ID # 73, 171 = Keck # 1689; MDS ID # 21, 187 = Keck # 1833; MDS ID # 39, 249 = Keck # 1922; MDS ID # 15,185 = Keck # 1964; MDS ID # 87, 154 = Keck # 1968; MDS ID # 24, 153, 193 = Keck # 2078; MDS ID # 18, 183 = Keck # 2121; MDS ID # 122, 197 = Keck # 2177; MDS ID # 116, 299 = Keck # 2686; MDS ID # 53, 218 = Keck # 2764 (see Sect. 5.1). | 1833 | 23.99 | 23.03 | 22.19 | 20.75 | |||
| 188 | 1791 | 25.19 | 24.35 | -1.00 | -1.00 | |||
| 190 | 2074 | 25.86 | 25.34 | 24.53 | 22.58 | |||
| 191 | 1771 | -1.00 | 25.97 | 23.60 | 22.45 | |||
| 193eeBecause of the better resolution of the HST observations, an individual galaxy in the Keck image may be associated with more than one galaxy in the corresponding HST image. Therefore, these HST galaxies have the same Keck number. The following pairs occur in this field : MDS ID # 25, 44 = Keck # 1375; MDS ID # 26, 162 = Keck # 1684; MDS ID # 73, 171 = Keck # 1689; MDS ID # 21, 187 = Keck # 1833; MDS ID # 39, 249 = Keck # 1922; MDS ID # 15,185 = Keck # 1964; MDS ID # 87, 154 = Keck # 1968; MDS ID # 24, 153, 193 = Keck # 2078; MDS ID # 18, 183 = Keck # 2121; MDS ID # 122, 197 = Keck # 2177; MDS ID # 116, 299 = Keck # 2686; MDS ID # 53, 218 = Keck # 2764 (see Sect. 5.1). | 2078 | 24.37 | 23.36 | 22.42 | 21.00 | |||
| 194 | 1436 | 24.51 | 24.81 | 23.98 | 22.81 | |||
| 195 | 1414 | 25.09 | 24.59 | 24.33 | 22.43 | |||
| 197eeBecause of the better resolution of the HST observations, an individual galaxy in the Keck image may be associated with more than one galaxy in the corresponding HST image. Therefore, these HST galaxies have the same Keck number. The following pairs occur in this field : MDS ID # 25, 44 = Keck # 1375; MDS ID # 26, 162 = Keck # 1684; MDS ID # 73, 171 = Keck # 1689; MDS ID # 21, 187 = Keck # 1833; MDS ID # 39, 249 = Keck # 1922; MDS ID # 15,185 = Keck # 1964; MDS ID # 87, 154 = Keck # 1968; MDS ID # 24, 153, 193 = Keck # 2078; MDS ID # 18, 183 = Keck # 2121; MDS ID # 122, 197 = Keck # 2177; MDS ID # 116, 299 = Keck # 2686; MDS ID # 53, 218 = Keck # 2764 (see Sect. 5.1). | 2177 | 25.38 | 24.21 | 24.42 | 21.87 | |||
| 199 | 1560 | 26.21 | 26.62 | -1.00 | 23.34 | |||
| 202 | 1743 | -1.00 | 25.02 | -1.00 | 22.42 | |||
| 205 | 2463 | 23.80 | 23.30 | 23.09 | 22.03 | |||
| 206 | 2425 | 25.33 | 24.71 | 25.54 | 22.52 | |||
| 209 | 2387 | 26.13 | 26.29 | 24.36 | 22.31 | |||
| 210 | 2535 | 25.01 | 24.83 | 24.19 | 22.59 | |||
| 213 | 1975 | 25.52 | 25.25 | 24.83 | 22.41 | |||
| 214 | 1652 | 25.01 | 24.64 | -1.00 | -1.00 | |||
| 215 | 2324 | 26.70 | 25.19 | 24.56 | 22.52 | |||
| 217 | 1783 | 24.26 | 23.85 | 23.26 | 22.15 | |||
| 218eeBecause of the better resolution of the HST observations, an individual galaxy in the Keck image may be associated with more than one galaxy in the corresponding HST image. Therefore, these HST galaxies have the same Keck number. The following pairs occur in this field : MDS ID # 25, 44 = Keck # 1375; MDS ID # 26, 162 = Keck # 1684; MDS ID # 73, 171 = Keck # 1689; MDS ID # 21, 187 = Keck # 1833; MDS ID # 39, 249 = Keck # 1922; MDS ID # 15,185 = Keck # 1964; MDS ID # 87, 154 = Keck # 1968; MDS ID # 24, 153, 193 = Keck # 2078; MDS ID # 18, 183 = Keck # 2121; MDS ID # 122, 197 = Keck # 2177; MDS ID # 116, 299 = Keck # 2686; MDS ID # 53, 218 = Keck # 2764 (see Sect. 5.1). | 2764 | 24.22 | 23.45 | 22.95 | 22.13 | |||
| 222 | 1775 | 26.94 | 27.53 | -1.00 | -1.00 | |||
| 224 | 1819 | -1.00 | 25.11 | -1.00 | -1.00 | |||
| 227 | 1935 | 25.38 | 25.35 | 24.52 | 22.23 | |||
| 235 | 1408 | 26.20 | 26.29 | 25.33 | 22.43 | |||
| 239 | 1866 | 24.91 | 24.27 | 23.87 | 22.22 | |||
| 244 | 2225 | 24.51 | 24.26 | -1.00 | 22.36 | |||
| 246 | 2344 | 26.51 | 25.16 | 24.58 | 21.88 | |||
| 248 | 2014 | -1.00 | 26.13 | -1.00 | -1.00 | |||
| 249eeBecause of the better resolution of the HST observations, an individual galaxy in the Keck image may be associated with more than one galaxy in the corresponding HST image. Therefore, these HST galaxies have the same Keck number. The following pairs occur in this field : MDS ID # 25, 44 = Keck # 1375; MDS ID # 26, 162 = Keck # 1684; MDS ID # 73, 171 = Keck # 1689; MDS ID # 21, 187 = Keck # 1833; MDS ID # 39, 249 = Keck # 1922; MDS ID # 15,185 = Keck # 1964; MDS ID # 87, 154 = Keck # 1968; MDS ID # 24, 153, 193 = Keck # 2078; MDS ID # 18, 183 = Keck # 2121; MDS ID # 122, 197 = Keck # 2177; MDS ID # 116, 299 = Keck # 2686; MDS ID # 53, 218 = Keck # 2764 (see Sect. 5.1). | 1922 | 23.19 | 22.89 | 22.77 | 21.66 | |||
| 252 | 2754 | 25.30 | 25.24 | 24.25 | 22.31 | |||
| 256 | 1636 | 25.77 | 25.04 | -1.00 | -1.00 | |||
| 261 | 1919 | 24.62 | 24.22 | -1.00 | -1.00 | |||
| 264 | 2224 | 25.76 | 28.35 | 24.26 | 22.29 | |||
| 268 | 2276 | 28.73 | 26.42 | -1.00 | -1.00 | |||
| 277 | 2214 | 24.46 | 24.31 | 25.40 | 22.27 | |||
| 281 | 1463 | 27.50 | 26.91 | -1.00 | -1.00 | |||
| 283 | 1832 | 24.19 | 23.67 | -1.00 | -1.00 | |||
| 298 | 1671 | 25.15 | 24.38 | -1.00 | -1.00 | |||
| 299eeBecause of the better resolution of the HST observations, an individual galaxy in the Keck image may be associated with more than one galaxy in the corresponding HST image. Therefore, these HST galaxies have the same Keck number. The following pairs occur in this field : MDS ID # 25, 44 = Keck # 1375; MDS ID # 26, 162 = Keck # 1684; MDS ID # 73, 171 = Keck # 1689; MDS ID # 21, 187 = Keck # 1833; MDS ID # 39, 249 = Keck # 1922; MDS ID # 15,185 = Keck # 1964; MDS ID # 87, 154 = Keck # 1968; MDS ID # 24, 153, 193 = Keck # 2078; MDS ID # 18, 183 = Keck # 2121; MDS ID # 122, 197 = Keck # 2177; MDS ID # 116, 299 = Keck # 2686; MDS ID # 53, 218 = Keck # 2764 (see Sect. 5.1). | 2686 | 25.07 | 24.93 | 23.32 | 22.13 | |||
| 301 | 1597 | 25.67 | 24.57 | 24.59 | 22.04 | |||
| 311 | 2012 | 25.46 | 23.38 | -1.00 | -1.00 | |||
| 331 | 1959 | 23.99 | 23.52 | 23.21 | 22.10 | |||
| 338 | 2636 | 24.81 | 24.12 | -1.00 | -1.00 | |||
| 344 | 2282 | 24.24 | -1.00 | 23.56 | 21.92 | |||
| MDS ID #aaMDS identification number as given in Table 1 (see Sect. 3.1.1). | Keck #bbCorresponding number from the Keck photometry tables (see Paper II). | ccKeck aperture photometry. A value of indicates no detection in that band (see Paper II). | ccKeck aperture photometry. A value of indicates no detection in that band (see Paper II). | ccKeck aperture photometry. A value of indicates no detection in that band (see Paper II). | ccKeck aperture photometry. A value of indicates no detection in that band (see Paper II). | z | AgeddGalaxy age and errors (in Gyr) as determined from a comparison between the Gyr Bruzual & Charlot population synthesis model and the broad band AB magnitudes derived from the Keck photometry. Upper limits are indicated as values with no errors (see Sect. 5.2 and also Paper II). | AgeddGalaxy age and errors (in Gyr) as determined from a comparison between the Gyr Bruzual & Charlot population synthesis model and the broad band AB magnitudes derived from the Keck photometry. Upper limits are indicated as values with no errors (see Sect. 5.2 and also Paper II). |
|---|---|---|---|---|---|---|---|---|
| 2 | 2463 | 21.51 | 19.95 | 19.30 | 18.43 | 0.2415 | 6.00 | 0.50 |
| 3 | 3201 | 21.89 | 20.77 | 20.14 | 19.30 | 0.2746 | 2.80 | 0.20 |
| 7 | 2855 | 24.19 | 23.34 | 21.87 | 19.97 | 0.8964 | 3.80 | 0.10 |
| 8 | 2637 | 25.95 | 24.13 | 22.12 | 20.34 | |||
| 9eeBecause of the better resolution of the HST observations, an individual galaxy in the Keck image may be associated with more than one galaxy in the corresponding HST image. Therefore, these HST galaxies have the same Keck number. The following pairs occur in this field : MDS ID # 63, 177 = Keck # 1331; MDS ID # 67, 289 = Keck # 1989; MDS ID # 31, 141 = Keck # 2132; MDS ID # 152, 175 = Keck # 2156; MDS ID # 50, 136 = Keck # 2232; MDS ID # 29, 126 = Keck # 2307; MDS ID # 9, 165 = Keck # 2459; MDS ID # 183, 276 = Keck # 2770; MDS ID # 10, 376 = Keck # 2891; MDS ID # 161, 277 = Keck # 3367; MDS ID # 92, 36 = Keck # 3405 (see Sect. 5.1). | 2459 | 24.60 | 23.29 | 22.18 | 20.53 | 0.8956 | 3.50 | 0.20 |
| 10eeBecause of the better resolution of the HST observations, an individual galaxy in the Keck image may be associated with more than one galaxy in the corresponding HST image. Therefore, these HST galaxies have the same Keck number. The following pairs occur in this field : MDS ID # 63, 177 = Keck # 1331; MDS ID # 67, 289 = Keck # 1989; MDS ID # 31, 141 = Keck # 2132; MDS ID # 152, 175 = Keck # 2156; MDS ID # 50, 136 = Keck # 2232; MDS ID # 29, 126 = Keck # 2307; MDS ID # 9, 165 = Keck # 2459; MDS ID # 183, 276 = Keck # 2770; MDS ID # 10, 376 = Keck # 2891; MDS ID # 161, 277 = Keck # 3367; MDS ID # 92, 36 = Keck # 3405 (see Sect. 5.1). | 2891 | 26.29 | 23.29 | 22.37 | 20.57 | |||
| 12 | 2886 | 23.34 | 22.54 | 22.06 | 21.04 | |||
| 13 | 3352 | 25.43 | 23.70 | 22.41 | 20.60 | 0.8978 | ||
| 16 | 2591 | 23.68 | 23.04 | 22.28 | 20.81 | |||
| 18 | 3719 | 24.53 | 23.51 | 22.70 | 20.86 | 0.9032 | 3.00 | 0.20 |
| 19 | 2704 | 23.79 | 23.37 | 22.36 | 20.97 | 0.9851 | 2.20 | 0.10 |
| 20 | 1418 | 23.17 | 22.58 | 22.15 | 21.01 | |||
| 21 | 2985 | 24.66 | 23.97 | 22.91 | 21.04 | 0.8990 | 3.00 | 0.20 |
| 22 | 2858 | 22.75 | 22.48 | 22.23 | 20.93 | 1.3757 | 1.70 | 0.10 |
| 23 | 2251 | 25.71 | 23.87 | 22.84 | 21.08 | |||
| 24 | 3594 | 23.36 | 22.81 | 22.38 | 20.85 | 0.8298 | 1.30 | 0.10 |
| 25 | 1618 | 23.42 | 22.78 | 22.07 | 20.79 | 0.8798 | 1.70 | 0.10 |
| 26 | 2155 | 23.04 | 22.37 | 21.93 | 21.32 | |||
| 27 | 2133 | 24.60 | 23.14 | 22.07 | 20.81 | |||
| 28 | 1978 | 24.98 | 24.03 | 23.49 | 21.10 | 0.4964 | ||
| 29eeBecause of the better resolution of the HST observations, an individual galaxy in the Keck image may be associated with more than one galaxy in the corresponding HST image. Therefore, these HST galaxies have the same Keck number. The following pairs occur in this field : MDS ID # 63, 177 = Keck # 1331; MDS ID # 67, 289 = Keck # 1989; MDS ID # 31, 141 = Keck # 2132; MDS ID # 152, 175 = Keck # 2156; MDS ID # 50, 136 = Keck # 2232; MDS ID # 29, 126 = Keck # 2307; MDS ID # 9, 165 = Keck # 2459; MDS ID # 183, 276 = Keck # 2770; MDS ID # 10, 376 = Keck # 2891; MDS ID # 161, 277 = Keck # 3367; MDS ID # 92, 36 = Keck # 3405 (see Sect. 5.1). | 2307 | 23.03 | 22.73 | 22.48 | 21.16 | 0.9005 | 0.70 | 0.10 |
| 30 | 3107 | 23.42 | 22.58 | 22.29 | 21.36 | 0.2392 | 0.80 | 0.20 |
| 31eeBecause of the better resolution of the HST observations, an individual galaxy in the Keck image may be associated with more than one galaxy in the corresponding HST image. Therefore, these HST galaxies have the same Keck number. The following pairs occur in this field : MDS ID # 63, 177 = Keck # 1331; MDS ID # 67, 289 = Keck # 1989; MDS ID # 31, 141 = Keck # 2132; MDS ID # 152, 175 = Keck # 2156; MDS ID # 50, 136 = Keck # 2232; MDS ID # 29, 126 = Keck # 2307; MDS ID # 9, 165 = Keck # 2459; MDS ID # 183, 276 = Keck # 2770; MDS ID # 10, 376 = Keck # 2891; MDS ID # 161, 277 = Keck # 3367; MDS ID # 92, 36 = Keck # 3405 (see Sect. 5.1). | 2132 | 23.76 | 22.80 | 22.35 | 21.32 | |||
| 32 | 2518 | 24.33 | 23.57 | 23.08 | 21.20 | |||
| 33 | 3222 | 24.32 | 23.41 | 22.60 | 21.22 | |||
| 34 | 2607 | 26.60 | 24.58 | 23.11 | 21.43 | |||
| 35 | 2795 | 23.59 | 22.68 | 22.29 | 21.19 | |||
| 36eeBecause of the better resolution of the HST observations, an individual galaxy in the Keck image may be associated with more than one galaxy in the corresponding HST image. Therefore, these HST galaxies have the same Keck number. The following pairs occur in this field : MDS ID # 63, 177 = Keck # 1331; MDS ID # 67, 289 = Keck # 1989; MDS ID # 31, 141 = Keck # 2132; MDS ID # 152, 175 = Keck # 2156; MDS ID # 50, 136 = Keck # 2232; MDS ID # 29, 126 = Keck # 2307; MDS ID # 9, 165 = Keck # 2459; MDS ID # 183, 276 = Keck # 2770; MDS ID # 10, 376 = Keck # 2891; MDS ID # 161, 277 = Keck # 3367; MDS ID # 92, 36 = Keck # 3405 (see Sect. 5.1). | 3405 | 23.98 | 23.51 | 22.71 | 21.20 | 1.1269 | 2.40 | 1.00 |
| 37 | 2242 | -1.00 | 24.00 | 23.08 | 21.31 | |||
| 38 | 1471 | 23.43 | 23.21 | 22.71 | 21.15 | |||
| 39 | 3343 | 24.10 | 23.50 | 23.27 | 21.20 | |||
| 40 | 2837 | 23.44 | 23.62 | 22.44 | 21.14 | 0.8852 | 1.30 | 0.10 |
| 41 | 1510 | 23.81 | 23.35 | 23.18 | 21.64 | 0.9742 | 1.10 | 0.20 |
| 42 | 2512 | 25.34 | 24.68 | 24.14 | 21.43 | |||
| 43 | 1519 | 25.78 | 24.53 | 24.20 | 22.01 | |||
| 44 | 3707 | 24.19 | 23.47 | 23.19 | 21.46 | |||
| 45 | 2134 | 24.35 | 23.45 | 23.26 | 22.22 | 0.4142 | 0.70 | 0.30 |
| 46 | 2651 | 24.91 | 24.16 | 23.37 | 21.32 | |||
| 48 | 2006 | 24.01 | 23.30 | 23.03 | 21.07 | 0.8294 | 1.80 | 0.20 |
| 49 | 3679 | 24.43 | 24.10 | 23.27 | 21.46 | |||
| 50eeBecause of the better resolution of the HST observations, an individual galaxy in the Keck image may be associated with more than one galaxy in the corresponding HST image. Therefore, these HST galaxies have the same Keck number. The following pairs occur in this field : MDS ID # 63, 177 = Keck # 1331; MDS ID # 67, 289 = Keck # 1989; MDS ID # 31, 141 = Keck # 2132; MDS ID # 152, 175 = Keck # 2156; MDS ID # 50, 136 = Keck # 2232; MDS ID # 29, 126 = Keck # 2307; MDS ID # 9, 165 = Keck # 2459; MDS ID # 183, 276 = Keck # 2770; MDS ID # 10, 376 = Keck # 2891; MDS ID # 161, 277 = Keck # 3367; MDS ID # 92, 36 = Keck # 3405 (see Sect. 5.1). | 2232 | 25.50 | 24.60 | 23.72 | 21.26 | 0.8998 | ||
| 51 | 2167 | 24.23 | 23.69 | 23.29 | 21.42 | 0.8893 | 1.70 | 0.20 |
| 54 | 2481 | 24.69 | 23.70 | 23.24 | 21.80 | |||
| 55 | 2117 | 23.95 | 23.43 | 23.00 | 21.48 | |||
| 56 | 2724 | 25.15 | 26.32 | -1.00 | 22.24 | |||
| 57 | 2987 | 26.28 | 24.37 | 24.37 | 21.70 | |||
| 58 | 2007 | 25.54 | 24.50 | 23.76 | 21.42 | |||
| 59 | 3419 | -1.00 | 25.31 | 23.92 | 21.87 | |||
| 60 | 2749 | 26.58 | 24.81 | 22.90 | 21.55 | |||
| 61 | 1366 | 24.53 | 24.00 | 23.69 | 21.58 | |||
| 62 | 2750 | 27.68 | 24.88 | 23.43 | 21.17 | |||
| 63eeBecause of the better resolution of the HST observations, an individual galaxy in the Keck image may be associated with more than one galaxy in the corresponding HST image. Therefore, these HST galaxies have the same Keck number. The following pairs occur in this field : MDS ID # 63, 177 = Keck # 1331; MDS ID # 67, 289 = Keck # 1989; MDS ID # 31, 141 = Keck # 2132; MDS ID # 152, 175 = Keck # 2156; MDS ID # 50, 136 = Keck # 2232; MDS ID # 29, 126 = Keck # 2307; MDS ID # 9, 165 = Keck # 2459; MDS ID # 183, 276 = Keck # 2770; MDS ID # 10, 376 = Keck # 2891; MDS ID # 161, 277 = Keck # 3367; MDS ID # 92, 36 = Keck # 3405 (see Sect. 5.1). | 1331 | 24.34 | 24.29 | 24.08 | 22.31 | |||
| 64 | 1954 | 24.04 | 23.22 | 22.97 | 21.63 | 0.2405 | 1.30 | 0.30 |
| 65 | 1653 | 23.50 | 22.87 | 22.05 | 20.91 | 0.8804 | 1.70 | 0.10 |
| 66 | 3051 | 24.35 | 23.82 | 23.09 | 21.85 | |||
| 67eeBecause of the better resolution of the HST observations, an individual galaxy in the Keck image may be associated with more than one galaxy in the corresponding HST image. Therefore, these HST galaxies have the same Keck number. The following pairs occur in this field : MDS ID # 63, 177 = Keck # 1331; MDS ID # 67, 289 = Keck # 1989; MDS ID # 31, 141 = Keck # 2132; MDS ID # 152, 175 = Keck # 2156; MDS ID # 50, 136 = Keck # 2232; MDS ID # 29, 126 = Keck # 2307; MDS ID # 9, 165 = Keck # 2459; MDS ID # 183, 276 = Keck # 2770; MDS ID # 10, 376 = Keck # 2891; MDS ID # 161, 277 = Keck # 3367; MDS ID # 92, 36 = Keck # 3405 (see Sect. 5.1). | 1989 | 24.53 | 24.06 | 23.51 | 21.67 | |||
| 68 | 3075 | 24.70 | 24.28 | 24.49 | 21.74 | |||
| 69 | 2683 | 25.57 | 24.92 | 23.78 | 21.69 | |||
| 70 | 1608 | 25.64 | 24.57 | 24.04 | 21.92 | |||
| 71 | 2272 | 27.30 | 24.48 | 23.34 | 21.67 | |||
| 72 | 2414 | 23.69 | 23.48 | 23.16 | 21.85 | |||
| 73 | 1837 | 24.53 | 24.16 | 23.37 | 22.45 | |||
| 74 | 2354 | 24.80 | 24.12 | 23.42 | 21.82 | |||
| 75 | 2888 | 24.03 | 22.97 | 21.12 | 20.00 | |||
| 76 | 3065 | 24.45 | 24.53 | 25.70 | 21.93 | |||
| 77 | 1845 | 26.08 | 26.10 | 24.14 | 21.61 | |||
| 78 | 2562 | 24.99 | 24.94 | 23.61 | 21.80 | |||
| 79 | 2598 | 25.07 | 24.48 | 24.33 | 21.73 | |||
| 80 | 2945 | 24.33 | 23.84 | 22.97 | -1.00 | 0.4430 | 0.60 | 0.40 |
| 81 | 1421 | 24.14 | 24.04 | 23.87 | 21.52 | |||
| 82 | 3175 | -1.00 | 26.24 | 24.68 | 22.01 | |||
| 83 | 1717 | 25.09 | 24.43 | 23.80 | 22.06 | |||
| 84 | 2041 | 23.97 | 23.43 | 23.20 | 21.20 | |||
| 85 | 2999 | 24.13 | 23.42 | 22.41 | 21.39 | 0.9076 | 2.00 | 0.20 |
| 86 | 2734 | 24.42 | 23.61 | 23.34 | 21.62 | |||
| 88 | 3124 | 24.59 | 24.41 | 24.20 | 21.56 | |||
| 89 | 2575 | 25.63 | 25.76 | 24.56 | 21.75 | |||
| 90 | 1689 | 25.70 | -1.00 | 24.15 | 21.52 | |||
| 91 | 1286 | 24.39 | 23.96 | 23.52 | 21.74 | |||
| 92eeBecause of the better resolution of the HST observations, an individual galaxy in the Keck image may be associated with more than one galaxy in the corresponding HST image. Therefore, these HST galaxies have the same Keck number. The following pairs occur in this field : MDS ID # 63, 177 = Keck # 1331; MDS ID # 67, 289 = Keck # 1989; MDS ID # 31, 141 = Keck # 2132; MDS ID # 152, 175 = Keck # 2156; MDS ID # 50, 136 = Keck # 2232; MDS ID # 29, 126 = Keck # 2307; MDS ID # 9, 165 = Keck # 2459; MDS ID # 183, 276 = Keck # 2770; MDS ID # 10, 376 = Keck # 2891; MDS ID # 161, 277 = Keck # 3367; MDS ID # 92, 36 = Keck # 3405 (see Sect. 5.1). | 3405 | 23.98 | 23.51 | 22.71 | 21.20 | |||
| 94 | 2315 | 25.15 | 24.11 | 23.12 | 21.63 | 0.3796 | ||
| 95 | 2839 | 23.48 | 23.70 | 22.77 | 22.21 | |||
| 96 | 2669 | -1.00 | 24.77 | 23.44 | -1.00 | |||
| 97 | 2300 | -1.00 | -1.00 | 23.33 | 21.58 | |||
| 98 | 3546 | -1.00 | 26.16 | 24.23 | 21.99 | |||
| 99 | 1792 | 26.35 | 25.33 | 24.73 | 21.86 | |||
| 100 | 1296 | 25.86 | 24.90 | 24.79 | 21.83 | |||
| 102 | 2936 | 25.18 | 23.34 | 22.73 | 20.85 | |||
| 103 | 1619 | 25.40 | 24.78 | 25.58 | 21.67 | |||
| 104 | 2332 | 22.99 | 22.66 | 23.07 | 21.68 | |||
| 105 | 1307 | 24.27 | 24.39 | 23.43 | 21.92 | |||
| 106 | 2340 | 25.94 | 24.54 | 24.50 | 21.56 | |||
| 107 | 3986 | 24.92 | 25.75 | 23.48 | 22.12 | |||
| 108 | 2348 | -1.00 | 26.97 | -1.00 | 21.78 | |||
| 109 | 1505 | 24.80 | 24.71 | 23.31 | 21.86 | |||
| 110 | 3748 | 24.97 | 24.57 | 24.40 | 22.28 | |||
| 111 | 3511 | 24.15 | 23.93 | 23.70 | 22.13 | |||
| 112 | 1931 | 24.65 | 28.65 | 23.95 | 22.04 | |||
| 113 | 1776 | 25.00 | 25.10 | 24.57 | 21.61 | |||
| 115 | 2419 | 24.72 | 24.37 | 24.53 | 22.09 | |||
| 116 | 2766 | 24.10 | 23.04 | 22.60 | 21.64 | |||
| 117 | 3012 | -1.00 | 24.84 | 24.80 | 22.12 | |||
| 118 | 2831 | 26.98 | 26.65 | 24.79 | 22.70 | |||
| 119 | 3257 | 25.08 | 24.62 | -1.00 | 21.60 | |||
| 120 | 1599 | 26.69 | 25.44 | 27.87 | 21.64 | |||
| 121 | 3171 | -1.00 | 26.19 | 24.27 | 22.09 | |||
| 122 | 2779 | 23.62 | 23.73 | 23.12 | 21.39 | |||
| 123 | 2119 | 25.27 | 24.48 | 24.31 | 22.53 | |||
| 124 | 3281 | 24.53 | 23.89 | 23.62 | 21.83 | |||
| 125 | 2417 | 25.38 | 25.30 | -1.00 | 21.94 | |||
| 126eeBecause of the better resolution of the HST observations, an individual galaxy in the Keck image may be associated with more than one galaxy in the corresponding HST image. Therefore, these HST galaxies have the same Keck number. The following pairs occur in this field : MDS ID # 63, 177 = Keck # 1331; MDS ID # 67, 289 = Keck # 1989; MDS ID # 31, 141 = Keck # 2132; MDS ID # 152, 175 = Keck # 2156; MDS ID # 50, 136 = Keck # 2232; MDS ID # 29, 126 = Keck # 2307; MDS ID # 9, 165 = Keck # 2459; MDS ID # 183, 276 = Keck # 2770; MDS ID # 10, 376 = Keck # 2891; MDS ID # 161, 277 = Keck # 3367; MDS ID # 92, 36 = Keck # 3405 (see Sect. 5.1). | 2307 | 23.03 | 22.73 | 22.48 | 21.16 | |||
| 127 | 1902 | 25.65 | 26.13 | 24.83 | 22.36 | |||
| 128 | 3660 | 24.42 | 24.52 | 23.94 | 21.93 | |||
| 129 | 1630 | 24.77 | 23.93 | 23.35 | 21.83 | |||
| 130 | 2058 | 25.04 | 25.92 | 25.02 | 21.89 | |||
| 131 | 2349 | 24.22 | 24.26 | -1.00 | 22.23 | |||
| 132 | 2244 | 22.43 | 22.84 | 21.87 | 21.55 | |||
| 133 | 1633 | 24.71 | 23.87 | 23.23 | 21.86 | |||
| 134 | 2846 | 24.04 | 24.19 | 24.03 | 22.26 | |||
| 135 | 2224 | 24.25 | 24.84 | 23.79 | 22.37 | |||
| 136eeBecause of the better resolution of the HST observations, an individual galaxy in the Keck image may be associated with more than one galaxy in the corresponding HST image. Therefore, these HST galaxies have the same Keck number. The following pairs occur in this field : MDS ID # 63, 177 = Keck # 1331; MDS ID # 67, 289 = Keck # 1989; MDS ID # 31, 141 = Keck # 2132; MDS ID # 152, 175 = Keck # 2156; MDS ID # 50, 136 = Keck # 2232; MDS ID # 29, 126 = Keck # 2307; MDS ID # 9, 165 = Keck # 2459; MDS ID # 183, 276 = Keck # 2770; MDS ID # 10, 376 = Keck # 2891; MDS ID # 161, 277 = Keck # 3367; MDS ID # 92, 36 = Keck # 3405 (see Sect. 5.1). | 2232 | 25.50 | 24.60 | 23.72 | 21.26 | |||
| 137 | 3696 | 25.26 | 24.73 | 24.71 | 22.34 | |||
| 138 | 3490 | -1.00 | 24.49 | 24.30 | 21.69 | |||
| 139 | 2680 | 25.33 | 25.75 | 23.44 | 21.73 | |||
| 140 | 2293 | -1.00 | 24.09 | 23.12 | 21.62 | |||
| 141eeBecause of the better resolution of the HST observations, an individual galaxy in the Keck image may be associated with more than one galaxy in the corresponding HST image. Therefore, these HST galaxies have the same Keck number. The following pairs occur in this field : MDS ID # 63, 177 = Keck # 1331; MDS ID # 67, 289 = Keck # 1989; MDS ID # 31, 141 = Keck # 2132; MDS ID # 152, 175 = Keck # 2156; MDS ID # 50, 136 = Keck # 2232; MDS ID # 29, 126 = Keck # 2307; MDS ID # 9, 165 = Keck # 2459; MDS ID # 183, 276 = Keck # 2770; MDS ID # 10, 376 = Keck # 2891; MDS ID # 161, 277 = Keck # 3367; MDS ID # 92, 36 = Keck # 3405 (see Sect. 5.1). | 2132 | 23.76 | 22.80 | 22.35 | 21.32 | |||
| 142 | 3179 | 24.93 | 24.86 | -1.00 | 21.86 | |||
| 144 | 2806 | 24.10 | 23.88 | 24.19 | 21.54 | |||
| 145 | 2942 | 24.60 | 25.33 | 24.50 | 21.95 | |||
| 146 | 2443 | 26.02 | 24.92 | 24.17 | 22.12 | |||
| 147 | 1574 | 25.39 | 24.97 | 24.41 | 22.22 | |||
| 148 | 2128 | 27.26 | -1.00 | -1.00 | 22.17 | |||
| 149 | 2471 | 25.55 | 25.23 | 24.79 | 21.84 | |||
| 150 | 2642 | 26.83 | -1.00 | 23.63 | 21.53 | |||
| 151 | 2896 | 24.45 | 25.21 | 25.76 | 22.37 | |||
| 152eeBecause of the better resolution of the HST observations, an individual galaxy in the Keck image may be associated with more than one galaxy in the corresponding HST image. Therefore, these HST galaxies have the same Keck number. The following pairs occur in this field : MDS ID # 63, 177 = Keck # 1331; MDS ID # 67, 289 = Keck # 1989; MDS ID # 31, 141 = Keck # 2132; MDS ID # 152, 175 = Keck # 2156; MDS ID # 50, 136 = Keck # 2232; MDS ID # 29, 126 = Keck # 2307; MDS ID # 9, 165 = Keck # 2459; MDS ID # 183, 276 = Keck # 2770; MDS ID # 10, 376 = Keck # 2891; MDS ID # 161, 277 = Keck # 3367; MDS ID # 92, 36 = Keck # 3405 (see Sect. 5.1). | 2156 | 24.34 | 24.36 | 23.47 | 22.09 | |||
| 153 | 2752 | 25.99 | 27.17 | 25.32 | 22.67 | |||
| 154 | 1970 | 25.35 | 24.31 | 24.09 | 21.40 | |||
| 155 | 1912 | 30.16 | 24.73 | -1.00 | 22.79 | |||
| 156 | 1887 | -1.00 | 26.31 | 24.52 | 22.05 | |||
| 157 | 2761 | 25.16 | 24.41 | -1.00 | -1.00 | |||
| 158 | 1973 | 25.77 | 24.99 | -1.00 | 21.96 | |||
| 159 | 3406 | 24.21 | 24.17 | 24.12 | 21.80 | |||
| 160 | 2967 | 25.34 | 24.43 | 24.17 | 22.26 | |||
| 161eeBecause of the better resolution of the HST observations, an individual galaxy in the Keck image may be associated with more than one galaxy in the corresponding HST image. Therefore, these HST galaxies have the same Keck number. The following pairs occur in this field : MDS ID # 63, 177 = Keck # 1331; MDS ID # 67, 289 = Keck # 1989; MDS ID # 31, 141 = Keck # 2132; MDS ID # 152, 175 = Keck # 2156; MDS ID # 50, 136 = Keck # 2232; MDS ID # 29, 126 = Keck # 2307; MDS ID # 9, 165 = Keck # 2459; MDS ID # 183, 276 = Keck # 2770; MDS ID # 10, 376 = Keck # 2891; MDS ID # 161, 277 = Keck # 3367; MDS ID # 92, 36 = Keck # 3405 (see Sect. 5.1). | 3367 | 26.69 | 24.49 | 24.25 | 22.01 | |||
| 162 | 2181 | 24.45 | 24.29 | 24.51 | 22.38 | |||
| 163 | 2800 | 24.18 | 23.87 | 23.93 | 21.47 | |||
| 164 | 1383 | 25.17 | -1.00 | -1.00 | 21.90 | |||
| 165eeBecause of the better resolution of the HST observations, an individual galaxy in the Keck image may be associated with more than one galaxy in the corresponding HST image. Therefore, these HST galaxies have the same Keck number. The following pairs occur in this field : MDS ID # 63, 177 = Keck # 1331; MDS ID # 67, 289 = Keck # 1989; MDS ID # 31, 141 = Keck # 2132; MDS ID # 152, 175 = Keck # 2156; MDS ID # 50, 136 = Keck # 2232; MDS ID # 29, 126 = Keck # 2307; MDS ID # 9, 165 = Keck # 2459; MDS ID # 183, 276 = Keck # 2770; MDS ID # 10, 376 = Keck # 2891; MDS ID # 161, 277 = Keck # 3367; MDS ID # 92, 36 = Keck # 3405 (see Sect. 5.1). | 2459 | 24.60 | 23.29 | 22.18 | 20.53 | |||
| 166 | 2461 | -1.00 | -1.00 | 24.93 | 22.48 | |||
| 167 | 3409 | 24.42 | 23.87 | 23.64 | 21.86 | |||
| 168 | 2040 | 26.67 | 25.64 | 25.64 | 22.00 | |||
| 170 | 3550 | 25.34 | 25.32 | 25.10 | 21.76 | |||
| 171 | 2793 | 24.22 | 23.41 | 22.66 | 22.08 | 0.3278 | 1.10 | 0.40 |
| 173 | 2915 | 24.82 | 25.05 | 24.76 | 21.49 | |||
| 174 | 2929 | 24.59 | 24.72 | 24.68 | 21.87 | |||
| 175eeBecause of the better resolution of the HST observations, an individual galaxy in the Keck image may be associated with more than one galaxy in the corresponding HST image. Therefore, these HST galaxies have the same Keck number. The following pairs occur in this field : MDS ID # 63, 177 = Keck # 1331; MDS ID # 67, 289 = Keck # 1989; MDS ID # 31, 141 = Keck # 2132; MDS ID # 152, 175 = Keck # 2156; MDS ID # 50, 136 = Keck # 2232; MDS ID # 29, 126 = Keck # 2307; MDS ID # 9, 165 = Keck # 2459; MDS ID # 183, 276 = Keck # 2770; MDS ID # 10, 376 = Keck # 2891; MDS ID # 161, 277 = Keck # 3367; MDS ID # 92, 36 = Keck # 3405 (see Sect. 5.1). | 2156 | 24.34 | 24.36 | 23.47 | 22.09 | |||
| 176 | 2782 | 24.54 | 24.95 | 24.71 | 22.40 | |||
| 177eeBecause of the better resolution of the HST observations, an individual galaxy in the Keck image may be associated with more than one galaxy in the corresponding HST image. Therefore, these HST galaxies have the same Keck number. The following pairs occur in this field : MDS ID # 63, 177 = Keck # 1331; MDS ID # 67, 289 = Keck # 1989; MDS ID # 31, 141 = Keck # 2132; MDS ID # 152, 175 = Keck # 2156; MDS ID # 50, 136 = Keck # 2232; MDS ID # 29, 126 = Keck # 2307; MDS ID # 9, 165 = Keck # 2459; MDS ID # 183, 276 = Keck # 2770; MDS ID # 10, 376 = Keck # 2891; MDS ID # 161, 277 = Keck # 3367; MDS ID # 92, 36 = Keck # 3405 (see Sect. 5.1). | 1331 | 24.34 | 24.29 | 24.08 | 22.31 | |||
| 178 | 2813 | 23.59 | 23.68 | -1.00 | 21.60 | |||
| 180 | 2362 | 27.32 | 25.07 | 24.14 | 22.40 | |||
| 181 | 2270 | 24.95 | 24.03 | 25.14 | 22.41 | |||
| 182 | 2169 | -1.00 | 25.81 | -1.00 | 22.07 | |||
| 183eeBecause of the better resolution of the HST observations, an individual galaxy in the Keck image may be associated with more than one galaxy in the corresponding HST image. Therefore, these HST galaxies have the same Keck number. The following pairs occur in this field : MDS ID # 63, 177 = Keck # 1331; MDS ID # 67, 289 = Keck # 1989; MDS ID # 31, 141 = Keck # 2132; MDS ID # 152, 175 = Keck # 2156; MDS ID # 50, 136 = Keck # 2232; MDS ID # 29, 126 = Keck # 2307; MDS ID # 9, 165 = Keck # 2459; MDS ID # 183, 276 = Keck # 2770; MDS ID # 10, 376 = Keck # 2891; MDS ID # 161, 277 = Keck # 3367; MDS ID # 92, 36 = Keck # 3405 (see Sect. 5.1). | 2770 | 26.89 | 24.54 | 23.88 | 22.08 | |||
| 184 | 3037 | 24.85 | 24.80 | 24.86 | 22.12 | |||
| 185 | 2038 | 26.08 | 26.32 | 23.92 | 21.94 | |||
| 186 | 3750 | 24.68 | 23.63 | 22.94 | 21.12 | |||
| 188 | 3587 | 25.28 | 24.66 | 24.96 | 22.41 | |||
| 189 | 2935 | 24.60 | 24.81 | -1.00 | 21.68 | |||
| 190 | 1707 | 24.97 | 24.61 | 23.85 | 22.15 | |||
| 191 | 2388 | 23.71 | 23.46 | 23.08 | 21.89 | |||
| 192 | 2368 | 25.09 | 26.61 | -1.00 | 21.75 | |||
| 194 | 2013 | 25.24 | 24.68 | 24.23 | 21.71 | |||
| 195 | 2783 | 23.89 | 23.98 | -1.00 | 21.59 | |||
| 196 | 2269 | 24.45 | 25.02 | 24.74 | 22.03 | |||
| 197 | 2152 | 27.01 | 27.16 | 25.80 | 22.49 | |||
| 198 | 2003 | 25.90 | 25.55 | 25.20 | 22.39 | |||
| 199 | 2346 | 24.85 | 24.67 | 25.13 | 22.44 | |||
| 200 | 2262 | -1.00 | -1.00 | -1.00 | 22.54 | |||
| 201 | 2618 | 24.95 | 24.71 | 23.61 | 22.12 | |||
| 203 | 2428 | 24.73 | 24.86 | -1.00 | -1.00 | |||
| 205 | 3806 | 25.14 | 24.34 | 24.29 | 22.24 | |||
| 206 | 3004 | 25.30 | 24.97 | 24.04 | 23.45 | |||
| 207 | 1650 | 25.26 | 24.55 | 24.48 | 22.31 | |||
| 210 | 3044 | 25.67 | 25.76 | 25.66 | 22.08 | |||
| 213 | 1855 | -1.00 | 27.72 | 25.62 | 21.90 | |||
| 215 | 3770 | 25.77 | 26.06 | -1.00 | 22.58 | |||
| 219 | 3320 | 25.11 | 24.26 | 24.91 | 22.01 | |||
| 220 | 3524 | 26.18 | 25.75 | 24.99 | 22.42 | |||
| 228 | 2166 | -1.00 | -1.00 | -1.00 | -1.00 | |||
| 230 | 1552 | 26.42 | 25.93 | 25.46 | 22.16 | |||
| 231 | 2316 | 25.17 | 25.42 | -1.00 | 21.74 | |||
| 237 | 3805 | 25.97 | 26.08 | 24.06 | 22.48 | |||
| 238 | 3670 | 27.21 | 25.64 | 24.02 | 22.07 | |||
| 243 | 3598 | -1.00 | 25.77 | 25.35 | 22.75 | |||
| 255 | 2444 | -1.00 | 23.17 | 22.75 | 21.81 | |||
| 268 | 2504 | 26.80 | 25.97 | -1.00 | 22.98 | |||
| 276eeBecause of the better resolution of the HST observations, an individual galaxy in the Keck image may be associated with more than one galaxy in the corresponding HST image. Therefore, these HST galaxies have the same Keck number. The following pairs occur in this field : MDS ID # 63, 177 = Keck # 1331; MDS ID # 67, 289 = Keck # 1989; MDS ID # 31, 141 = Keck # 2132; MDS ID # 152, 175 = Keck # 2156; MDS ID # 50, 136 = Keck # 2232; MDS ID # 29, 126 = Keck # 2307; MDS ID # 9, 165 = Keck # 2459; MDS ID # 183, 276 = Keck # 2770; MDS ID # 10, 376 = Keck # 2891; MDS ID # 161, 277 = Keck # 3367; MDS ID # 92, 36 = Keck # 3405 (see Sect. 5.1). | 2770 | 26.89 | 24.54 | 23.88 | 22.08 | |||
| 277eeBecause of the better resolution of the HST observations, an individual galaxy in the Keck image may be associated with more than one galaxy in the corresponding HST image. Therefore, these HST galaxies have the same Keck number. The following pairs occur in this field : MDS ID # 63, 177 = Keck # 1331; MDS ID # 67, 289 = Keck # 1989; MDS ID # 31, 141 = Keck # 2132; MDS ID # 152, 175 = Keck # 2156; MDS ID # 50, 136 = Keck # 2232; MDS ID # 29, 126 = Keck # 2307; MDS ID # 9, 165 = Keck # 2459; MDS ID # 183, 276 = Keck # 2770; MDS ID # 10, 376 = Keck # 2891; MDS ID # 161, 277 = Keck # 3367; MDS ID # 92, 36 = Keck # 3405 (see Sect. 5.1). | 3367 | 26.69 | 24.49 | 24.25 | 22.01 | |||
| 289eeBecause of the better resolution of the HST observations, an individual galaxy in the Keck image may be associated with more than one galaxy in the corresponding HST image. Therefore, these HST galaxies have the same Keck number. The following pairs occur in this field : MDS ID # 63, 177 = Keck # 1331; MDS ID # 67, 289 = Keck # 1989; MDS ID # 31, 141 = Keck # 2132; MDS ID # 152, 175 = Keck # 2156; MDS ID # 50, 136 = Keck # 2232; MDS ID # 29, 126 = Keck # 2307; MDS ID # 9, 165 = Keck # 2459; MDS ID # 183, 276 = Keck # 2770; MDS ID # 10, 376 = Keck # 2891; MDS ID # 161, 277 = Keck # 3367; MDS ID # 92, 36 = Keck # 3405 (see Sect. 5.1). | 1989 | 24.53 | 24.06 | 23.51 | 21.67 | |||
| 290 | 3098 | 25.51 | -1.00 | 26.11 | 22.60 | |||
| 376eeBecause of the better resolution of the HST observations, an individual galaxy in the Keck image may be associated with more than one galaxy in the corresponding HST image. Therefore, these HST galaxies have the same Keck number. The following pairs occur in this field : MDS ID # 63, 177 = Keck # 1331; MDS ID # 67, 289 = Keck # 1989; MDS ID # 31, 141 = Keck # 2132; MDS ID # 152, 175 = Keck # 2156; MDS ID # 50, 136 = Keck # 2232; MDS ID # 29, 126 = Keck # 2307; MDS ID # 9, 165 = Keck # 2459; MDS ID # 183, 276 = Keck # 2770; MDS ID # 10, 376 = Keck # 2891; MDS ID # 161, 277 = Keck # 3367; MDS ID # 92, 36 = Keck # 3405 (see Sect. 5.1). | 2891 | 26.29 | 23.29 | 22.37 | 20.57 | |||
| 383 | 2100 | 27.40 | 25.75 | 27.86 | 24.39 | |||
| 453 | 2556 | 26.62 | 25.64 | -1.00 | -1.00 | |||
| 636 | 1726 | 24.83 | 24.34 | -1.00 | -1.00 | |||
PLATE #1
PLATE #2
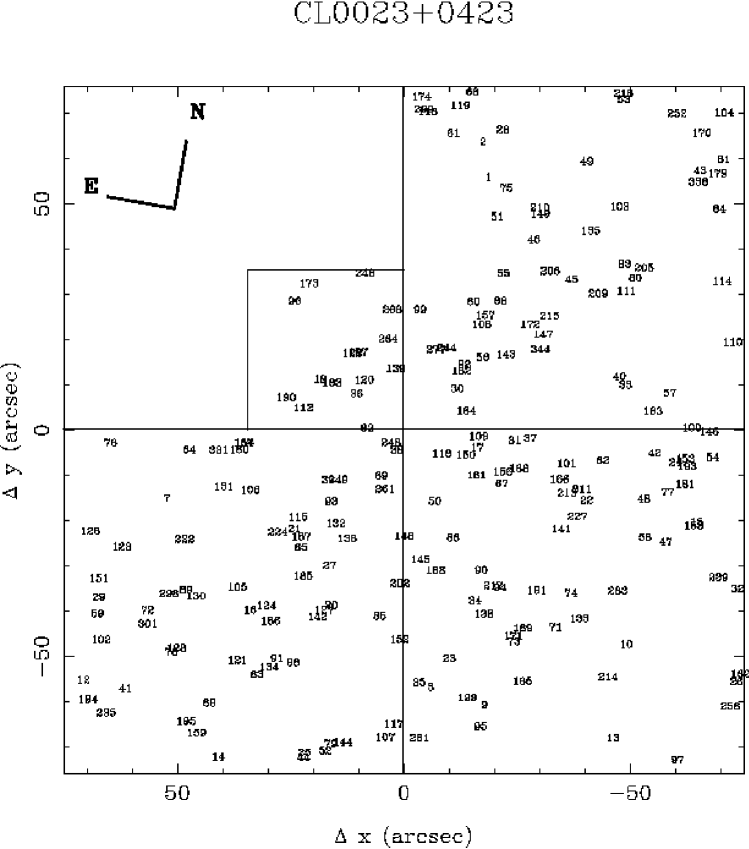
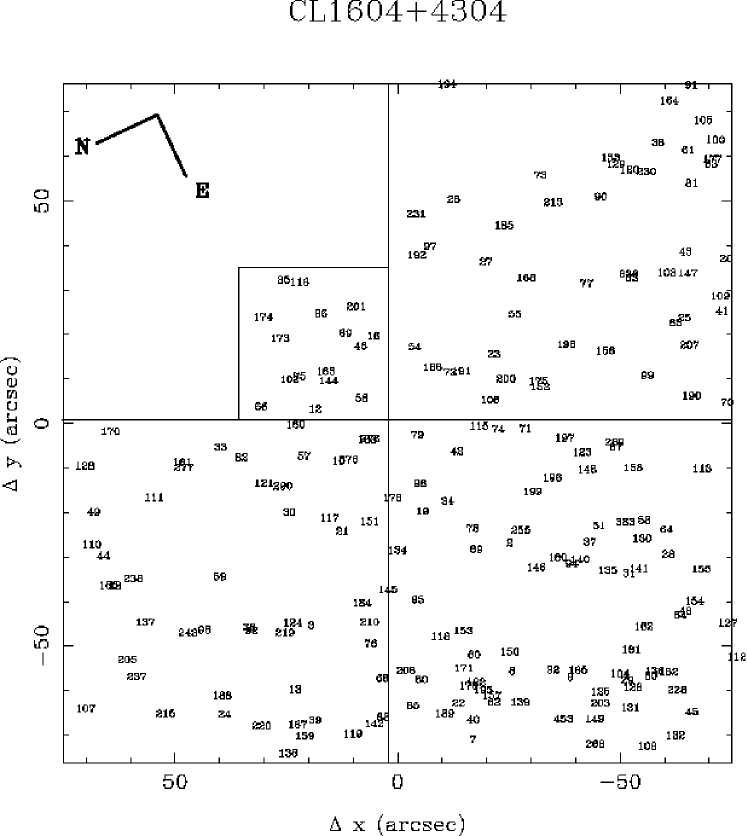
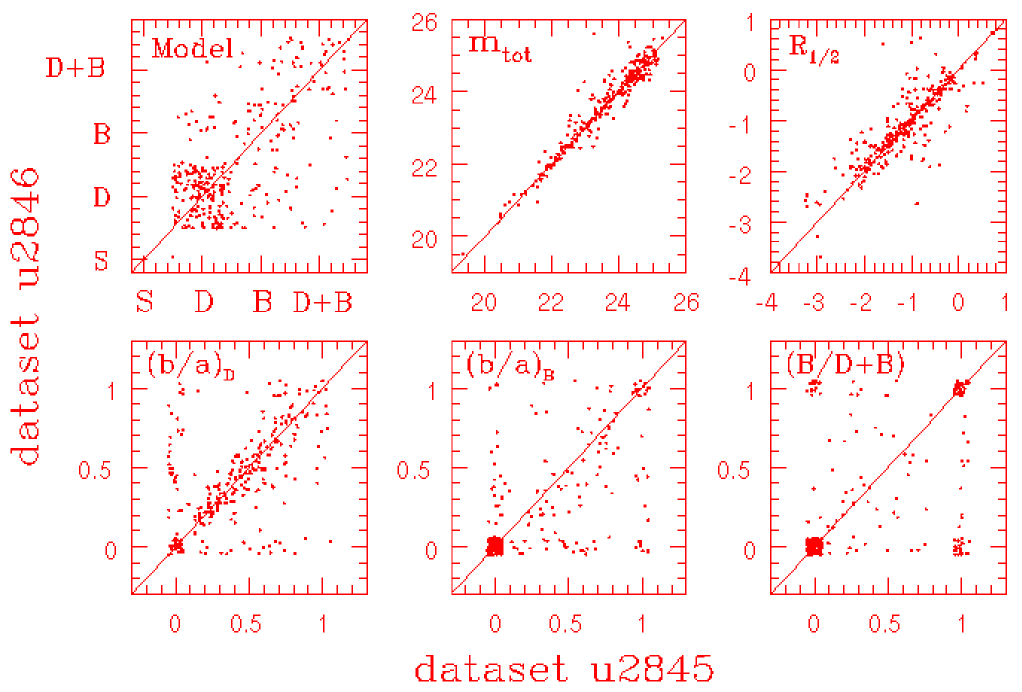


PLATE #3
PLATE #4