SCIENTIFIC REPORT ON LOW ENERGY ABSORPTION FEATURES DETECTED BY BeppoSAX LECS IN BRIGHT BLAZAR TARGETS
SCIENTIFIC REPORT ON LOW ENERGY ABSORPTION FEATURES DETECTED BY BeppoSAX LECS IN BRIGHT BLAZAR TARGETS
Ref. SISSA 146/97/A, August 1997
1 Definition of the Problem
The apparency of low energy absorption features in Blazar LECS spectra has been reported during the early phase of the BeppoSAX mission by Grandi et al. (1997) for 3C 273 Science Verification Phase (SVP) and by Giommi et al. (1997) for PKS 2155–304 SVP, with data reduction and analysis tools released prior to July 1997. Grandi et al. reported a broad absorption feature centered at keV (hereinafter energies are measured in the observer frame), while the LECS data of PKS 2155–304 show a complex pattern of absorption edges. A fit with up to three edges (at energies 0.2, 0.5, 0.7 keV) seems to be consistent with the data. In LECS Core Program (CP) data of 3C 273 we also detected an absorption edge at keV with (Haardt et al. in prep), not consistent with that observed in SVP by Grandi and co–workers.
2 Test Procedure
In order to investigate the reliability of our edge detection, we decided to perform a test aimed at the discovery of possible systematic errors in the LECS response matrix. In the analysis presented in this report we refer to LECS/MECS calibration files (effective area, response matrix) and analysis software (SAXDAS) released by BeppoSAX Science Data Center (SDC) prior to July 1997. The test was performed as follows:
-
1.
we defined for seven LECS datasets of bright blazars (Mkn 421 May 2nd and 4th 1997 pointings, PKS 2155–304 SVP, Mkn 501 April 7th and 16th 1997 pointings, 3C 273 summed over CP observations, 3C 273 SVP) the ”best continuum”, i.e. LECS data were fitted by a single or broken power law absorbed by Galactic column density (wabs bknpower model in XSPEC 9.0); prior to fitting, LECS data were rebinned according to grouping2 template as provided by BeppoSAX SDC (see at ftp://www.sdc.asi.it/pub/sax/cal/responses/grouping/). The high energy branch of bknpower was fixed at the value obtained fitting the MECS data;
-
2.
each data/model ratio obtained with the so defined “best continuum” was then divided by a ratio averaged over the remaining 6 datasets, i.e. excluding from the averaged ratio the ratio corresponding to the dataset under study. In this way, should a particular feature be present only in the dataset under study, it would be conserved going through the process of ”average over the rest”. On the other hand, features common to all the datasets would be smeared out. Note that the averaged ratios were obtained performing an arithmetic mean of the individual ratios, with quadratic propagation of errors. No weighted mean was used whatsoever. This is because we wanted to avoid the averaged ratio to be led by the best S/N sources, such as PKS 2155–304.
3 Results
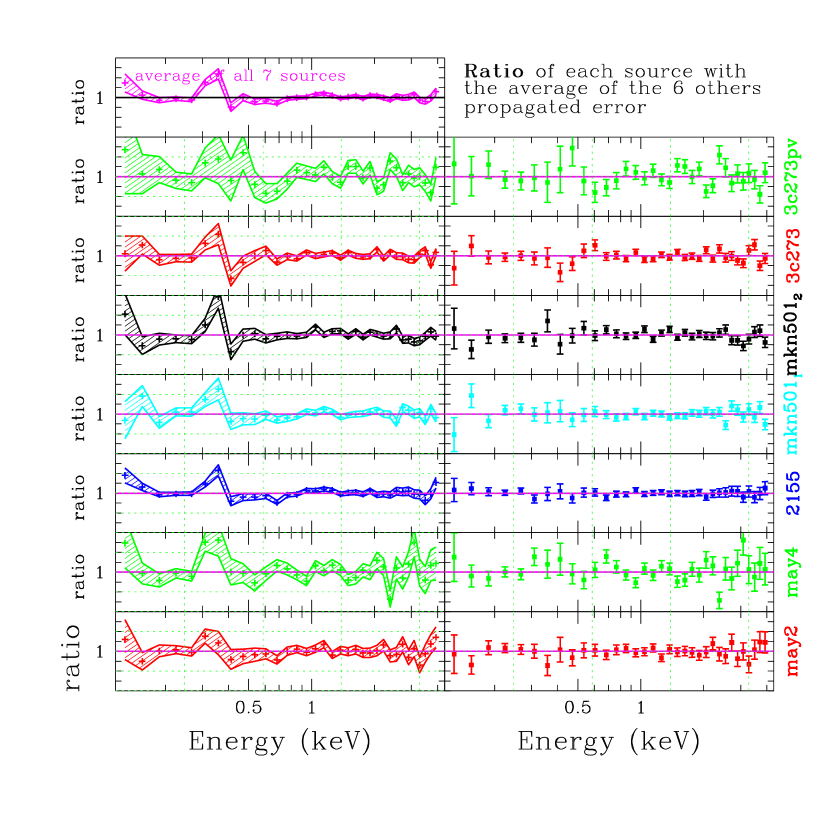
In Figure 1, left column, the data/model ratios for the 7 datasets are presented. The upper left panel is the ratio averaged over all the 7 datasets (note that this average ratio is shown for mere clarity purposes, but it was not actually used in the process, as it contains information from all the 7 datasets). In the right column the same ratios are divided by the relevant “average over the rest” ratios, as discussed above. It can be easily noticed that all the ”corrected” ratios but one are consistent with a constant=1, without any significant deviation. The only case which seems to be not affected by the average procedure is 3C 273 SVP, which shows the absorption feature as observed in the original data.
To be more quantitative we used the ”average of the rest” ratios to modify the PHA file of each dataset, using the fcreate tool in FTOOLS. In this way we were able to obtain seven ”corrected” PHA files ready to be used by XSPEC. We confirm the results of the visual inspection of the ratios discussed above: all the datasets (but 3C 273 SVP) can be fitted by (pure continuum) model wabs bknpower (i.e. absorbed broken power law) without need of extra features. The case of PKS 2155–304 is shown in Fig. 2. The upper panel shows the ratio of the wabs bknpower model to the data prior correction, the middle panel the ratio of wabs bknpower edge to the same original data, and the lower panel the ratio of a simple wabs bknpower model to the corrected data.
As said above, only 3C 273 SVP retains an evident absorption feature, essentially at the same energy and of the same extent of what was observed in the original uncorrected data (see Figure 3).
We finally checked that results are indeed identical if we propagate in the fitted data the errors of the averaged ratios, rather than simply sticking with the Poissonian errors of the original data.
4 Discussion
We set up a robust method to investigate the reliability of absorption features detections in LECS data of bright blazars. The method has been applied to 7 datasets. The analysis shows that similar features are common to all datasets (see next for 3C 273 SVP). This suggests that most of the features observed from 0.2 to 1 keV are possibly due to miscalibration of the instrument response, as of present date. The large deviations below 0.5 are probably due to the Carbon edge (at 0.29 keV), which can affect the residuals up to 1 keV. Of course a different interpretation of our results is still possible, namely that the common feature is indeed real. Should be that, interesting problems in the physical interpretation of blazar sources would be raised.
As discussed above, only 3C 273 SVP still shows a clear absorption feature after correction. The fact that the correction does not improve the when fits are performed to the same model means that the feature detected in this dataset is ”unique”, in the sense that is not shared by any of the other datasets considered. One may argue that, if the ”common” feature is indeed a miscalibration product, it should be apparent also in 3C 273 SVP. We note however that the ”unique” absorption feature is probably deep enough to overwhelm the ”common” feature.
References
- (1)
- (2) Haardt F., Fossati G., Grandi P., et al. 1997, in prep
- (3)
- (4) Giommi P., et al. 1997, A&A, submitted
- (5)
- (6) Grandi P., et al. 1997, A&A, submitted
- (7)
Note added: the following release of LECS matrix and reduction pipeline (September 1997) has solved the problem, confirming our conclusion that the features detected below 0.5 keV using the first software release were indeed of instrumental origin (Guainazzi M., Grandi P., BeppoSAX SDC technical report – TR-014, August 1997; A. Orr. et al., SDC technical report – TR-015 August 1997).