A BATSE-based search for repeaters in the sample of gamma-ray bursts detected by the WATCH experiment.
Abstract
This study is the first known attempt to search for gamma-ray burst repeaters combining data from gamma-ray experiments flying on board different satellites and making use of information derived from the bursts detected simultaneously by all the experiments. The proposed method is suitable to correlate GRB data provided by experiments that overlap partially or totally in time.
As an application of this method we have correlated the positions of 57 gamma-ray bursts observed by WATCH/GRANAT and WATCH/EURECA with 1905 bursts detected by BATSE. Comparing the so-called “added correlation” between the WATCH and BATSE bursts with that obtained with simulated WATCH catalogues, we conclude that there is no indication of recurrent activity of WATCH bursts in the BATSE sample. We derive an upper limit of , with a confidence level of , for the number of WATCH gamma-ray bursts that could represent a population of repeaters in the BATSE sample.
Key Words.:
Gamma rays: bursts - Methods: statistical- Methods: numerical1 Introduction
Despite the advances carried out so far, the origin of the gamma-ray bursts (hereafter GRBs) remains unknown. The identification of absorption lines in the optical spectrum of GRB 970508 strongly supports models arising from sources at cosmological distances (Metzger et al. 1997), but there is still a lack of knowledge on the mechanisms originating these enigmatic phenomena. One of the most important clues that could clarify the nature of the GRBs would be the detection of a repeater behaviour.
Initial studies showed an apparent evidence of repetition for the BATSE 1B catalogue (Quashnock and Lamb 1993), suggesting that it would be possible to have an excess of pairs of GRBs clustered in both time and space (Wang and Lingenfelter 1995). This fact was not confirmed by the work carried out using the BATSE 2B catalogue (Brainerd et al. 1995), although other studies provided marginal evidence for both temporal and angular clustering (Petrosian and Efron 1995). Analyses based on autocorrelations with data from the BATSE 3B catalogue did not find any evidence of repetition (Bennett and Rhie 1996) and have imposed several constraints to the number of repeaters (Tegmark et al. 1996). Finally, recent studies confirm the lack of repetition in the 4B catalogue and lead to an upper limit to the repetition rate of burst source-1 yr-1 (Hakkila et al. 1997).
The BATSE 4B catalogue was obtained by the BATSE experiment on board the CGRO satellite and contains 1637 GRBs detected from April 1991 to August 1996 (Paciesas et al. 1998). The BATSE experiment consists of eight identical detector modules, placed at the corners of the CGRO spacecraft and covering energy channels from keV to 2 MeV. It provides error boxes with a minimum radius of (1 confidence level, Fishman et al. 1994). BATSE is detecting bursts at a rate of 0.8 bursts per day. The bursts are daily added to the so-called Current GRB Catalogue, which contains the BATSE 4B catalogue plus all bursts detected after August 1996. When this study was started, the catalogue contained 1905 sources; this sample constitutes the basis of the present work.
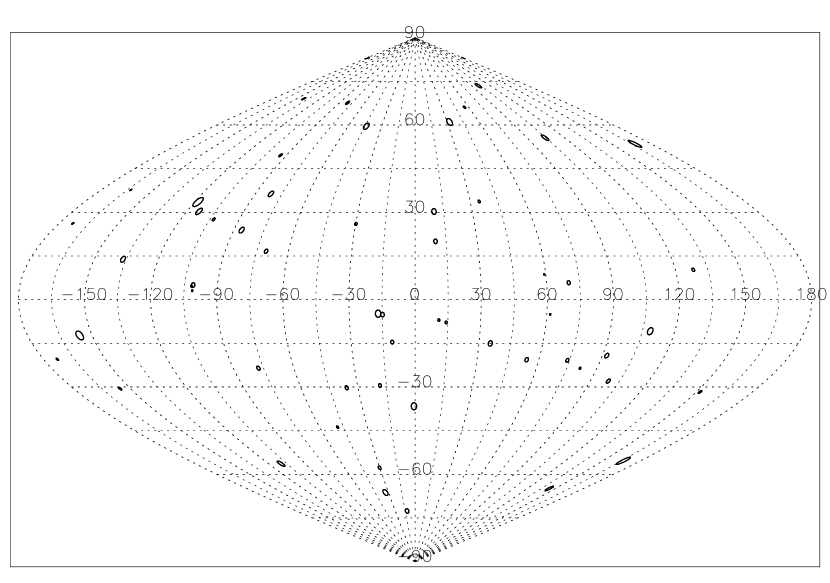
The WATCH X-ray all-sky monitor is based on the rotation modulation principle (Lund 1986). The instrument has a circular field of view of 4 steradians and an effective area of 30 cm2 (averaged over the field of view). Position sensitivity is achieved using the rotation collimator principle, with the collimator grids rotating with a frequency =1 Hz. The phoswich detectors consist of interleaved scintillator-strips of NaI and CsI crystals. The geometric area of the scintillator is 95 cm2. Four units were mounted on board the Soviet GRANAT satellite in a tetrahedral configuration covering the whole sky, and one unit on board the European Space Agency EURECA spacecraft. The total energy range is 8-80 keV, therefore overlapping with the lower BATSE energy band. WATCH/GRANAT detected bursts in 1990-94 and WATCH/EURECA in 1992-93, thus both experiments also overlapped in time with BATSE. One of the main advantages of WATCH was the capability of locating bursts with relatively small error boxes ( error radii with 1∘) (Brandt et al. 1990). WATCH/GRANAT detected 47 GRBs in this period and WATCH/EURECA 12 (Castro-Tirado et al. 1994, Brandt et al. 1994, Sazonov et al. 1998). Two GRBs (GRB 920814 and GRB 921022) were detected by both the WATCH/GRANAT and WATCH/EURECA experiments. Therefore, the sample of WATCH GRBs used in this study comprises 57 GRBs: 45 WATCH/GRANAT bursts, 10 WATCH/EURECA bursts and the above-mentioned two GRBs. BATSE also detected 27 of them. Fig. 1 shows the sample of 57 WATCH GRBs used in this study.
The distribution of time amplitudes for GRBs shows two classes of bursts: a) durations shorter than 2 s and b) longer than 2 s (Kouveliotou et al. 1993). It was noticed that the energy spectra of the short bursts were generally harder than those of the long ones (Kouveliotou et al. 1993, Lestrade et al. 1993).
The fraction of short events in the WATCH sample is smaller than that in the 4B catalogue. This fact can be justified by at least three selection effects:
i) The availability of WATCH for localizing sources is governed by the rotation speed of the collimator grids (1 Hz). So, a source needs to be bright enough for at least one rotation of the modulation collimator in order to be localized, implying a burst duration longer than 1 s. In contrast, the BATSE experiment is able to detect bursts with durations as short as 64 ms.
ii) The low energy band of the WATCH experiment (8-20 KeV) is sensitive to the soft GRBs, below the BATSE lower limit (25 KeV), which generally belong to the class of bursts with durations longer than 2 s.
iii) On the other hand, since WATCH is about an order of magnitude less sensitive than the large-area detectors of BATSE, the WATCH catalogue contains bursts which are brighter than those in the BATSE sample.
The above three reasons explain why the GRBs in the WATCH sample are longer, softer and brighter than the average BATSE 4B bursts.
This study is the first known attempt to search for repeaters combining data of -ray experiments flying on board different satellites. The method proposed makes use of the so-called “simultaneous bursts” and is suitable to correlate GRB data provided by experiments that overlap partially or totally in time. In the future, this work could also be used to detect systematic pointing errors between different -ray experiments, allowing to improve their capability for locating GRBs.
2 Method
In this section we outline the methodology proposed to carry out the study. First, we exclude the simultaneous bursts ( 2.1) and calculate the so-called “added correlation” function between the WATCH and BATSE samples ( 2.2). Afterwards, 1500 WATCH catalogues are simulated ( 2.3) in order to calculate the expected value of the “added correlation” function. Then the distribution of the overlapping function for real and random overlaps is obtained ( 2.4) and finally the probability of having different number of repeaters ( 2.5) is found.
We consider that there is a common source in both samples when the emission of a repeater is detected at least twice, once by each experiment and the detections are separated in time. Thus, the same GRB detected simultaneously by both experiments is not considered as a common source. Our study is aimed at searching common sources detected by both WATCH and BATSE experiments.
2.1 Simultaneous bursts
The positions of 27 simultaneous bursts detected by WATCH and BATSE are in good agreement. If BATSE error boxes are considered, there are 20 overlaps with WATCH boxes. Instead, if error boxes are taken into account there is only one burst (GRB 920714) that does not overlap. These 27 bursts were excluded from the BATSE sample of 1905 sources, because they are obviously the same sources detected by WATCH. Therefore the sample was reduced to 1878 bursts. Nevertheless, the simultaneous bursts were considered in further calculations ( 2.4), because they provide information on the overlapping expected for a repeater detected by both BATSE and WATCH.
2.2 The “added correlation” estimate
Recurrence, even in a single case, would be immediately obvious if we had locations with no errors. However, the locations provided by BATSE and WATCH, while numerous, have inaccuracies and consequently a statistical analysis is required to demonstrate, or limit, the presence of common sources. If any repeater is present in both catalogues, an excess in the overlap between the error boxes of both catalogues would be expected. We define the overlapping function between the -th WATCH and the -th BATSE error boxes as the following integral over the galactic coordinates and :
where is a normalization factor computed in such a way that remains between 0 and 1. is the BATSE exposure correction for the BATSE -th burst. and are the galactic coordinates of the centre of the -th WATCH and the -th BATSE error boxes, is the distance between the -th WATCH and the -th BATSE burst, and are the radii of the -th WATCH and the -th BATSE error boxes. is a Gaussian-like normalized probability distribution given by the following expression:
with , and the distance between the integration point and the centre of the -th BATSE burst;
is analogous to based on WATCH coordinates. Although we are aware that the errors of BATSE locations do not follow a single Gaussian distribution (see Briggs et al. 1998), we consider that, for our purposes, we can extend the Gaussian approximation from 1 to 3. This is a very appropriate and useful approximation which has been frequently used in the past (Fisher et al. 1987, Bennett and Rhie 1996), providing stringent upper limits on the 3B catalogue (Tegmark et al. 1996).
On the other hand, the error introduced in by considering only overlaps between 3 error boxes, instead of assuming unlimited error boxes, is less than 0.1%, irrelevant for our final conclusions. In the approximation that and (which is quite accurate, since typical values are and a few degrees), approximately depends on like , so it decreases rapidly when both probability distributions are not close to each other. provides a measurement of whether both GRBs originated from the same source or not. Based on the former arguments, we define the “added correlation” as follows:
is a parameter which is very sensitive to the presence of common sources in both catalogues. The larger the number of common sources, the higher the value of obtained. Our study is based on the comparison of the “added correlation” calculated for the real WATCH catalogue (renamed as ) with those obtained for 1500 WATCH simulated catalogues (renamed as ). is the generalization for two probability distributions (WATCH and BATSE) of the statistics introduced by Tegmark et al. (1996). is corrected by the BATSE and WATCH exposure maps, the first one is taken into account in the term included in the definition of , whereas the second one is considered to simulate the WATCH catalogues for which are calculated.
2.3 Simulation of WATCH catalogues
Monte Carlo simulations of 1500 WATCH-like catalogues have been performed. They provided 1500 values for called . In order to determine reliable values for them, the exposure maps of the WATCH/GRANAT and WATCH/EURECA instruments were taken into account. The failure of unit number 2 on board GRANAT, and the limited field of view and the Earth blockage of WATCH/EURECA, made it that none of the experiments covered uniformly the sky. The WATCH/GRANAT map shows larger exposures towards the Galactic centre whereas the WATCH/EURECA one is under exposured towards the equatorial poles (Brandt 1994, Castro-Tirado 1994). If we assume that GRBs occur randomly both in space and time, the probability of detecting a GRB in a given direction is proportional to the exposure time spent on that region. Therefore for each simulated set of 57 bursts, 45 of them follow the WATCH/GRANAT exposure map, 10 the WATCH/EURECA exposure map and the remaining two bursts (representing GRB 920814 and GRB 921022) follow both exposure maps simultaneously. The simulated WATCH-like sets have the same error radii than the real WATCH catalogue.
2.4 Random and real overlaps
We call random overlaps to overlaps between the BATSE bursts and the simulated WATCH events. The random overlaps provide a set of that follows a distribution so-called . In order to estimate such distribution, the value of the overlapping functions are calculated for all the overlaps between the BATSE sample and 50 simulated WATCH catalogues. It shows a mean value and a deviation . provides the expected value of the overlapping function when there is a casual overlap between two boxes (not due to arise from the same source). The majority of the random overlaps shows very low values of the overlapping function because they tend to occur at the border of the error boxes in the tail of the probability distribution.
On the other hand, the overlapping function, , for each of the 27 BATSE-WATCH simultaneous pairs is calculated. The distribution of these 27 values of is called . The mean value of the real overlaps, , and the deviation . As expected is greater than . This fact can be explained taken into account that the probability distributions due to a single GRB detected by both experiments tend to be close to each other, compared with two GRBs randomly located in the same zone in the sky. Thus, the random overlaps tend to occur in the tail of the probability distribution, thus forcing to be very low. Moreover, the lower sensitivity of WATCH in comparison to BATSE implies that the 27 simultaneous bursts are brighter than the average BATSE bursts, (as the radii of the error boxes depend on the intensity) and therefore they have smaller error boxes, thus making larger than .
The next step is to consider as the expected distribution of for repeaters. This consideration is based on the two following assumptions:
-
1.
There is little variation with time on the sensitivity of both experiments. A change in the sensitivity imply into differences in the sizes of error boxes and thus in the values. If more accuracy is desirable, then it is necessary to know how the sensitivity of both instruments evolves, in order to correct the sizes of the error boxes depending on the date of detection.
-
2.
The intensities of different bursts from a repeater source do not change significantly in time. Therefore the sizes of the repeater error boxes remain approximately the same. A more complicated study would deal with the time evolution of the repeater sources.
2.5 Quantification of the number of repeaters
The set of 1500 ’s calculated using mock WATCH catalogues follows a Gaussian probability distribution (hereafter called , see Fig. 2). The simulated WATCH catalogues were generated only using the exposure maps and they only contain accidental overlaps, because the simultaneous GRBs were excluded from the sample. Therefore gives us the expected value of the “added correlation” when WATCH and BATSE catalogues do not share any source. Assuming that represents the expected value of the overlapping function for repeater sources, we can introduce trial repeaters and construct the ’s probability distributions for different number of repeaters, , by the following symbolic expression :
being the number of repeaters. If we take any “added correlation” of repeaters with a probability given by , and then we add the contribution to of any repeater with overlapping function given by and subtract the contribution of any random overlap given by , we get a new “added correlation” . This process can be repeated by introducing other real and random overlaps, providing a new set of ’s. Once a trial repeater has been introduced, this set of ’s will follow a different probability distribution from , called . Thus, provides the expected values of when BATSE and WATCH share one source. Similarly, this method can be applied for repeaters, in order to obtain the distributions of the “added correlations” for different number of repeaters, . Fig. 3 shows the probability distributions obtained using this procedure.
The intersection between and the distributions provides values called . Based on the values of we can obtain the distribution of for . Taking into account that the maximum number of allowed coincidences is , the distribution of ’s can be normalized by imposing . Then, provides the probability that the BATSE and WATCH catalogues share sources (see Fig. 4).


3 Results and discussion
As it can be seen in Fig. 2, the mean value of the “added correlation” for the simulated catalogues, , is even larger than the “added correlation” for the real WATCH and BATSE catalogues, namely . This implies that our results agree qualitatively with the absence of common sources.
The fact that we have preferred to simulate WATCH catalogues instead of BATSE ones is only due to the computing time, because it is more efficient to simulate sets of 57 bursts in comparison with groups of 1906 members. In spite of this fact, the roles of both catalogues were exchanged in order validate the method, applying the process explained in section 2 to 50 BATSE simulated catalogues. Only with 50 catalogues the values obtained for and differ by less than 5% from those obtained when WATCH catalogues were simulated.

| (%) | (%) | ||
|---|---|---|---|
| 0 | 24.8 | 5 | 6.0 |
| 1 | 18.7 | 6 | 4.5 |
| 2 | 14.0 | 7 | 3.4 |
| 3 | 10.5 | 8 | 2.5 |
| 4 | 7.9 | 9 | 1.9 |
The probability distributions are shown in Fig. 3 and the deduced values of are given in Table 1 and displayed in Fig. 4. As it is shown in Table 1, decreases with , showing the maximum value when BATSE and WATCH do not share any source. Thus, our results support the lack of common sources. Furthermore, the number of common sources is with a confidence level (see Table 1), which means a of the whole sample. This percentage is similar to the upper limit imposed to the 1B catalogue (Strohmayer et al. 1994). The results are also in good agreement with the studies carried out with the BATSE 3B (Tegmark et al. 1996) and 4B catalogues (Hakkila et al. 1998), which did not find evidence of repetition. A possible reason to explain our results could be due to the different sensitivity of the experiments, as WATCH is sampling the strongest bursts and BATSE is also detecting a fainter population. The different populations of objects found inside WATCH and BATSE error boxes could support this idea (Gorosabel and Castro-Tirado 1998a, 1998b).
4 Conclusion
In this study we have developed a method that allows us to search for GRBs common to two catalogues of sources, each one based on a different instrument. The method makes use of the GRBs detected simultaneously by both experiments, so it is necessary that the experiments overlap in time. We have applied the method to the WATCH (WATCH/GRANAT + WATCH/EURECA) and BATSE (BATSE 4B + bursts detected after August 1996) catalogues.
We conclude that there is no evidence of recurrent activity of WATCH bursts in the BATSE sample. We claim (with a confidence level) that no more than a of the 57 GRBs detected by WATCH are present in the sample of 1905 BATSE bursts (excluding the simultaneous bursts). However, the possibility of finding repeaters in each single catalogue cannot be ruled out. Our results support models which do not predict repetitions of GRBs (for instance the merging of neutron stars at cosmological distances).
5 Acknowledgments
J. Gorosabel wishes to thank B. Montesinos for revising the paper and for fruitful comments. This work has been partially supported by Spanish CICYT grant ESP95-0389-C02-02.
References
- (1) Bennett, D.P., and Rhie, S.H. 1996, ApJ 458, 293.
- (2) Brainerd, J.J., Meegan, C.A., Briggs, M.S., Pendelton, G.N., Brock, M.N. 1995, ApJL 441, L39.
- (3) Brandt, S., Lund, N., and Rao, A.R. 1990, Advances in Space Research 10(2), 239.
- (4) Brandt, S., Lund, N., and Castro-Tirado, A.J. 1994. Gamma-ray bursts observed with WATCH-EURECA. In: Fishman G.J., Brainerd J.J. and Hurley K. (eds.). AIP Conf. Proc. 307. Gamma-ray bursts 2nd Huntsville workshop. American Institute of Physics, New York, p. 13.
- (5) Brandt, S. 1994, Ph. D. Thesis, University of Copenhagen.
- (6) Briggs, M.S., Pendleton, G.N., Brainerd, J.J., Connaughton, V., Kippen, R.M., Meegan, C.A., Hurley, K. 1998. BATSE GRB locations errors. In: Meegan C., Preece R., and Koshut T. (eds.). 4th Huntsville GRB Symposium, in press. astro-ph 9712079.
- (7) Castro-Tirado, A.J., Brandt, S., Lund, N.,Lapshov, I.Y., Terekhov, O., Sunyaev, R.A., 1994. WATCH observations of gamma-ray bursts during 1990-1992. In: Fishman G.J., Brainerd J. J., and Hurley K. (eds.). AIP Conf. Proc. 307. Gamma-ray bursts 2nd Huntsville workshop. American Institute of Physics, New York, p. 17.
- (8) Castro-Tirado, A.J. 1994, Ph. D. Thesis, University of Copenhagen.
- (9) Fisher, N.I., Lewis, T., and Embleton, B.J.J. 1987, Statistical Analysis of Spherical data, Cambridge Univ. press.
- (10) Fishman, G.J, Meegan, C.A., Wilson, R.B., Brock, M.N., Horack, J.M., et al. 1994, ApJS 92, 229.
- (11) Gorosabel, J., and Castro-Tirado, A.J., 1998a. Are Gamma-ray Bursts related to Active Galactic Nuclei?. In: Dermer C.D., Strickman M.S, and Kurfess J.D. (eds.). AIP Conf. Proc. 410. 4th Compton Symposium. American Institute of Physics, New York, p. 1333.
- (12) Gorosabel, J., and Castro-Tirado, A.J. 1998b. Study of the possible connection between Gamma-ray Bursts and Active Galactic Nuclei. In: Meegan C., Preece R. and Koshut T. (eds.). 4th Huntsville GRB Symposium, in press.
- (13) Hakkila, J., Meegan, C.A., Pendelton, G.N., Briggs, M.S., Horack, J.M., Hartmann, D.H., Connaughton, V. 1998. GRB repetition limits from current BATSE observations. In: Meegan C., Preece R., and Koshut T. (eds.). 4th Huntsville GRB Symposium, in press. astro-ph/9712092.
- (14) Kouveliotou, C., Meegan, C.A., Fishman, G.J., Bhat, N.P., Briggs, M.S., et al. 1993, ApJL 413, L101.
- (15) Lestrade, J.P., Dezalay, J.-P., Atteia, J.-L., Barat, C., Talon, R., et al. 1993, A&AS 97, 79.
- (16) Lund, N. 1986. The WATCH gamma-burst detector for EURECA-I. In: Culhane J.L. (eds.). SPIE Conf. Proc. 597. X-ray Instrumentation in Astronomy. Int. Soc. Eng., p. 95.
- (17) Metzger, M. Djorgovski, S.G., Kulkarni, S.R., Steidel, C.C., Adelberger, K.L., et al. 1997, Nature 387, 878.
- (18) Paciesas, W.S., Meegan, C.A., Pendelton, G.N., Briggs, M.S., Kouveliotou, C., et al. 1998, ApJS, in press.
- (19) Petrosian, V., and Efron, B. 1995, ApJL 441, L37.
- (20) Quashnock, J.M., and Lamb, D.Q. 1993, MNRAS 265, L59.
- (21) Sazonov, S.Y., Sunyaev, R.A., Terekhov, O.V., Lund, N., Brandt, S., and Castro-Tirado, A.J. 1998, A&AS, in press.
- (22) Strohmayer, T.E., Fenimore, E.E., Miralles J.A. 1994, ApJ 432, 665.
- (23) Tegmark, M., Hartmann, D.H., Briggs, M.S., Hakkila, J. and Meegan, C.A. 1996, ApJ 466, 757.
- (24) Wang, V.C., and Lingenfelter, R.E. 1995, ApJ 441, 747.