email: rr@space.mit.edu 33institutetext: Observatoire de Strasbourg, 11 rue de l’Université, F-67000 Strasbourg, France
email: motch@astro.u-strasbg.fr
The X-ray stream-eclipsing polar RX J1802.1+1804
Abstract
We present X-ray and optical data of the newly discovered AM Her variable RX J1802.1+1804. This X-ray source was observed in the ROSAT All-Sky-Survey in September 1990 and subsequently discovered as a highly variable and soft X-ray source. Follow-up pointed observations confirmed the strong variability and revealed a periodic flux modulation including a sharp and nearly complete eclipse of the X-ray emission. Based on the shape and duration of this eclipse as well as the lack of optical eclipses we favour an interpretation in terms of a self-eclipse by the accretion stream. The X-ray spectrum averaged over the full period is dominated by soft emission below 0.5 keV. The ratio of soft (blackbody) to hard (bremsstrahlung) bolometric energy flux is 1670, distinguishing this object as another example of a polar with an extreme strong excess in soft X-rays.
Key Words.:
cataclysmic variables – AM Her systems – accretion disks – Stars: individual: RX J1802.1+1804 = V884 Her1 Introduction
AM Her type variables are accreting binaries in which the strong magnetic field of the white dwarf controls the geometry of the material flow coming from the late-type companion star. The radial inflow of matter produces a shock front above the white dwarf surface which gives rise to hard X-rays and polarized cyclotron radiation in the IR to UV range. In the simplest physical model (Lamb 1985) half of this shock radiation intercepts the white dwarf surface and is reradiated as thermal emission from the heated accretion spot in the UV and soft X-ray band.
X-ray observations, most notably with the ROSAT satellite, had and have a great impact on the study of magnetic cataclysmic variables. The rather high intensity, strongly variable and soft X-ray emission allows to set up selection criteria (e.g. using the ROSAT data base) with a high detection/identification rate which reflects in the fact that about 80% of all magnetic cataclysmic variables have been discovered at X-ray wavelengths (Beuermann 1998).
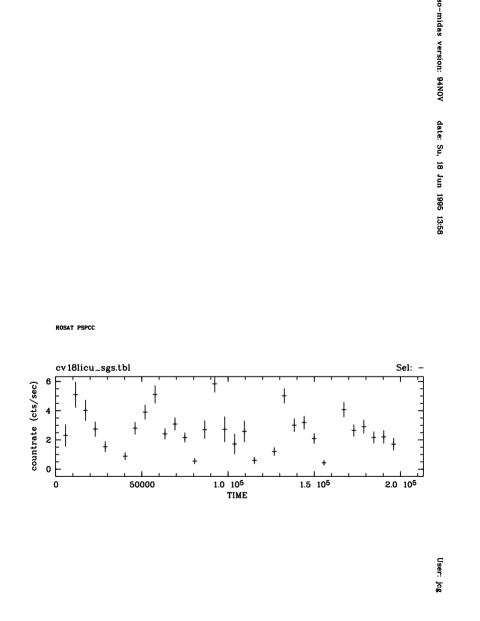
During the search for supersoft X-ray sources in the ROSAT (Trümper 1983) All-Sky-Survey (RASS), we have found a bright X-ray source showing strong scan-to-scan variability in the X-ray count rate as measured in the PSPC. Subsequent spectroscopic observations revealed a 15th magnitude cataclysmic variable located near the X-ray position. Additional pointed ROSAT PSPC observations strengthened the evidence of a strongly modulated X-ray light curve as well as of a very soft X-ray spectrum. These combined characteristics, and particularly the supersoft X-ray spectrum, are typical signatures of the AM Her subclass (Beuermann & Schwope 1994). Here, we report on the results of our extensive ROSAT and optical observations performed to study the accretion geometry in RX J1802.1+1804 in more detail. The identification as an AM Her system (polar) and some first details have been reported in June 1994 at the Abano-Padova conference on Cataclysmic Variables (Greiner et al. 1995a) after which the object got the variable star name V884 Her. The results of quick follow-up observations of RX J1802.1+1804 (= WGA J1802.1+1804) have also been communicated in Singh et al. 1995 (note the flux error; see Greiner et al. 1995b) and Szkody et al. (1995). Recently, Shrader et al. (1997) reported the results of IUE observations. Due to its soft X-ray spectrum RX J1802.1+1804 has also been detected with the EUVE satellite (Lampton et al. 1997; = EUVE J1802+18.0).
2 Observational data
2.1 X-ray observations
RX J1802.1+1804 ( = 1RXS J180206.7+180438) was observed over a 2.5 day period in September 1990 for a total of 716 sec during the ROSAT All-Sky-Survey. These observations consist of 31 scans with 9–29 sec exposure each, spaced in time by 96 min. (the ROSAT orbital period).
A 2 ksec pointed ROSAT observation was performed on 1992 October 11 in order to verify the strong variability and the dominant soft X-ray excess. The results obtained from this observation motivated us to propose a longer, 15 ksec pointed ROSAT PSPC observation which then was performed in September 1993. In order to minimize the varying obscuration effects of the PSPC window support structure due to the wobbling, RX J1802.1+1804 was by purpose observed at 39′ off-axis angle during the latter observation. At this position in the detector, the FWHM of the point spread function is 4′ wide and thus the source photons are spread over an area much larger than the 3′ spacing of the support structure wires. Due to a commanding error this off-set option was not implemented during the first 10% of the 1993 exposure. Details of all the ROSAT observations are given in Tab. 1.
| X-ray observations | |||
|---|---|---|---|
| Date | exposure | off-axis | cycles |
| Sep. 1990 | 716 sec | 0–55′ | –13966…–13949 |
| Oct. 11, 1992 | 2005 sec | 0′ | –4269 |
| Mar. 22, 1993 | 290 sec | 0′ | –2060 |
| Sep. 7, 1993 | 1 239 sec | 0′ | –50 |
| Sep. 11/12, 1993 | 13 477 sec | 39′ | –2…12 |
| Optical observations | |||
| Date | Data type | Observatory | |
| Feb. 1, 1992 | photometry | OHP | |
| Feb. 3, 1992 | spectroscopy | OHP | |
| Jun. 3, 1992 | photometry | MDM | |
| Oct. 12, 1992 | photometry | MDM | |
| Oct. 10–12, 1992 | spectroscopy | MDM | |
| May 1/2/6, 1993 | spectroscopy | MDM | |
2.1.1 Position
Although the optical identification of RX J1802.1+1804 had been achieved with the position derived from the RASS, we improved the X-ray coordinates by using the two pointed PSPC observations of Oct 11, 1992 and Sep. 7, 1993. Ignoring all X-ray photons below channel 25 to avoid ghost images we derive a best fit X-ray position of R.A. (2000.0) = 18h02m062, Decl. (2000.0) = 18∘04′42′′ (15′′).
2.1.2 Temporal variability
Source photons have been extracted with a radius of 10 times the FWHM of the ROSAT PSPC point spread function, excluding three faint nearby sources (5′–8′ away) in the off-axis pointing. The data from the different pointings have been barycenter corrected and combined for the subsequent analysis. The X-ray photons have been binned into 10 sec time slices, and during this binning process have been background subtracted and corrected for vignetting using standard EXSAS routines (Zimmermann et al. 1994).
| cycle | ||
| (HJD 2400000+) | (10-4 days) | |
| 48146.26370 0.00405 | –19.2 | –13966 |
| 48146.73103 0.00405 | –33.4 | –13960 |
| 48147.13115 0.00405 | 22.5 | –13955 |
| 48147.59849 0.00405 | 8.4 | –13949 |
| 48907.28157 0.00023 | 3.3 | –4269 |
| 49242.31274 0.00116 | 2.5 | 0 |
| 49242.39064 0.00035 | 0.2 | 1 |
| 49243.17597 0.00035 | 2.0 | 11 |
| 49243.25458 0.00035 | 6.8 | 12 |
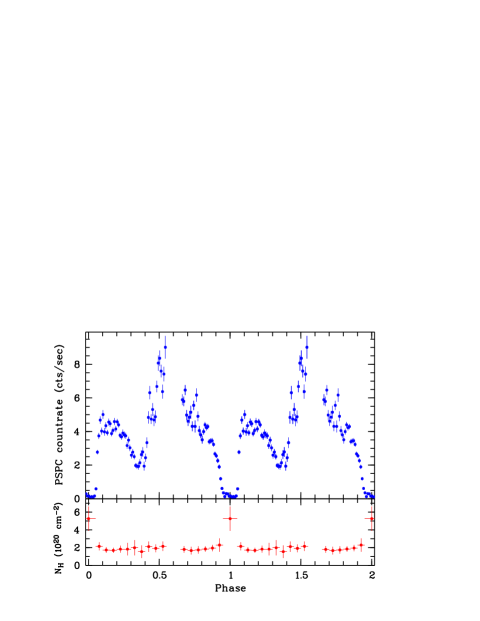
Strong variability of the X-ray flux was already detected during the All-Sky-Survey (see Fig. 1) and confirmed in the pointed observations. The X-ray variations are periodic, and the light curve is characterized by a double-wave per orbital cycle. In the first minimum, which we consider as a periodic X-ray eclipse, the source flux decreases to nearly zero. This is followed by a second minimum occurring 40 min. later with a factor of 2 decrease in intensity.
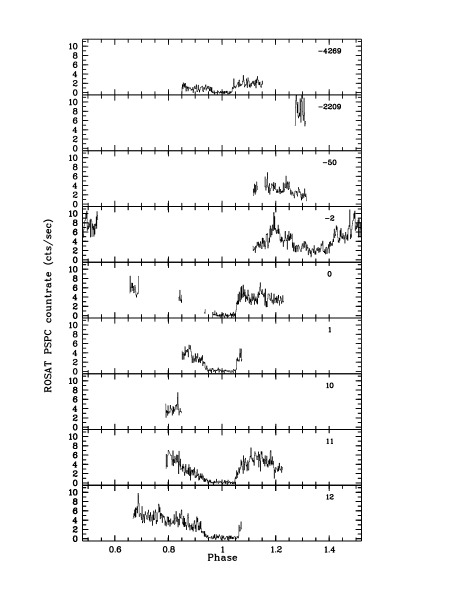
In total we have covered 4 X-ray eclipses during the all-sky survey and 5 eclipses during the pointed observations. The fortunate circumstance of covering 4 eclipses spread over 17 cycles during the survey and 4 eclipse egresses spread over 12 orbit cycles during the Sep. 11/12, 1993 observation allows us to phase all data together without any phase ambiguity. The times of the mid-eclipses are listed in Tab. 2 together with the O–C values of a linear regression analysis which yielded the following eclipse (mid-eclipse times) ephemeris:
The numbers in parenthesis give the uncertainties in the last digits and corresponds to mid-eclipse of the first eclipse in the Sep. 11/12, 1993 observation (panel 5 in Fig. 3). The remaining error is mainly due to the varying eclipse length (see below) and the not complete coverage of the eclipses (30 sec. scans) during the all-sky survey.
The FWHM of the eclipse is 17.0 min (or a phase interval of 0.15), and the width of the second intensity drop is 14.7 min (0.13 in phase). In addition, there are a number of pronounced intensity variations which typically last a few minutes and reach amplitudes of 10%–20%.
The light curve is strongly variable from orbit to orbit with the eclipse being the only stable feature (Fig. 3). One particularly pronounced difference is the strong flare around phase 0.2 during cycle –2 (Fig. 3). The low intensity (especially before the eclipse) during the Oct. 1992 observation (cycle –4269) and the high intensity during the March 1993 observation (cycle –2209) are also noteworthy features. The panels of Fig. 3 with the individually phased observations do not show the secondary minimum around phase 0.35 seen in the folded light curve (Fig. 2), thus suggesting that it is not a pronounced minimum but produced by the strong flare in cycle –2. We finally note that the eclipses are strongly variable in shape suggesting an eclipse by the stream rather than that from a rigid body (see below).
2.1.3 Spectral characteristics
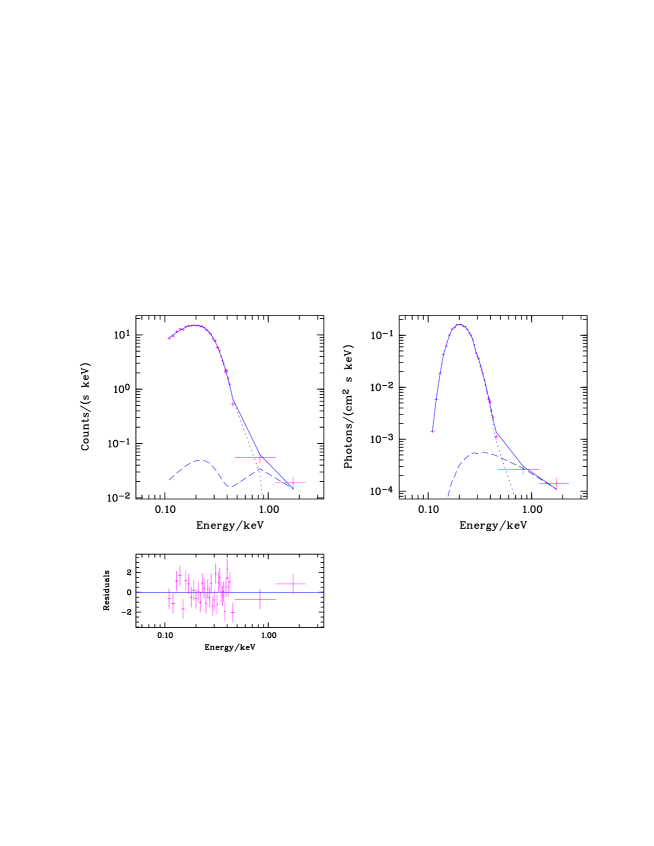
For the spectral analysis the X-ray photons have been background subtracted, vignetting corrected and binned into amplitude channels using a constant signal-to-noise ratio of 9. The X-ray spectrum of RX J1802.1+1804 (Fig. 5) is dominated by soft emission below 0.5 keV. In addition to this soft component there is faint but detectable hard emission (above 0.5 keV) which could be explained by the usual bremsstrahlung emission of AM Her variables. The temperature of this bremsstrahlung component cannot be confined with our spectra (Fig. 5) due to poor photon statistics at higher ROSAT energies and the restricted spectral range of the PSPC, thus a direct estimate of the bremsstrahlung component is possible only with ASCA data (Ishida et al. 1998). We therefore adopt a temperature of keV (and kept it fixed) for the spectral fitting. The best fit parameters for the mean phase-averaged spectrum are a blackbody temperature of = 2015 eV and an absorbing column of = (3.21) cm-2 (including systematic errors). The count rate spectrum and the unfolded photon spectrum are shown in Fig. 5 together with the residuals between model and data. This absorbing column is about half of the total galactic column in this direction (8.9 cm-2; Dickey & Lockman 1990) suggesting that at galactic latitude of bII=188 RX J1802.1+1804 may be at a distance of 100–200 pc.
The mean intensity of RX J1802.1+1804 in all ROSAT observations in the 0.1–2.4 keV band (excluding 0.1 phase units at the eclipse) is 3.4 cts/sec. The mean unabsorbed bolometric blackbody and bremsstrahlung fluxes (again excluding the eclipse) are Fbb=6.810-9 erg/cm2/s and Fth=4.110-12 erg/cm2/s, respectively (with some caution concerning the extrapolation of the soft component towards lower energies), corresponding to luminosities of Lbb=71033 (D/100 pc)2 erg/s and Lth=4.31029 (D/100 pc)2 erg/s. The ratio of photon flux of the blackbody to the bremsstrahlung component is 1670150 (bolometric) and 86 in the 0.1–2.4 keV range, respectively (using the same assumptions as in Beuermann & Burwitz 1995). Even if we account for the fact that blackbody fits overestimate the luminosity up to a factor of 2 as compared to white dwarf atmosphere models (Williams et al. 1987, Heise et al. 1994), this soft excess would still be large.
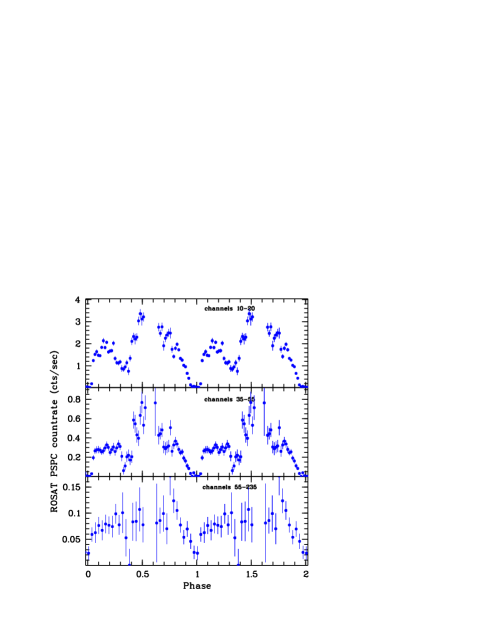
For the purpose of visualizing possible spectral variations with phase we have plotted the folded light curve in three distinct energy ranges (Fig. 4): (i) in channels 10–20, mostly affected by absorption effects, (ii) in channels 30–55, the part of the blackbody flux not affected by interstellar absorption and (iii) channels 55–235, the high-energy part of the ROSAT spectrum which is dominated by the hard, bremsstrahlung component. Two main characteristics are obvious: First, there is no great difference between the two soft panels except the relative depth of the intensity dips, suggesting that intrinsic absorption of soft X-ray photons plays only a minor role in the X-ray modulations outside of the dips. Second, the main intensity peak in soft X-rays is not accompanied by a corresponding peak above 0.55 keV. Moreover, the hard photon intensity peaks at a different phase.
The eclipse light curve is clearly asymmetric, with the egress being faster than the ingress by a factor 2–3 (see Fig. 3). In order to investigate possible absorption effects we have divided the data into 19 phase bins and fitted the sum of a blackbody and thermal bremsstrahlung model to the data, with the bremsstrahlung temperature again fixed at 20 keV and the blackbody temperature fixed at the best fit value of the phase-averaged spectrum (30 eV). Thus, only the absorption and the two normalizations were free fit parameters. In order to have more than 1000 photons in each phase bin, the bin size covering the eclipse had to be chosen twice as large as the other bins. The result is shown in the lower panel of Fig. 2 and shows more or less the same absorbing column for all phase intervals except the eclipse interval. Thus, we draw the following two conclusions: (1) The asymmetry in the eclipse light curve can not be explained by increased cold absorption during the ingress as compared to the egress. (2) The mean non-zero flux observed during eclipse is more absorbed than the emission outside eclipse by a factor of 2–3. This absorption alone could cause a drop of the X-ray count rate in the PSPC by a factor of 6–10 during this phase interval! However, cold absorption of that amount should only reduce the PSPC count rate below about channel 25, whereas Fig. 4 reveals that the drop in intensity occurs at basically all energies. In order to effectively absorb photons up to channel 100 would require a cold absorbing column (of the stream) of 1022 cm-2 incompatible with the pulse height spectrum during this phase interval. Thus, we conclude that the intensity drop around phase 0 (–0.05–0.05) is not exclusively due to cold absorption but needs either partial covering or warm absorption.
2.2 Optical data

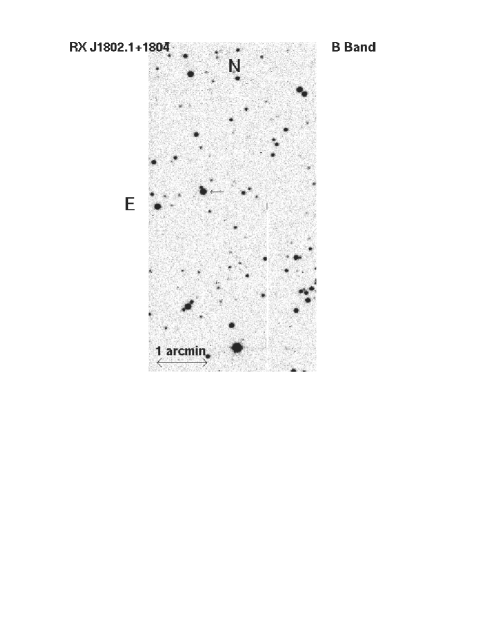
As noted above, RX J1802.1+1804 is optically identified with a V=15 mag cataclysmic variable. CCD imaging of the X-ray position was performed with the 1.2 m telescope at Observatoire de Haute-Provence on February 1, 1992. The images were flat-fielded using standard MIDAS routines. A 3 min. B band image is shown in Fig. 6, providing a finding chart for the optical counterpart. The optical position is measured as: R.A. (2000.0) = 18h02m064, Decl. (2000.0) = 18∘04′43′′(1′′).

Spectroscopic identification observation of the 15 mag. optical counterpart has been performed within the Galactic Plane Survey (Motch et al. 1991). The optical spectrum of RX J1802.1+1804 (Fig. 7) shows high-excitation characteristics, including broad emission lines of H, HeI and HeII, with strong contributions of He II relative to He I and the Balmer series.
Phase-resolved spectroscopic observations were obtained with the 1.3 m McGraw Hill telescope at MDM Observatory at Kitt Peak, Arizona on 1992 October 10, 11, and 12, and again on 1993 May 1, 2, and 6. The observations were made with the Mark III CCD spectrograph using a 600 line/mm grism that yielded 2.8 Å spectral resolution (FWHM) over the wavelength range of 3800-5100 Å. The total exposure times were 8 hr during 1992 October and 12.6 hr during 1993 May. The slit width was 35, and all of the observations were autoguided.


Data reductions were performed using the IRAF software package distributed by NOAO. The mean spectrum (see Fig. 7) was computed for each observing run, and this result then served as the template for measuring the radial velocities for individual spectra which were obtained every 200 s. The time series of radial velocities were then analyzed for periodicities using a variance minimization technique described by Stellingwerf (1978). A significant period was found for both observing runs. The superior result was derived during 1993 May (Fig. 8), with a period of 0.078479 0.00007 days (6780.66 sec). This period coincides within the errors with the period derived from the X-ray data. Assuming this value as the binary period, we folded the velocities (Fig. 10) and fit the results to a sine wave, yielding velocity semi-amplitudes, K = 81.07.2 km/s in 1992 October, and K = 154.56.0 km/s during 1993 May. These velocity differences suggest significant evolution in the accretion geometry between these two epochs. For example, there may have been changes in the proportion of the accretion rate travelling to the two magnetic poles.
We have determined equivalent widths of some emission lines from these May 1993 spectra, e.g. 61.3 Å (H), 51.3 Å (H), 51.9 Å (HeII 4686 Å), and 13.2 Å (HeI 4471 Å). It is worth not only to mention the large equivalent widths but also the high ratio of He II/H and He II/He I.
The photometric observations revealed 0.3 mag variations, but there were no optical eclipses. Folding the data with the above ephemeris gives the curves as shown in Fig. 10. During October 1992, the low intensity part occurs around the phase of the X-ray eclipse while the maximum of the high intensity part is about 90∘ later. This suggests that the emission is dominated by cyclotron emission and the modulation is due to its beaming perpendicular to the magnetic field lines. During June 1992 the optical light curve is distinctly different: the phasing seems to be shifted, the amplitude is much smaller (about 0.1 mag) and the shape is nearly symmetric. The maxima in the optical continuum also vary in amplitude from cycle to cycle, but they consistently appear near or just after the time at which the radial velocity crosses the midpoint from red-shifted to blue-shifted phases.
A check of 48 astrograph plates (F series; exposure time typically 30–50 min.) taken at Sonneberg Observatory between 1930–1932 and 1949–1968 showed the object to be either constant near the limiting magnitudes of the plates (amplitude smaller than 0.2 mag) or invisible on plates of poorer quality (Wenzel 1994).
3 Discussion
3.1 AM Her type classification
The coincidence of periods derived from the X-ray and optical data and the stability of the eclipse feature over more than 5 years suggest that the binary system is synchronized. The evidence of an X-ray eclipse without a corresponding optical eclipse together with the shape and variations with time of the X-ray eclipse imply that (1) the optical and X-ray radiation originate from different emission regions and (2) the X-ray emitting region is confined to a small region near the white dwarf. The localized X-ray emitting region strongly indicates a magnetic CV subclass, since the X-ray emission from an inner accretion disk would only show eclipses when the disk is occulted by the companion star – and such eclipses are evident in both X-ray and optical light.
The supersoft X-ray spectrum further suggests an AM Her / ‘polar’ subtype (rather than ‘intermediate polar’ type), since the association between AM Her objects and luminous emission in soft X-rays is well established. We note, however, that the discovery of three intermediate polars with strong soft X-ray emission has changed this clear association (Haberl and Motch 1995). However, the consistency of singular optical and X-ray periods in the case of RX J1802.1+1804 indicates the likelihood of spin / orbital synchronous rotation, another classic property of AM Her binaries. Finally, the large equivalent widths of the optical emission lines also suggest a polar nature.
An independent confirmation of the polar classification comes from polarimetric observations (Szkody et al. 1995). The circular polarization in the 5700–7700 Å range reaches a maximum of 4% in two peaks separated by a minimum which occurs at the time of photometric minimum.
3.2 Geometric configuration
The relatively short time scales observed for X-ray eclipse ingress, egress, and duration argue against the interpretation of eclipses as the disappearance of the X-ray emitting region behind the limb of the rotating white dwarf. We therefore interpret the eclipse as a self-eclipse of the X-ray emitting region by the accretion stream. X-ray spectral evidence for increased absorption column associated with the eclipse and the variable eclipse length provide further support for this conclusion.
Although one would expect the optical light curve to be more complex than the X-ray light curve due to several reasons (cyclotron radiation is beam-modulated and can be self-eclipsing; the recombination component is modulated by projection of the partially optically thick stream; additional light may be seen from the illuminated side of the secondary), the observed optical light curve is surprisingly smooth. Despite the stream-eclipse of the accretion spot in X-rays, the optical light is not affected due to its probable origin from a more extended region, including a portion of the accretion column upstream from the X-ray emitting area. The lack of optical eclipses suggests an inclination of ° (assuming a typical M5/6 companion).
During mid eclipse, there is still detectable emission not only in the total flux, but also in the soft X-ray component. Thus, it seems possible that the accretion spot is not fully eclipsed or we see another, uneclipsed emission component.
The presence of X-ray emission at all phases implies that 90° (with being the colatitude of the accreting magnetic pole). Combining this with the condition of stream eclipse () we derive the following constraints on and :
The X-ray light curve is very complex, and there are large differences seen when comparing observations well separated in time. This might suggest that the density and/or the size of the accretion stream vary with time and thus cause changes in the size and/or vertical extent of the accretion spot. In this regard, we note that the eclipse duration is not constant. Also, there are large changes in the characteristics of a secondary minimum, as noted in Section 2.1.2 and shown in Fig. 4. Furthermore, the eclipse length seems to be correlated with the intensity of the X-ray emission before and after the eclipse. During the Oct. 1992 observation (cycle –4269 in Fig. 3) with its X-ray low-state, the eclipse length is only 0.07 phase units, whereas it is 0.1 during the high-state in Sep. 1993 and even 0.12 in the last eclipse observed. A higher X-ray intensity may be caused by an increase in the rate of mass transfer, perhaps leading to a larger width of the accretion stream, which then increases the duration of the X-ray eclipse.
A significant larger ingress (5–7 min.) than egress (2–2.5 min.) is measured. Such asymmetry is possible if the impact area is not a circle but an arc due to the coupling of the stream to nonpolar field lines (see e.g. Beuermann et al. 1987 and their notion of “X-ray auroral oval”. Alternatively, the accretion stream can be imagined to impact the white dwarf surface not from a perpendicular direction thus forming an elongated footprint on the white dwarf surface. The slow fall of X-ray intensity into the eclipse minimum then can be understood as being due to two effects: first, the projected area of the footprint decreases due to the rotation of the white dwarf and secondly, the stream starts to occult the footprint area. This is consistent with the observed X-ray spectral property that the absorbing column does not change during the start of the slow fall into eclipse minimum (phase interval 0.0–0.1, see Fig. 2), but only during the eclipse (phase interval 0.1–0.2). Such behaviour is also consistent with the interpretation of the variation of the polarization being due to varying aspects of an emission region extended in longitude (Szkody et al. 1995). A size estimate of this elongated emitting region beyond an axis ratio of about 2–3:1 is hard to evaluate since the relative sizes of the emitting region and the stream are important.
The X-ray eclipse occurs about 35° after the blue-to-red crossing of the radial velocity curve. In our interpretation of a stream-eclipsing geometry this is consistent with the picture that the emission lines are produced in the ballistic part of the accretion stream. We note, however, that the radial velocity amplitude is lower than one would expect as the maximum free fall velocity.
The best fit blackbody temperature and the normalization transform into a corresponding blackbody radius of the emission region of 750 (D/100 pc) km. Bearing in mind the above mentioned elongation this is understood as the radius of a circle which has the same area as the elongated emitting region. If true, this implies a stream diameter near the white dwarf surface of the order of 850–1050 km.
Besides the herewith presented RX J1802.1+1804 several other polars have been found where the accretion stream was identified as the cause of narrow absorption dips in the EUV/X-ray light curves: EF Eri (Patterson et al. 1981, Beuermann et al. 1991), UZ For (Warren, Vallerga and Sirk 1995), EK UMa (Clayton & Osborne 1994), QS Tel (Beuermann & Thomas 1993, Buckley et al. 1993, Schwope et al. 1995), HU Aqr (Schwope et al. 1993, Hakala et al. 1993, Schwope et al. 1997), QQ Vul (Beardmore et al. 1995) and V2301 Oph (= 1H1752+081) (Hessman et al. 1997). Another stream-eclipsing polar may be AX J2315–592 which has recently been found from ASCA observations (Misaki et al. 1996, Thomas and Reinsch 1996). The EUVE light curves of UZ For show that both the phase and the amplitude of the dips vary over the 3-day observation suggesting variations in the density and position of the accretion stream similar to what we observed in the ROSAT light curves of RX J1802.1+1804. Also, the X-ray light curve of QQ Vul as observed with ROSAT is surprisingly similar to that of RX J1802.1+1804 (as given in Fig. 2).
3.3 Soft X-ray excess
As in several other AM Her binaries, the soft X-ray luminosity of RX J1802.1+1804 is larger than the hard one, a fact known as ‘soft X-ray problem’ (Rothschild et al. 1981). Kujpers & Pringle (1982) proposed that non-stationary accretion of dense blobs can heat the photosphere from below. This implies that high magnetic field systems should have a weak bremsstrahlung component, which is proved by a comparison of soft-to-hard flux ratios with measured magnetic field strengths in different AM Her systems (Beuermann & Schwope 1994). According to this correlation a magnetic field larger than 40 MG is suggested for RX J1802.1+1804 which has one of the highest ratios of soft/hard emission among polars. This would produce a very impressive Zeeman split in the H absorption lines coming from the white dwarf as well as strong cyclotron humps (depending on the viewing angle). However, since we observed the system “only” in its robust state of accretion, the optical spectrum is strongly dominated by the accretion stream making the determination of the magnetic field impossible.
4 Summary
We have identified the ROSAT all-sky-survey X-ray source RX J1802.1+1804 as a V=15 mag. AM Her type object with a period of 6780.650.01 sec (1.88351450.000003 hr). While the optical light shows a smooth sinusoidal intensity variation, the X-ray light curve exhibits a double wave structure with a nearly complete eclipse and a broad dip about 0.35 phase units later. We interpret the eclipse as being due to the self-occultation of the emission region by the accretion stream.
RX J1802.1+1804 is one of the X-ray brightest stream-eclipsing AM Her variables and the study of this source allows a deep insight in the geometry of this binary system. Further phase-resolved spectroscopy and polarimetry during a possibly upcoming optical low state should eventually reveal the magnetic field geometry.
Acknowledgements.
JG is supported by the Deutsche Agentur für Raumfahrtangelegenheiten (DARA) GmbH under contract numbers FKZ 50 OR 9201 and 50 QQ 9602 3. JG acknowledges substantial travel support from DFG GR 1350/6-1 for a visit of MIT where this work was completed. RR acknowledges partial support from NASA grant NAG5–1784. The ROSAT project is supported by the German Bundesministerium für Bildung, Wissenschaft, Forschung und Technologie (BMBF/DARA) and the Max-Planck-Society. This research has made use of the Simbad database, operated at CDS, Strasbourg, France.References
- (1) Beardmore A.P., Ramsay G., Osborne J.P., Mason K.O., Nousek J.A., Baluta C., 1995, MNRAS 273, 742
- (2) Beuermann K., Stella L., Patterson J., 1987, ApJ 316, 360
- (3) Beuermann K., Thomas H.-C., Pietsch W., 1991, A&A 246, L36
- (4) Beuermann K., Thomas H.-C., 1993, Adv. Space Res. 13, 115
- (5) Beuermann K., Schwope A.D., 1994, in Interacting Binary Stars, ed. A.W. Shafter, ASP Conf. Series 56, p. 119
- (6) Beuermann K., Burwitz V., 1995, ASP Conf. Ser. 85, 99
- (7) Beuermann K., 1998, in Perspectives of High Energy Astronomy & Astrophysics, Proc. of Int. Coll. to commemorate the Golden Jubilee of TIFR, Tata Inst. of Fund. Research, India, Aug. 1996 (in press)
- (8) Buckley D.A.H., O’Donoghue D., Hassall B.J.M., Kellett B.J., Mason K.O., Sekiguchi K., Watson M.G., Wheatley P.J., Chen A., 1993, MNRAS 262, 93
- (9) Clayton K.L., Osborne J.P., 1994, MNRAS 268, 229
- (10) Dickey J.M., Lockman F.J., 1990, ARAA 28, 215
- (11) Greiner J., Remillard R., Motch C., 1995a, Abano-Padova Conf. on Cataclysmic variables, eds. A. Bianchini, M. Della Valle, M. Orio, ASSL 205, 161
- (12) Greiner J., Remillard R., Motch C., 1995b, IAU Circ. 6200
- (13) Haberl F., Motch C., 1995, A&A 297, L37
- (14) Hakala P.J., Watson M.G., Vilhu O., Hassall B.J.M., Kellett B.J., Mason K.O. Piirola V., 1993, MNRAS 263, 61
- (15) Heise J., van Teeseling A., Kahabka P., 1994, A&A 288, L45
- (16) Hessman F.V., Beuermann K., Burwitz V., de Martino D., Thomas H.-C., 1997, A&A 327, 245
- (17) Ishida M., et al. 1991, ApJ 367, 270
- (18) Ishida M., Greiner J., Remillard R.A., Motch C., 1998, A&A (accompanying paper)
- (19) Kujpers J., Pringle J.E., 1982, A&A 114, L4
- (20) Lamb D. et al. 1985, in “Cataclysmic variables and LMXBs”, p. 179
- (21) Lampton M., Lieu R., Schmitt J.H.M.M., Bowyer S., Voges W., Lewis J., Wu X., ApJS 108, 545
- (22) Misaki K., Terashima Y., Kamata Y., Ishida M., Kunieda H. and Tawara Y., 1996, ApJ 470, L53
- (23) Motch C., Belloni T., Buckley D., Gottwald M., Hasinger G., Pakull M.W., Pietsch W., Reinsch K., Remillard R.A., Schmitt J.H.M.M., Trümper J., Zimmermann H.-U., 1991, A&A 246, L24
- (24) Patterson J., Williams G., Hiltner W.A., 1981, ApJ 245, 618
- (25) Rothschild R., et al. 1981, ApJ 250, 723
- (26) Schwope A.D., Thomas H.-C., Beuermann K., 1993, A&A 271, L25
- (27) Schwope A.D., Thomas H.-C., Beuermann K., Burwitz V., Jordan S., Haefner R., 1995, AA 293, 764
- (28) Schwope A.D., Mantel K.-H., Horne K., 1997, AA 319, 894
- (29) Shrader C.R., Singh K.P., Barrett P., 1997, ApJ 486, 1006
- (30) Singh K.P., Barrett P., Schlegel E., White N.E., Szkody P., Silber A., Howard D.W., Fierce E., 1995, IAU Circ. 6195
- (31) Szkody P., Silber A., Howard D.W., Fierce E., Singh K.P., Barrett P., Schlegel E., Piirola V., 1995, ApJ 455, L43
- (32) Stellingwerf R. F., 1978, ApJ 24, 953
- (33) Thomas H. -C. and Reinsch K., 1996, A&A 315, L1
- (34) Trümper J., 1983, Adv. Space Res. 2, 241
- (35) Warren J.K., Sirk M.M., Vallerga J.V., 1995, ApJ 445, 909
- (36) Wenzel W., 1994 (priv. comm.)
- (37) Williams J.A., King A.R., Brooker J.R.E., 1987, MNRAS 266, 725
- (38) Zimmermann H.U., Becker W., Belloni T., Döbereiner, Izzo C., Kahabka P., Schwentker O., 1994, MPE Report 257