08(08.16.7)
C O’Sullivan, creidhe@physics.ucg.ie
A Search for the Optical Counterpart of PSR B1951+32 in the Supernova Remnant CTB 80 ††thanks: Based on observations taken at SAO, Zelenchuk, Karachai-Cherkessia, Russia
Abstract
Using time-resolved two-dimensional aperture photometry we have put upper limits on the pulsed emission from two proposed optical counterparts for PSR B1951+32. Our pulsed upper limits of , , for the first candidate and , for the second, make it unlikely that either of these is, in fact, the pulsar. We discuss three further candidates, but also reject these on the basis of timing results. A search of a area centred close to these stars failed to find any significant pulsations at the reported pulsar period.
keywords:
– pulsars: individual: PSR B1951+321 Introduction
PSR B1951+32 is a fast pulsar in the peculiar combination supernova remnant (SNR) CTB 80. The characteristic spin-down age of the pulsar and the dynamical age of the SNR (Koo et al. 1990) are both yrs. Its low surface magnetic field strength, of T, is unusual amongst the selection of young and middle-aged pulsars detected so far but it has been suggested that this is more representative of young pulsars in general ([Lyne et al. 1983]). It is clearly important to test pulsar models with as wide a variety of pulsar parameters as possible.
Steady emission from the pulsar has so far been detected at radio ([Strom 1987]; [Kulkarni et al. 1988]) and X–ray ([Becker et al. 1982]; [Wang & Seward 1984]) wavelengths. Two possible optical counterparts have been proposed by Blair & Schild (1985) and Fesen & Gull (1985). Since the initial discovery of the 39.5-ms pulsar ([Kulkarni et al. 1988]), evidence for pulsed emission has also been found in X–rays ([Safi-Harb et al. 1995]) and –rays (Ramanamurthy et al. 1995) with upper limits in the infrared (Clifton et al. 1988). To-date no upper limits on pulsed emission in the optical have been published.
Optical observations are essential in determining the relative contributions of thermal and magnetospheric processes to pulsar emission. The continuing improvements in optical-detector sensitivities means that pulsed emission from 6 isolated neutron stars has already been detected. In this paper we present time-resolved optical observations of the central region of the supernova remnant CTB 80 and, in particular, of the two proposed pulsar candidates.
2 Observations
The observations were made during 1996 June and 1997 June using NUI, Galway’s TRIFFID camera. The TRIFFID system consists of a multianode microchannel array (MAMA) 2-dimensional photon-counting detector with a B extended S-20 photocathode ([Timothy & Bybee 1985]) and a fast data-collection system ([Redfern et al. 1993]). The position and time-of-arrival of each photon are recorded to a precision of 25m and 1s, respectively. TRIFFID’s 1024256-pixel array was mounted at the prime focus of the SAO 6-m Telescope (BTA), resulting in an equivalent spatial resolution of pixel-1. Timing was achieved using a GPS receiver and an ovened 10-MHz crystal. Absolute timing was unavailable for the 1996 observations however, and times were recorded relative to the last reset of the data-collection system. The data-collection system was reset at the start of the observing run and again after the 1996 June 23 observations.
The observations were made with standard B and V filters and are summarised in Table 1. In all, a total of 19,456 seconds of B-band data and 8,173 seconds of V-band data were collected. Photometric standard stars were observed each night for calibration purposes.
| Date | UTC | Filter | Duration | Seeing |
|---|---|---|---|---|
| (s) | () | |||
| 1996 June 22 | 20:31:00 | B | 9013 | |
| 1996 June 23 | 21:23:00 | V | 3756 | |
| 1996 June 23 | 22:28:30 | B | 1333 | |
| 1996 June 23 | 22:52:40 | B | 3110 | |
| 1996 June 24 | 22:33:41 | V | 4417 | |
| 1996 June 25 | 23:00:21 | B | 3300 | |
| 1997 June 04 | 22:59:17 | B | 2700 |
3 Data Reduction
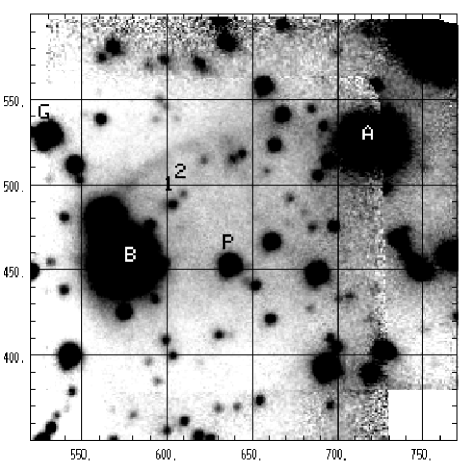
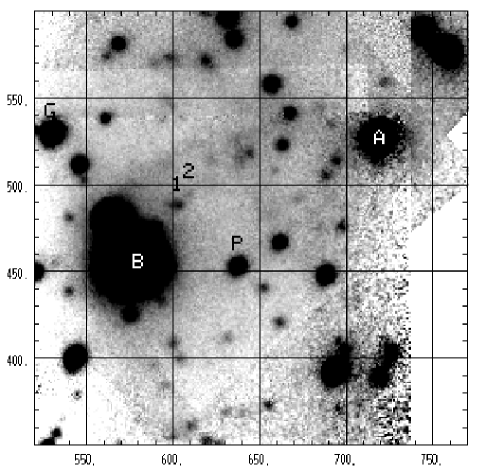
The data were first binned into 1-ms frames and divided by a deep flatfield image taken during the observation period. A post-exposure shift-and-add sharpening technique was applied to produce an integrated image ([Shearer et al. 1996]). Because of the large telescope aperture no significant improvement in the image above the seeing limit resulted, but any artefacts due to effects such as telescope wobble were removed. Data from individual nights were summed to produced the integrated V and B images shown in Figs. 1 and 2.
Photometry and astrometry were carried out using the IRAF daophot and GASP packages, respectively. The background level was taken to be the mean of the signal in an annulus of radius and width centred on the object position. Stellar co-ordinates were calculated using the astrometry of Blair & Schild (1985).
Several pulsar candidate positions were chosen as described in Sec. 4. Photon times were extracted from a window with a diameter equal to the seeing width centred on the pulsar candidate. The time series was translated to the solar-system barycentre using the JPL DE200 ephemeris and then folded in phase using the PSR B1951+32 ephemeris of [Foster et al. 1994] (Table 2). The resulting light curves were analysed using the statistic ([Buccheri & de Jager 1989]). The Fourier power-spectrum of each candidate was also calculated in the vicinity of the first four harmonics.
| Parameter | Value |
|---|---|
| 25.29739673Hz | |
| Hz s-1 | |
| Hz s-2 | |
| Epoch | 2447005.6880 |
4 Results
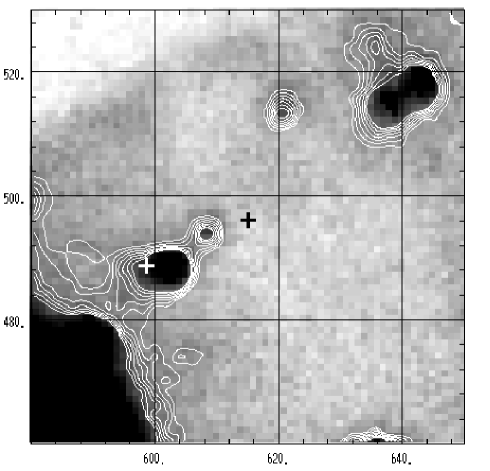
Figs. 1 and 2 show the integrated V- and B-band images. The proposed optical counterparts ([Blair & Schild 1985]; [Fesen & Gull 1985]) labelled 1’ and 2’, can clearly be seen in both images. The core region surrounding the two candidates is shown in Fig. 3, which is a sum of all the observations. The positions of the radio pulsar ([Foster et al. 1994]) and X-ray point source ([Wang & Seward 1984]) are also marked. Like Fesen & Gull we find no evidence for Blair and Schild’s candidate 3’ (down to a limiting magnitude of ), consistent with its identification as a H+[NII] emission knot. The photometry for these candidates, and those discussed later on, is given in Table 3. The magnitudes were calibrated with respect to Blair and Schild’s star A’. The quoted errors were calculated from a combination of counting statistics and flat-fielding errors. Our B1950 source positions of the two pulsar candidates are (candidate 1) and (candidate 2).
Estimates of the distance to the pulsar vary between about 1.4 kpc (from dispersion measure estimates, Kulkarni et al. 1988) to 3 kpc (studies of the infrared shell, Fesen et al. 1988). Following Safi-Harb et al. (1995) we adopt 2.5 kpc as a compromise between these extremes. Reddening estimates also vary and lie within the range E(B-V) = 0.8–1.4 (Angerhofer et al. 1980; Blair et al. 1984). We use a value E(B-V)= 1.0 which also gives a distance to the pulsar of about 2.5 kpc ([Blair & Schild 1985]). The measured values are equivalent to a star of absolute magnitude and intrinsic colour (B-V) (candidate 1) and , (B-V) (candidate 2).
| R.A.(1950) | Dec. (1950) | ||||||
|---|---|---|---|---|---|---|---|
| Source | V | B | (B-V) | (B-V)o | |||
| A | 19 51 02.10 | 32 45 15.0 | |||||
| 1 | 19 51 02.57 | 32 44 50.42 | 5.30 | 0.77 | |||
| 2 | 19 51 02.47 | 32 44 51.83 | 6.29 | 0.86 | |||
| 4 | 19 51 02.55 | 32 44 49.25 | 7.09 | -0.21 | |||
| 5 | 19 51 02.65 | 32 44 48.92 | 7.56 | -0.43 | |||
| 6 | 19 51 02.48 | 32 44 47.63 | 8.06 | -1.04 |
Photon times were extracted from apertures centred on the two pulsar candidates. No pulsations were seen, to the 1% significance level, in either the B- or V-band data sets. An upper limit for the pulsed fraction was calculated for the B and V emission assuming a duty cycle in the optical of 50%. These upper limits are conservative as pulse profiles in the X-ray ([Safi-Harb et al. 1995]) suggest a much lower duty cycle. The 3- upper limits were found to be , , for candidate 1, corresponding to pulsed fractions in V and in B. For candidate 2 we found , , corresponding to pulsed fractions in V and in B. These limits were calculated from the longest series of data taken with a given filter between resets of the data-collection system (see Section 2), a single data file (4,417 seconds) in the case of V and the sum of three files (13,456 seconds) in the case of B.
In Fig. 3 candidate 1 appears to be extended in the direction of the radio pulsar position, a feature that can be seen in both V and B data sets separately.
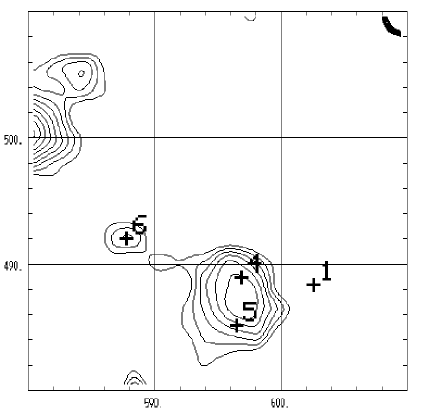
An accurate PSF for the image was determined using the external IRAF package DAOPHOTX, and used to remove the candidate 1 and 2 stars from the image. We found that the extension was consistent with two point sources. Fig. 4 shows the extension along with a another point-like feature nearby (we have labelled these candidates 4’,5’ and 6’ (Fig. 4).
We have tried to assign a magnitude and colour to each of these features, although their low signal-to-noise ratio and proximity to a brighter source makes this difficult to do with any accuracy. The photometry for these sources is included in Table 3. Absolute magnitudes and intrinsic colours are calculated assuming a distance of 2.5 kpc to the pulsar.
Times were extracted from all these candidates and analysed using the statistic and their Fourier power spectrum. Again, no pulsations were seen to the 1% significance level.
Fesen & Gull’s (1985) H+[NII] map of the core shows that some nebulosity is coincident with the candidate positions, although little was detected by Blair & Schild (1985). Spectra of CTB 80 filaments ([Blair et al. 1984]) show strong [OI], H, [NII] and [SII] emission lines, but these are removed by our filters. Emission lines in the B and V bands are much weaker, although our images do show some evidence of nebulosity. We cannot rule out the possibility that these fainter point-like sources are emission knots in the nebula.
Finally, we extracted photon times from apertures of radius centred on a two-dimensional grid of points separated by on the 1997 data. The grid covered an area centred close to the first candidate position. The photon times were reduced to the solar-system barycentre as before, and the statistic calculated for each aperture using the ephemeris in Table 2. No evidence for the pulsar was found.
5 Conclusions
On the basis of luminosity, colour and timing we conclude that neither of the proposed optical counterparts are the pulsar PSR B1951+32.
We note that the slight blue extension to candidate 1 shows the expected characteristics of a hot object. We would not expect to be sensitive to thermal radiation from the neutron star surface itself, as we estimate that a pulsar with T K at the distance of CTB 80 would have a magnitude in the range =30–31. We may, however, be able to see emission from any hot circumstellar material.
From phenomenolgical models of pulsar optical emission (Pacini and Salvati 1983, 1987) we can derive estimated magnitudes for the emission. For PSR 1951+32 this leads to values in the range 24–26. However recent observations of other middle-aged pulsars, 0656+14 and Geminga ([Caraveo et al. 1994], [Shearer et al. 1998]), have indicated a magnitude considerbly in excess of that predicted by the Pacini and Salvati model. It is clearly very important to establish a positive optical identification for PSR B1951+32 in order to compare emission from pulsars of similar ages but with a range of other parameters such as and magnetic field. These observations will be crucial if we are to distinguish between the various models for high-energy emission. In particular, the pulse shape and fraction can be used to differentiate the polar cap and outer gap models.
We suggest observations with the VLT, Keck or the HST in order to definitively identify the optical counterpart of PSR B1951+32.
References
- [Angerhofer et al. 1980] Angerhofer, P.E., Wilson, A.S., & Mould, J.R., 1980, ApJ, 236, 143
- [Becker et al. 1982] Becker, R.H., Helfand, D.J., & Szymkowiak, A.E., 1982, ApJ, 255, 557
- [Blair et al. 1984] Blair, W.P., Kirshner, R.P., Fesen, R.A., & Gull, T.R., 1984, ApJ, 282, 161
- [Blair & Schild 1985] Blair, W.P., & Schild R.E., 1985, Astrophys. Lett, 24, 189
- [Buccheri & de Jager 1989] Buccheri, R., & de Jager, O.C., 1989, in Timing Neutron Stars’, Ögelman, H.B., & van den Heuvel, E.P.J., Kluwer
- [Caraveo et al. 1994] Caraveo, P.A., Bignami, G.F., & Mereghetti, S., 1994, ApJ, 422, L87
- [Clifton et al. 1988] Clifton, T.R., Backer, D.C., Neugebauer, G., Kulkarni, S.R., Graham, J.R., & Matthews, K., 1988, A&A, 191, 1, L7
- [Fesen & Gull 1985] Fesen, R.A., & Gull T.R., 1985, Astrophys. Lett, 24, 197
- [Fesen et al. 1988] Fesen, R.A., Shull, J.M., & Saken, J.M., 1988, Nature, 334, 229
- [Foster et al. 1994] Foster, R.S., Lyne, A.G., Shemar, L. & Backer, D.C., 1994, AJ, 108, 1, 175
- [Koo et al. 1990] Koo, B.-C., Reach, W.T., Heiles, C., Fesen, R.A., Shull J.M., ApJ, 364, 178
- [Kulkarni et al. 1988] Kulkarni S.R., Clifton T.C., Backer D.C., Foster, R.S., Fruchter, A.S., & Taylor J.H., Nature, 1988, 331, 50
- [Lyne et al. 1983] Lyne, A.G., Manchester, R.N., Taylor, J.H., 1983, MNRAS, 213, 613
- [Pacini & Salvati 1983] Pacini, F., & Salvati, M., 1983, ApJ, 274, 369
- [Pacini & Salvati 1988] Pacini, F., & Salvati, M., 1987, ApJ, 321, 447
- [Ramanamurthy et al. 1995] Ramanamurthy, P.V., et al., 1995, ApJ, 447, L109
- [Redfern et al. 1993] Redfern, R.M., Shearer, A., Wouts, R., O’Kane, P., O’Byrne, C., Jordan, B.M., 1993, Proc. IAU Coll 136,137
- [Safi-Harb et al. 1995] Safi-Harb, S., Ögelman, H., & Finley J.P., 1995, ApJ, 439, 722
- [Shearer et al. 1996] Shearer, A., Butler, R., Redfern, R.M., Cullum, M., & Danks, A.C., 1996, ApJ, 473, L11
- [Shearer et al. 1998] Shearer, A., Golden, A., Harfst, S., Butler, R., Redfern, R.M., O’Sullivan, C.M.M., Beskin G.M., Neizvestny, S.I., Neustroev, V.V., Plokhotnichenko, V.L., Cullum, M., & Danks, A., 1998, submitted to A&A
- [Strom 1987] Strom, R.G., ApJ, 319, L103, 1987
- [Timothy & Bybee 1985] Timothy, J.G., & Bybee, R.L., 1985, S.P.I.E., 687,1090
- [Wang & Seward 1984] Wang, Z. R., & Seward, F.D., 1984, ApJ, 285, 607