A new look at the isotropy of narrow line emission in extragalactic radio sources
Abstract
We undertake a quantitative investigation, using Monte Carlo simulations, of the amount by which quasars are expected to exceed radio galaxies in optical luminosity in the context of the ‘receding torus’ model. We compare these simulations with the known behaviour of the [O III] 5007 and [O II] 3727 emission lines and conclude that [O III] is the better indicator of the strength of the underlying non-stellar continuum.
keywords:
galaxies: active – galaxies: nuclei – quasars: emission lines – radio continuum: galaxies1 Introduction
It is widely believed that radio-loud quasars and radio galaxies differ from each other only in terms of the angle between their radio axes and the line of sight (Scheuer 1987; Barthel 1989). Quasars are observed fairly close to the line of sight () and therefore frequently exhibit the effects of beaming, such as superluminal motion and luminous flat-spectrum radio cores, whereas radio galaxies are observed with their axes close to the plane of the sky, and do not show these effects. However, quasars also possess a luminous non-stellar optical continuum and broad emission lines, which are absent in radio galaxies. It has therefore been proposed that there is material around the nucleus which lies preferentially in the plane perpendicular to the radio axis and obscures the central regions from view in radio galaxies. Because of the geometry of this material, it is often referred to as the “torus”, but other geometries (e.g. a warped disk) are possible. Although the broad lines are hidden from direct view by this material, the narrow line region (NLR) is much larger in size and should be less strongly affected. It is therefore possible that narrow line luminosity could be an isotropic measure of the strength of the non-stellar continuum that is otherwise invisible in radio galaxies.
Jackson & Browne (1990) tested this idea by comparing the [O III] 5007 luminosities of quasars and radio galaxies with similar redshifts and extended radio luminosities. They reported that quasars are 5–10 times more luminous in this line than radio galaxies, and attributed the difference to higher extinction in radio galaxies. Hes, Barthel & Fosbury (1993) performed a similar test using the [O II] 3727 doublet and found that there was no measurable difference between the line luminosities of the two classes. Since [O II] is at a shorter wavelength than [O III] and would be more greatly affected by a foreground screen of reddening, they suggested that most of the [O III] emission is produced close to the nucleus and is still obscured by the torus in radio galaxies, whereas [O II] is produced farther out and is unaffected.
Unfortunately, Jackson & Browne’s analysis was biased because, although the radio galaxies were selected from the 3CR-based complete sample of Laing, Riley & Longair (1983; also called 3CRR), the quasars were drawn from a number of incomplete surveys and were therefore subject to uncertain selection effects, most notably the tendency to preferentially include optically bright objects. Since line and continuum luminosities are very well correlated in quasars, their result would be biased towards finding systematically higher line luminosities in the quasars. In addition, Jackson & Browne’s radio galaxy sample included some objects with very weak emission lines (Class B optical spectra; Hine & Longair 1979) that it is now believed may not belong to the unified scheme. An unbiased analysis significantly reduces the magnitude of Jackson & Browne’s result, but the quasars are still about twice as luminous in [O III] than the radio galaxies. This result is also seen in the higher [O III]/[O II] ratios in broad-line objects than in narrow-line objects (e.g. Saunders et al. 1989; Tadhunter et al. 1993). At higher redshift, however, the [O III] luminosities of the two classes of object are comparable (Jackson & Rawlings 1997).
Rawlings & Saunders (1991) note that the tendency for quasars to have a higher emission line luminosity than radio galaxies could be the result of a classification bias. This could explain the discrepancy in [O III] luminosities between the two classes, but appears to run counter to the similarity in the [O II] line emission. In this Letter, we apply the simple receding torus model (Lawrence 1991; Hill, Goodrich & Depoy 1996) to provide a quantitative explanation of the difference in [O III] luminosities between quasars and radio galaxies (and its redshift dependence), and explain why a similar effect is not seen in [O II]. The free parameters involved in our explanation are constrained by observed quantities independent of the emission line luminosities. We conclude that the luminosity of the [O III] 5007 line is an excellent indicator of the strength of the underlying non-stellar continuum.
2 Method
2.1 The receding torus model
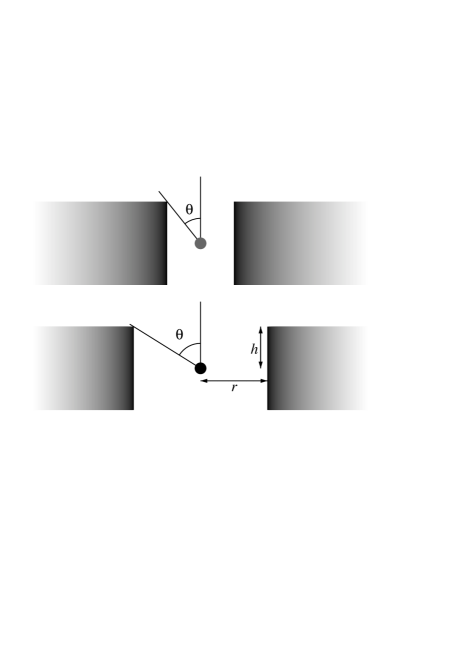
The receding torus model, as proposed by Lawrence (1991) and illustrated in Figure 1, is fairly simple. Dust evaporates at a temperature of about 1500 K, and cannot survive closer to the nucleus than the radius where the temperature of the nuclear radiation field is hotter than this. All quasars display a near-infrared bump longward of 1 m that is believed to be caused by thermal emission from dust, and the constancy of wavelength at which this bump appears indicates that dust is always present at the hottest possible temperatures. The inner radius of the torus is therefore determined by the radius at which dust evaporates, which scales as . If the half-height, , of the torus is independent of the source luminosity, then the half opening angle will be larger in the more luminous objects. Hill et al. (1996) find that this model fits the observed nuclear extinctions in radio galaxies very well.
We are more likely to be viewing the luminous objects within their cones, and are consequently more likely to classify them as quasars. Qualitatively then, this simple model could explain the tendency for quasars to have a higher [O III] luminosity than radio galaxies. We therefore undertake a quantitative investigation using Monte Carlo simulations.
2.2 Simulations
We consider an ensemble of objects with the same redshift and radio power, which could reasonably be assumed to have similar torus properties (e.g. torus height). Their intrinsic optical–ultraviolet luminosities will have a well-defined mean, , determined by the strong correlation between optical and radio luminosity, but will show scatter due to the intrinsic dispersion in this relationship. We assume this dispersion to be Gaussian in , with standard deviation . We define to be the half opening angle for an object with the mean luminosity, . An object with luminosity with therefore have an half opening angle,
and the probability that such an object will be observed as a radio galaxy (i.e. our line of sight is outside the opening angle of the cone) is
Obviously, .

For our ensemble of objects, we can therefore determine the ratio of the mean optical–UV luminosities of quasars and radio galaxies (we evaluate the mean in log space), for a given and . However, there exist observational data which allow us to fix these free parameters. First, Serjeant et al. (1998) measure the scatter about the mean optical–radio luminosity correlation for steep-spectrum quasars to be 1.5 magnitudes (0.6 dex). This will be slightly smaller than , since there should exist radio galaxies whose intrinsic optical luminosities are on average fainter than those of the quasars. However, Serjeant et al.’s sample was dominated by distant () quasars whose high luminosities would imply a large opening angle for the torus. At large opening angles, most objects are observed as quasars, and therefore the dispersion in optical magnitude in a quasar sample is close to the intrinsic dispersion of the parent AGN population (Figure 2). We thus adopt . The second constraint is the observed quasar (or radio galaxy) fraction; we must constrain such that the fraction in our simulation matches that in a radio-selected sample.

Following the reasoning of Laing et al. (1994) and others, when comparing our results to observed quantities, we consider only those radio galaxies with prominent emission lines. At and , where there exist high-quality optical spectra allowing classification on the basis of broad H (Laing et al. 1994), there are 15 such radio galaxies and 9 quasars. The observed radio galaxy fraction is therefore 0.625, corresponding to for (Figure 3; the value is extremely insensitive to the choice of ).
3 Results
3.1 Relative quasar/radio galaxy continuum and emission line luminosities
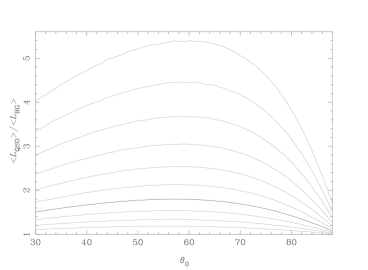
Figure 4 illustrates the amount by which quasars are expected to be overluminous compared to radio galaxies as a function of and , and for the values determined previously, we find . This is effectively the same as the difference in [O III] luminosities for the two groups of objects, which could therefore be explained if the [O III] emission line luminosity is directly proportional to the ionizing luminosity. Its constancy of equivalent width over approximately three orders of magnitude in luminosity (Miller et al. 1992) indicates that it is.

Why then is a similar effect not seen in the [O II] luminosity, since both emission lines correlate well with optical luminosity over several orders of magnitude in quasars? We believe that the answer is once again due to a bias introduced by scatter. Although the effective ionization parameter of the NLR does not correlate with luminosity (the range of quasar luminosities is far larger than the observed range of , ; e.g. Saunders et al. 1989), the most luminous objects at a given redshift will also have the highest ionization parameters. Figure 5 shows the dependence of [O III] and [O II] luminosity as a function of ionization parameter for an optically-thick plane-parallel slab. This was calculated with the photoionization code cloudy Version 84.12a (Ferland 1993) using the AGN continuum described in Mathews & Ferland (1987), although effectively identical results are obtained for power laws with a range of spectral index. Over the range of effective ionization parameter typical of the NLR, the [O II] luminosity is only very weakly dependent on the strength of the ionizing continuum. Whereas a hundredfold increase in increases the luminosity of [O III] by a factor of , the [O II] luminosity becomes only times larger. Although a single plane-parallel slab is obviously an overly simplistic model for the NLR, there is very little density dependence in the way the line luminosities vary with ionization parameter.
3.2 Redshift dependence
The lessening of the effect at higher redshift is easy to understand, since in the flux-limited 3CR sample this corresponds to higher luminosity and therefore a larger mean opening angle. At such large angles, variations in luminosity of an order of magnitude or less have little effect on the angle, and hence the bias towards more luminous objects being seen as quasars is smaller. This is apparent in Figure 4. Although radio galaxies outnumber quasars 2:1 at low , at the ratio is nearly reversed. In addition, there may be many objects like 3C 22 (Economou et al. 1995; Rawlings et al. 1995) or 3C 41 (Simpson, Rawlings & Lacy 1998; Economou et al. 1998) that possess broad H which is difficult to observe from the ground at due to it being redshifted into regions of poor atmospheric transmission or the window, whose strong OH airglow lines hamper the detection of broad features. The observed radio galaxy fraction of % at should therefore be considered an upper limit, and it provides a lower limit to . This corresponds to , and the ratio would drop below 1.5 if only one third of those objects currently classified as radio galaxies are really quasars. It should also be noted that measurement errors tend to be rather larger in near-infrared than in optical spectroscopy, and so the study of Jackson & Rawlings (1997) is less sensitive to differences in the two classes than are low redshift studies.
Jackson & Rawlings (1997) do not offer any explanation as to why they fail to observe a similar effect to that of Jackson & Browne (1990), yet it is naturally explained in our model as a luminosity, rather than a redshift, dependence. Although our model might appear to predict that high redshift samples whose luminosities are similar to those of low redshift 3CRR objects (e.g. a sample from the 7C catalogue) should also display a separation in [O III] luminosity with broad/narrow line class, such a prediction also depends on the assumption that the average torus height does not vary with redshift since this also controls the mean opening angle. We can predict that the difference between the [O III] luminosities of radio galaxies and quasars should be a function of quasar fraction (Figures 3 and 4), and should effectively vanish for samples with a large (%) quasar fraction.
3.3 Polarization properties
Since our model requires that effectively all the [O III] emission is seen directly, it appears to be in contradiction with the recent detection of polarized [O III] in radio galaxies by di Serego Alighieri et al. (1997). These authors calculate that 80–90% of the total [O III] emission is obscured in radio galaxies, but their calculations assume that the observed featureless continuum is entirely scattered. It is known that Seyfert galaxies possess an extended featureless continuum (FC2; Tran 1995) and it is reasonable to imagine that radio galaxies do also, thus lowering the estimate of the obscured fraction. In addition, the [O III] emission may be polarized, even if none is obscured, if the scattering region is distributed anisotropically. Although di Serego Alighieri et al. disfavour this idea, it is not in conflict with observations, and would be expected if the scattering material is associated with the outflow. The fact that polarized [O III] emission is detected in 3C 227 despite our relatively clear view of the nucleus seems to indicate that significant obscuration is not required for the line emission to be polarized. We also note that the size of the [O III]-emitting region that must be obscured is much larger than estimates for the height of the torus derived from the dust evaporation radius and cone opening angle. While the polarization data are intriguing, we therefore feel that our model is not in conflict with them.
4 Summary
We have used a simple receding torus model, whose free parameters are constrained by observation, to show that low redshift 3CRR quasars should be, on average, about twice as luminous in their ionizing continua as radio galaxies of the same radio luminosity. This difference should also be seen in their [O III], but not their [O II], emission line luminosities, in agreement with observation. For samples with a higher quasar fraction, such as the high redshift 3CRR objects, the difference in ionizing luminosities between quasars and radio galaxies should be smaller, and there should therefore be less of a difference in their [O III] luminosities, again in line with observation.
This model leads to the conclusion that the [O III] 5007 emission line, and not the [O II] 3727 doublet, is an unbiased indicator of the intrinsic optical–ultraviolet luminosity of both quasars and radio galaxies.
Acknowledgments
The author would like to thank Peter Eisenhardt for a useful discussion and Steve Rawlings for a critical reading of the manuscript. This work was performed by the Jet Propulsion Laboratory, California Institute of Technology, under a contract with NASA.
References
- [1] Barthel P. D., 1989, ApJ, 336, 606
- [2] di Serego Alighieri S., Cimatti A., Fosbury R. A. E., Hes R., 1997, A&A, 328, 510
- [3] Economou F., Lawrence A., Ward M. J., Blanco P. R., 1995, MNARS, 272, L5
- [4] —, 1998, in preparation
- [5] Ferland G. J., 1993, University of Kentucky Department of Physics and Astronomy Internal Report
- [6] Hes R., Barthel P. D., Fosbury R. A. E., 1993, Nature, 362, 326
- [7] Hill G. J., Goodrich R. W., DePoy, D. L., 1996, ApJ, 462, 163
- [8] Hine G., Longair M. S., 1979, MNRAS, 188, 111
- [9] Jackson N., Browne I. W. A., 1990, Nature, 343, 43
- [10] Jackson N., Rawlings S., 1997, MNRAS, 286, 241
- [11] Laing R. A., Riley J. M., Longair M. S., 1983, MNRAS, 204, 151
- [12] Laing R. A., Jenkins C. R., Wall J. V., Unger S. W., 1994, in Bicknell G. V., Dopita M. A., Quinn P. J., eds, ASP 54: The First Stromlo Symposium: The Physics of Active Galaxies. ASP, San Francisco, p. 201
- [13] Lawrence A., 1991, MNRAS, 252, 586
- [14] Mathews W. G., Ferland G. J., 1987, ApJ, 323, 456
- [15] Miller P., Rawlings S., Saunders R., Eales S., 1992, MNRAS, 254, 93
- [16] Rawlings S., Saunders R., 1991, Nature, 349, 138
- [17] Rawlings S., Lacy M., Sivia D. S., Eales S. A., 1995, MNRAS, 274, 428
- [18] Saunders R., Baldwin J. E., Rawlings S., Warner P. J., Miller L., 1989, MNRAS, 238, 777
- [19] Scheuer P. A. G., 1987, in Pearson T. J., Zensus J. A., eds, Superluminal Radio Sources. CUP, Cambridge, p. 104
- [20] Serjeant S., Rawlings S., Maddox S. J., Baker J. C., Clements D., Lacy M., Lilje P. B., 1998, MNRAS, in press
- [21] Simpson C., Rawlings S., Lacy M., 1998, in preparation
- [22] Tadhunter C. N., Morganti R., di Serego Alighieri S., Fosbury R. A. E., Danziger I. J., 1993, MNRAS, 263, 999
- [23] Tran H. C., 1995, ApJ, 440, 597