The luminosity function and clustering evolution of Quasars.
Abstract
Recent results have questioned the description of the QSO luminosity function in terms of a pure luminosity evolution and call for a luminosity dependent luminosity evolution. Measurements of the QSO clustering amplitude and evolution allow further distinguishing among the various physical scenarios proposed to interpret the QSO phenomenon. The general properties of the QSO population would arise naturally if quasars are short-lived events connected to a characteristic halo mass M⊙. This is the typical mass of groups of galaxies in which the interactions triggering the QSO activity preferentially take place.
1. Introduction
QSOs have played an important role as cosmic probes of the young universe: they are used as light beacons for absorption-line and gravitational lensing studies, as markers of galaxy formation activity and have guided astronomers in hunting up primeval galaxies. Their very existence at high redshifts is a challenge for cosmological models and historically the evolution of the QSO population has been one of the first evidences for an evolving universe. The nature of QSOs and the causes of their evolution, however, are far from being fully understood. In the standard “demographic” approach the basic physical ideas are tested against the observed shape and evolution of the QSO luminosity function (LF). As usual, with the growth and improvement of the databases this type of interpretation has become significantly more complex and we will argue that to disentangle the physical evolutionary patterns of QSOs additional information is needed, for example about their clustering properties.
2. The QSO Luminosity Function
In the early nineties the general consensus among the astronomers was that the shape of the QSO LF is a double power-law and its evolution, at least up to , can be satisfactorily represented by a pure luminosity evolution (PLE) (Boyle et al. 1988):
| (1) |
where and correspond to the bright-end and faint-end slopes of the optical LF, respectively. With this parameterization the evolution of the LF is uniquely specified by the redshift dependence of the break magnitude, , corresponding to a power-law evolution in the optical luminosity, . Such a result was essentially based on the AAT (Boyle et al. 1990) and PG (Schmidt & Green 1983) surveys with the addition of the faint data in the Marano field (Zitelli et al. 1992). The relevant parameters were estimated to be , , , with a redshift cutoff after which the evolution stops.

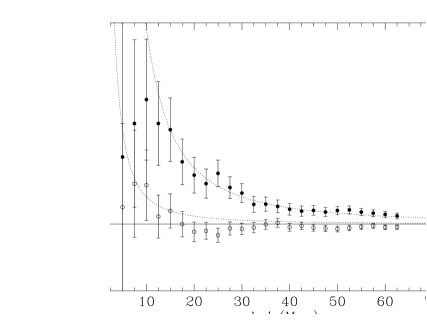
Then a new generation of bright surveys came: the LBQS (Hewett et al. 1995 and references therein), HBQS (Cristiani et al. 1995), EQS (Goldschmidt et al. 1992), HES (Wisotzki et al. 1996). It turned out that not only the surface density of bright QSOs () is definitely higher than it was thought before, but also the new LF is qualitatively different and cannot be reconciled with a PLE (Fig. 2).


The flattening of the slope in the bright part of the low-z LF is apparent and in the redshift bin the shape becomes consistent with a single power-law (Goldschmidt & Miller 1998). This behavior can be modeled with a luminosity dependent luminosity evolution (LDLE), in the form of an evolution of the break magnitude: where is the break magnitude at and
In this way the best-fitting parameters turn out to be
, , ,
, (La Franca & Cristiani 1997).
How robust is this result? Could this departure from PLE be due to
observational biases?
The new bright surveys have been carried out with different techniques:
UVx, slitless, and also cross-checked with other approaches, e.g. the
variability method (Hawkins & Vèron 1995),
and the results are essentially matching.
Effects due to the photometric errors (the Bennet bias), the non-unique
SED of QSOs, the variability, the representation of the LF
in discrete redshift bins are also accounted for
(La Franca & Cristiani 1997).
However, other biases could be lurking in: obscuration effects, either
intrinsic or intervening (Fall & Pei 1993, Webster et al. 1995);
effects due to the presence of the host
galaxy, especially for low-z, low-luminosity objects, although the
authors of various surveys state that this latter problem has been
considered and precautions taken accordingly.
In this respect, it will not be useless to compare the optical results
with radio and x-ray data.
Studies of radio QSOs show that there is an increase of the radio-loud fraction among the bright () QSOs, both in x-ray and optically selected samples (La Franca et al. 1994, Hooper et al 1996). Possibly there is also an increase of the radio-loud fraction at lower redshifts, but this result relies entirely on the PG sample and should be considered with caution. There are evidences in favor of a slower evolution of the optical LF (OLF) of radio-loud QSOs, with a . Hook et al. (this conference, Fig.6) show that the space density evolution is slower for more powerful radio sources. In this way it becomes possible to interpret the flattening of the bright part of the OLF as a slower evolution of bright, radio-loud QSOs.
X-ray QSOs, on the other hand, seem to follow an evolution pretty similar to the optically selected ones, with (Boyle et al. 1994), which is not surprising, given the relationship between the optical and X-ray luminosity of quasars (La Franca et al. 1995). Recent deep and shallow ROSAT surveys provide evidences for departures of the XLF from a PLE pattern (Hasinger 1998) and there might even be an indication of flattening of the XLF at low-z and high luminosities (see Fig. 1 of Hasinger 1998).
3. Physical Considerations on the Luminosity Function
At present there is a broad consensus that the QSO phenomenon is the result of accretion onto super-massive black holes (BH) in the nuclei of galaxies and a number of authors have linked the change in the QSO activity to a corresponding change in fuel supply at the center of the host galaxies (Cavaliere & Szalay 1986; Wandel 1991; Small & Blandford 1992; Haehnelt & Rees 1993; Yi 1996). The epoch of QSO formation is related to the time when the first deep potential wells form in plausible variants of hierarchical cosmogonies and various mechanisms for the evolution of the accretion modes have been explored (see Haehnelt, Natarajan and Rees 1998, Cavaliere this conference) to reproduce the observed luminosity function and its evolution. For example Cavaliere et al. (1997 and this conference) model the rise and fall of the QSO LF as the effect of two components: the newly formed BH, which are dominant at and the reactivated BH, which dominate at . The reactivation is triggered by interactions taking place preferentially in groups of galaxies, of typical halo mass M⊙. In this scenario the flattening of the bright end of the LF at low-z arises naturally due to the re-emergence of the first component which is overwhelmed by the second at intermediate redshifts.
In general, the agreement obtained by the various authors with the observed LF within the supermassive BH paradigm and also outside it (e.g. Boyle and Terlevich 1997) is remarkable. The study of the QSO clustering provides a powerful tool to unravel the riddle of the interpretations.
4. Clustering of QSOs
QSO clustering was detected for the first time more than ten years ago (Shaver 1984). At the beginning the measurement was based on inhomogeneous catalogs but soon it became possible to use the same statistically-well-defined samples used for the LF works, although with a significantly reduced number of QSOs. The two-point correlation function (TPCF, Peebles 1980) has been applied as a standard approach to investigate the QSO clustering, but other techniques have also been explored, such as the minimal spanning tree (Graham et al. 1995), fractal analysis (Andreani et al. 1991), counts in cells (Andreani et al. 1994).
In recent times complete samples totaling about 2000 QSOs have been used, providing a detection of the clustering on scales of the order of comoving Mpc (Andreani & Cristiani 1992, Mo & Fang 1993, Croom & Shanks 1996). The evolution of this clustering is not clear. An amplitude constant in comoving coordinates or marginally decreasing with increasing redshift has been suggested, an amplitude which appears to be consistent or slightly larger than what is observed for present-day galaxies and definitely less than the clustering of clusters. Measurements of the quasar-galaxy correlation indicate an amplitude about 4 times the galaxy-galaxy clustering (Fisher et al. 1996).
With all the caveats due to their exotic nature, QSOs display a number of appealing properties when compared to galaxies as cosmological probes of the intermediate-linear regime of clustering, on distances Mpc: they have a rather flat , allow defining samples which are in practice locally volume limited, their point-like images are less prone to the surface-brightness biases typical of galaxies and they sparse-sample the environment. The sparse sampling is an advantage, in the sense that the contribution of each QSO or QSO pair to the correlation functions in practice turns out to be independent, making statistics easy, but is also a nuisance, because the sensitivity to the clustering signal is low.
In an attempt to improve the situation, while waiting for the 2dF QSO redshift survey, we have carried out a survey in the South Galactic Pole (SGP) over a connected area of 25 square degrees down to . Stacked UKSTU plates were used to select UVx candidates and the multi-fiber spectrograph MEFOS at ESO to take spectra of them. The final sample is made up of 388 QSOs with (La Franca et al 1998a).
The TPCF analysis gives an amplitude Mpc, in agreement with previous results. However, when the evolution of the clustering with redshift is analyzed, evidence is found for an increase of the clustering with increasing z (La Franca et al. 1998b). The effect is small, at a level (Fig. 3), but is interestingly corroborated by other results in the literature.

Boyle and Mo (1993) measured the clustering of low-z QSOs in the EMSS and Georgantopoulos and Shanks (1994) used the IRAS point source catalog to measure the clustering of Seyferts. Altogether a low value of the TPCF at 15 Mpc and z=0.05 is obtained, . It may be argued that these surveys tend to select low-luminosity objects and the comparison with the SGP data could not be entirely significant, but an analysis on restricted absolute magnitude slices of the SGP sample shows no correlation of the clustering with the QSO absolute luminosity. Besides, the data of the Palomar Transit Grism Survey (Kundić 1997, Stephens et al. 1997) allow measuring the amplitude of the TPCF at redshifts higher than 2.7 and the result, Mpc, suggests that the trend of increasing clustering persists.
If we describe the evolving correlation function in a standard way: , where is an arbitrary (and not very physical) fitting parameter, we obtain , which is inconsistent with the observed for faint galaxies at lower redshifts (Le Fèvre et al. 1996, Carlberg et al. 1997, Villumsen et al. 1997). Great care should be exercised however when carrying out this comparison. Are the faint lower-redshift galaxies representative of the same population of galaxies for which recent observations by Steidel et al (1998) show substantial clustering at ? Are the Lyman-break galaxies progenitors of massive galaxies at the present epoch or precursors of present day cluster galaxies (Governato et al. 1998)? Can a mass scale of the order be made consistent with the observations of field galaxy clustering at all redshifts (Moscardini et al. 1998) via an interplay between the clustering of mass (decreasing with increasing redshift) and the bias (increasing with redshift)?
If we treat clustering according to the models in which quasars at are associated with interactions, then we may relate their clustering properties - following Matarrese et al. (1997) - to those of transient objects, which is definitely different from the case of galaxies which, depending on the physical scenario, can be associated with a merging or object-conserving paradigm of long-lived objects. In this way the observed clustering is the result of the convolution of the true clustering of the mass with the bias and redshift distribution of the objects and differences in each of these factors may lead to different results. If we think of QSOs as objects sparsely sampling halos with an increase of their clustering is expected because they are sampling rarer and rarer overdensities with increasing redshift. We may also ask what are the typical masses which allow reproducing the observed clustering. As we can see from Fig. 4 an would provide the desired amount of clustering and evolution, and would be also in pleasing agreement with the predictions derived in Sect. 3 from the analysis of the QSO luminosity function.
References
Andreani, P., Cristiani, S., La Franca, F. 1991, MNRAS, 253, 527
Andreani, P., Cristiani, S. 1992, ApJ, 398, L13
Andreani, P., Cristiani, S., Lucchin, F., Matarrese, S., Moscardini, L. 1994, ApJ, 430, 458
Boyle B.J., Shanks T., Peterson B.A., 1988, MNRAS, 235, 935
Boyle, B. J., Fong, R., Shanks, T., Peterson, B.A. 1990, MNRAS, 243, 1
Boyle, B.J., Mo, H.J. 1993, MNRAS, 260, 925
Boyle B.J., Shanks T., Georgantopoulos I., Stewart G.C., Griffiths R.E. 1994, MNRAS, 271, 639
Boyle B.J., Terlevich, R.J. 1997, astro-ph/9710134
Carlberg, R.G., Cowie, L.L., Songaila, A., Hu, E.M. 1997, ApJ, 484, 538
Cavaliere, A., Szalay, A.S., 1986, ApJ, 311, 589
Cavaliere, A., Perri, M., Vittorini, V. 1997, Mem.S.A.It., 68, 27
Cristiani, S., La Franca, F., Andreani, P. et al. 1995, A&AS, 112, 347
Croom, S.M., Shanks, T. 1996, MNRAS, 281, 893
Fall, S.M., Pei, Y.C. 1993 ApJ, 402, 479
Fisher, K.B., Bahcall, J.N., Kirhakos, S., Schneider, D. P. 1996 ApJ, 468, 469
Georgantopoulos, I., Shanks, T. 1994, MNRAS, 271, 773
Goldschmidt P., Miller L., La Franca F., Cristiani S., 1992, MNRAS, 256, 65p
Goldschmidt P., Miller L. 1998, MNRAS, 293, 107
Governato, F., Baugh, C.M., Frenk, C.S., Cole, S., Lacey, C.G., Quinn, T., Stadel, J. 1998, Nature in press
Graham, M.J., Clowes, R.G., Campusano, L.E. 1995, MNRAS, 275, 790
Haehnelt, M.G., Rees, M.J. 1993, MNRAS, 263, 168
Haehnelt, M.G., Natarajan, P., Rees, M.J. 1998, MNRAS, in press, astro-ph/9712259
Hasinger, G. 1998, Astronomische Nachrichten in press, astro-ph/9712342
Hawkins, M.R.S., Vèron, P. 1995, MNRAS, 275, 1102
Hewett P.C., Foltz C.B., Chaffee F.H., 1995, AJ, 109, 1498
Hooper, E.J., Impey, C.D., Foltz, C.B., Hewett, P.C. 1996, ApJ, 473, 746
Kundić, T., 1997, ApJ, 482, 631
La Franca, F., Cristiani S., Barbieri, C. 1992, AJ, 103, 1062
La Franca, F., Gregorini, L., Cristiani, S., De Ruiter, H., Owen, F. 1994, AJ, 108, 1548
La Franca, F, Franceschini, A., Cristiani, S., Vio, R. 1995, A&A 299, 19
La Franca, F., Cristiani, S. 1997 AJ, 113, 1517; ERRATUM, 1998 AJ, 115, April issue
La Franca, F., Lissandrini, C., Cristiani, S., Miller, L., Hawkins, M.R.S., McGillivray, H.T., 1998a, in prep
La Franca, F., Andreani, P., Cristiani, S. 1998b, ApJ, in press astro-ph/9711048
Le Fèvre, O., Hudon, D., Lilly, S.J., Crampton, D., Hammer, F., and Tresse, L. 1996, ApJ, 461, 534
Matarrese, S., Coles, P., Lucchin, F., and Moscardini, L. 1997, MNRAS, 286, 115
Moscardini, L., Coles, P., Lucchin, F., Matarrese, S., 1998, MNRAS submitted, astro-ph/9712184
Mo, H.J., Fang, L.Z. 1993, ApJ, 410, 493
Peebles, P.J.E. 1980, The Large Scale Structure of the Universe, Princeton University Press, Princeton
Schmidt, M., Green, R.F. 1983, ApJ, 269, 352
Shaver, P.A. 1984, A&A, 136, L9
Small, T.A., Blandford, R.D. 1992, MNRAS, 259, 725
Steidel, C.C., Adelberger, K.L., Dickinson, M., Giavalisco, M., Pettini, M., Kellogg, M 1998 ApJ, 492, 428.
Stephens, A.W., Schneider, D.P., Schmidt, M., Gunn, J.E., Weinberg, D.H., 1997, AJ, 114, 41
Villumsen, J.V., Freudling, W., da Costa, L.N 1997, ApJ, 481, 578
Webster, R.L., Francis, P.J., Peterson, B.A., Drinkwater, M.J., Masci, F.J. 1995, Nature 375, 469
Wisotzki L., Kohler T., Groote D., Reimers D., 1996, A&AS, 115, 227
Yi, I. 1996, ApJ, 473, 645
Zitelli, V., Mignoli, M., Zamorani, G., Marano, B., Boyle, B.J. 1992, MNRAS, 256, 349