Study of the LISM using Pulsar Scintillation
Abstract
We present here the results from an extensive scintillation study of twenty pulsars in the dispersion measure (DM) range carried out using the Ooty Radio Telescope, to investigate the distribution of ionized material in the local interstellar medium (LISM). Our analysis reveals several anomalies in the scattering strength, which suggest that the distribution of scattering material in the solar neighborhood is not uniform. Our model suggests the presence of a low density bubble surrounded by a shell of much higher density fluctuations. We are able to put some constraints on geometrical and scattering properties of such a structure, and find it to be morphologically similar to the local bubble known from other studies.
1 Introduction
Propagation effects on pulsar signals, such as dispersion and scattering, probe the distribution of thermal plasma in the interstellar medium (ISM). Scattering studies of radio waves from pulsars, enable us to probe the electron density fluctuations in the ISM, which are presumably due to turbulence in the ISM (Rickett 1990). Not much is known about electron densities and their fluctuations in the LISM and in order to investigate this in detail, we have made extensive scintillation observations of twenty nearby pulsars. Reliable and accurate estimates of strength of scattering have been obtained and the results are used to study the distribution of electron density fluctuations in the LISM.
2 Observations and Data Analysis
The observations were made using the Ooty Radio Telescope (ORT) at 327 MHz. Within the sky coverage and sensitivity limits of the ORT, there are twenty nearby pulsars that were found suitable for studying the LISM. For these pulsars, the dynamic scintillation spectra intensity variation in the frequency-time plane were measured over 2060 epochs, spanning 100 days during 199395. Such spectra display intensity scintillation patterns that fade over narrow frequency ranges and short time intervals (Fig. 1), arising from diffractive scintillation effects. We obtained dynamic spectra data with a frequency resolution 140 kHz and a time resolution 10 secs.
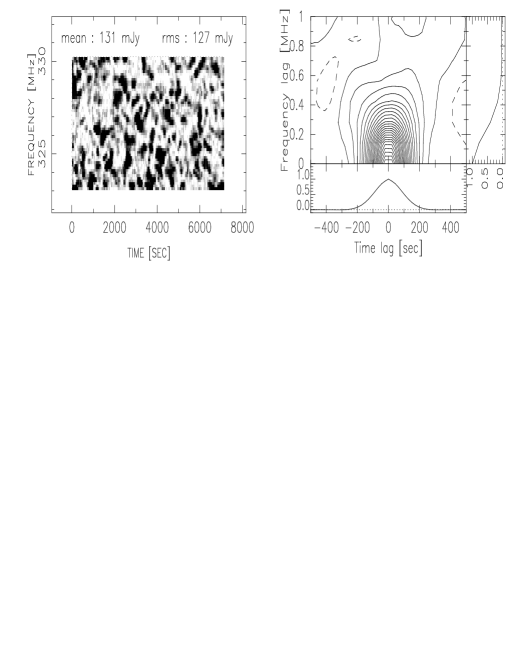
To quantify the average characteristics of scintillation patterns at any epoch, we have computed the two-dimensional auto co-variance function (ACF) and fitted a two-dimensional gaussian to yield decorrelation bandwidth and scintillation time scale , which are the widths of the ACF along zero time and frequency lag axes respectively (Gupta et al. 1994). The large number of epochs of observations allow us to average out long-term fluctuations of these parameters, arising from refractive scintillation effects, giving an accuracy of 510%. From these estimates, we derive the line-of-sight averaged strength of scattering (Cordes et al. 1985), given by
| (1) |
where is the observing frequency, D is the distance estimate of the pulsar (based on the model given by Taylor and Cordes 1993), and is the power-law index for electron density spectrum (Armstrong et al. 1995). We have assumed in our calculations.
The derived values of show roughly two orders of magnitude fluctuations (ranging from to ), which is about 10 times larger than earlier estimates and much larger than that predicted from current models for the distribution in the galaxy (Cordes et al. 1985). Fig. 2.c shows these variations have a systematic trend, in that they are dominant for nearby (D 1.5 kpc) pulsars. In addition to this, we find several cases where pulsars at comparable DMs or distances show remarkably different scintillation characteristics. In order to study such effects, we consider two pulsars at similar DMs, having decorrelation bandwidths and , and define an anomaly parameter () as
| (2) |
A plot of the anomaly parameter against DM (Fig. 2.a) shows a systematic variation, implying density fluctuations are distributed in a structure that is local and is asymmetrically located relative to the sun. The anomaly parameter as a function of the distance (Fig. 2.b) shows a similar behaviour.

3 Interpretation of Results
We try to understand our observations by comparing the measured anomalies with anomalies predicted by specific density structures around the sun. Simple models consisting of an excess or deficiency of scattering material around the sun are unable to reproduce the observed trends of and . To explain our observations, we need a 3-component scattering medium with a cavity surrounded by a shell of much higher density fluctuations embedded in the normal, large scale ISM. The sun has to be located away from the centre of the cavity. By adjusting the parameters of the model, we are able to generate a reasonable agreement with the observations. By further assuming that the strength of scattering from the shell decreases with z-height, we are able to improve the agreement (lower panels of Figs. 2.a and 2.b). The best fit values of the parameters of the local scattering structure are such that the observed trends of the parameters and (Fig. 2) are reproduced. The geometry of the structure is schematically shown in Fig. 3. For the size, constraints from our model are 55 pc, 60 pc and pc. The centre has an offset 40 pc from the sun, towards and . The density fluctuations are such that for the inner cavity, for the shell, (where d is the thickness) and for the outer ISM. Since the strength of scattering of the shell is much higher than those of the cavity and the outer ISM, it contributes substantially to the scattering of nearby pulsars outside the shell. The relative contribution from the shell decreases with the distance, which gives rise to systematic variations of and (Fig. 2). The offset from the sun () and the size in the galactic plane ( and ) are not uniquely constrained and our results can also be explained by a relatively bigger, but less asymmetric structure (the dashed geometry in Fig. 3).

The exact relations between the scattering strengths and other properties of the medium are not well understood. If we assume , where is the mean electron density, our observations would imply a density contrast 1020 times between the shell and the ambient ISM in the case of a thin shell ( 1 pc) and 58 times for 10 pc thick shell. The simple model considered here does not constrain the thickness of the shell. The pulsar PSR B0950+08 that has a parallax distance 130 pc is located, in our model, within the cavity implying , which is 4 times larger than its value from X-ray data (Snowden et al. 1990). Our constraints are, morphologically, in broad agreement with that of local bubble, obtained from X-ray, UV and HI data. Our results suggest that the bubble is surrounded by a shell of much higher density fluctuations and further investigations are required towards accurate estimates on more detailed characteristics of the shell boundary.
References
- [1] ars95Armstrong et al. 1995 Armstrong, J.W., Rickett, B.J., Spangler, S.R. (1995): ApJ 443, 209
- [2] cwb85Cordes et al. 1985 Cordes, J.M., Weisberg, J.M., Boriakoff, V. (1985): ApJ 288, 221
- [3] grl94Gupta et al. (1994) Gupta, Y., Rickett, B.J., Lyne, A.G. (1994): MNRAS 269, 1035
- [4] r90 Rickett B.J. (1990): Ann. Rev. Astron. Ap. 28, 561
- [5] scms90Snowden et al. 1990 Snowden, S.L., Cox, D.P., McCammon, D., Sanders, W.T. (1990): ApJ 354, 211
- [6] tc93 Taylor, J.H., Cordes, J.M. (1993): ApJ 411, 674