Optical follow-up of GRB 970508
Abstract
We report on the results of optical follow-up observations of the counterpart of GRB 970508, starting 7 hours after the event. Multi-color U, B, V, Rc and Ic band observations were obtained during the first three consecutive nights. The counterpart was monitored regularly in Rc until 4 months after the burst. The light curve after the maximum follows a decline that can be fitted with a power law with exponent = –1.141 0.014. Deviations from a smooth power law decay are moderate (r.m.s. = 0.15 magnitude). We find no flattening of the light curve at late times. The optical afterglow fluence is a significant fraction, 5%, of the GRB fluence. The optical energy distribution can be well represented by a power law, the slope of which changed at the time of the maximum (the spectrum became redder).
1 Introduction
With the Wide Field Cameras (WFCs; Jager et al. 1995) onboard BeppoSAX (Piro et al. 1995) it became possible for the first time to rapidly determine accurate (3′ radius) GRB positions (Costa et al. 1997a,b; In ’t Zand et al. 1997; Heise et al. 1997a); such positions, as it turned out, are the necessary ingredient for succesful counterpart searches (see also Takeshima et al. 1997 and Smith et al. 1997). The detection of a fading optical counterpart to GRB 970228 provided the first arcsecond localization of a GRB (Groot et al. 1997a; Van Paradijs et al. 1997; Galama et al. 1997a,b). Its coincidence with a faint extended object (Groot et al. 1997b; Metzger et al. 1997a; Sahu et al. 1997a), which is probably the host galaxy, suggests a cosmological distance for the GRB. A second optical transient (OT) was found for GRB 970508 (Bond 1997). The measurement of a lower bound to the redshift ( 0.835; Metzger et al. 1997b) of this optical counterpart has unambiguously settled the cosmological distance scale to GRB sources.
On May 8.904 UT the Gamma-Ray Burst Monitor (GRBM) on BeppoSAX recorded a moderately bright GRB (Costa et al. 1997c), which was also recorded with its Wide Field Cameras. The fluences, recorded with the GRBM (40-700 keV) and WFC (2-26 keV), were (1.8 0.3) erg cm-2 and (0.7 0.1) erg cm-2, respectively (Piro et al. 1997a). The burst was also recorded (Kouveliotou et al. 1997) with BATSE (Fishman et al. 1989) with a total 20-1000 keV fluence of erg cm-2, and a peak flux density (50-300 keV) of ( erg cm-2 s-1. From optical observations of the WFC error box (Heise et al. 1997b), made on May 9 and 10, Bond (1997) found a variable object at RA = , Dec = +79∘16′19′′(J2000), which showed an increase by 1 mag in the V band. BeppoSAX Narrow Field Instrument observations revealed an X-ray transient (Piro et al. 1997b) whose position is consistent with that of the optical variable. Extended emission is not associated with this optical counterpart (Fruchter et al. 1997, Sahu et al. 1997b, Pian et al. 1997), and Natarajan et al. (1997) showed that either GRB 970508 originated from an intrinsically very faint dwarf galaxy or that it occured at a large distance from a host galaxy ( kpc).
We here report on the results of optical photometry of GRB 970508, made between 0.3 and 110 days after the burst.
2 Optical Photometry
We have used the 4.2m William Herschel Telescope (WHT) at La Palma to make optical observations in U, B, V, Rc and Ic of the WFC error box both with the Prime Focus Camera (PF, f.o.v. 9090), and the Auxiliary Port Camera (AUX, f.o.v. 09 radius). All WHT PF exposures lasted 600 seconds, except the one made on Aug 26.9 UT which lasted 1800 seconds. The WHT AUX exposures were 3600 seconds each. As part of the Kitt Peak National Observatory Queue observations, observations were also made with the 3.5m WIYN telescope, using the WIYN Imager S2KB at the Nasmyth focus. Ten 6868 R-band images were obtained between May 9.15 and 9.23 UT at several pointings to cover the whole error box. All exposures lasted 300 seconds. A log of the observations is shown in Tab. 1.
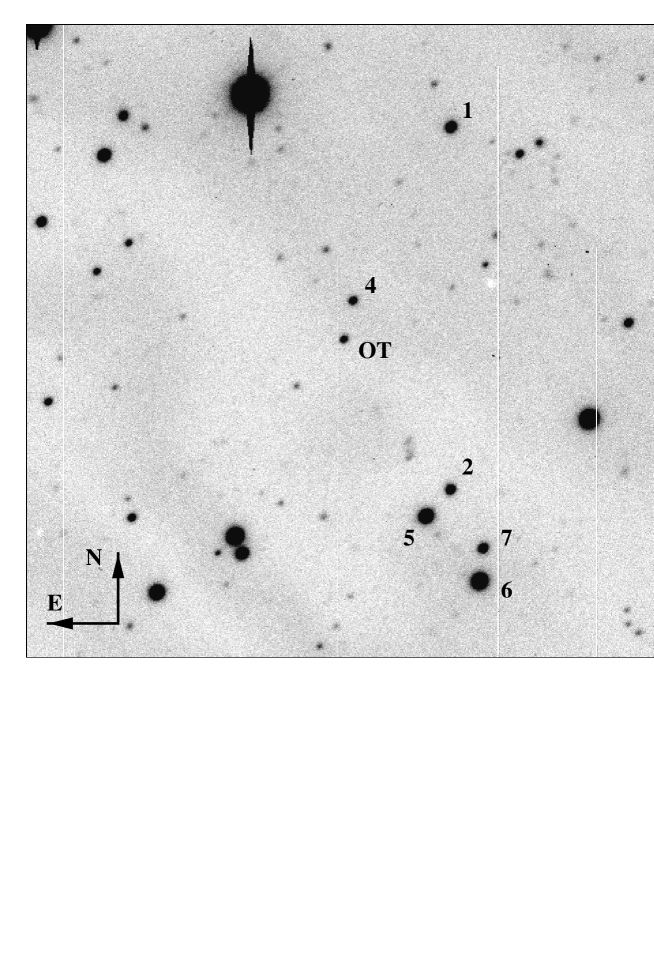
We have corrected the U and B band images for the non-linearity at low counts of the LORAL2 CCD Chip111La Palma webpage http://www.ing.iac.es, used for the May 10, 11, and 12 WHT observations (this effect is negligible in the V, Rc and Ic observations). We made a photometric calibration (U, V, Rc and Ic) using WHT observations on May 9.99 UT of the Landolt (1992) fields PG1047+003 and PG1530+57. For V, Rc and Ic we find good agreement with the results of Sokolov et al. (1997). To include a B band calibration, and avoid small calibration differences with respect to Sokolov et al. (1997) we used the B, V, Rc and Ic reference stars (1, 2 and 4 in Fig 3) as given by Sokolov et al. (1997) (their star 3 was close to saturation and therefore not used). Stars 2, 5, 6 and 7 were used as secondary photometric standards for the U band (see Fig 3). We have corrected for a U band atmospheric extinction of 1.3 times the nominal extinction (as Carlsberg Automatic Meridian Circle V band extinction measurements indicate)12.
3 The Rc Band Differential Optical Light curve
In Fig. 1 we present the Rc band optical light curve, where we have included results of differential photometry (relative to local reference stars; filled symbols) and calibrated photometry (open symbols). The differential magnitudes in Tab. 1. were determined with respect to stars 1, 2 and 4. The other differential data are from Sokolov et al. (1997; determined with respect to star 1, 2, 3 and 4), Pedersen et al. (1997), Garcia et al. (1997), Schaefer et al. (1997) and Chevalier et al. (1997). The magnitudes in the last four data sets were determined with respect to star 4 only. In the absolute calibration of these differential data sets we used the Rc magnitudes of these reference stars as given by Sokolov et al. (1997). Note that this involves a correction to the data of Pedersen et al. (1997), Schaefer et al. (1997) and Chevalier et al. (1997) by –0.21 magnitudes for the difference by that amount in for reference star 4 used by these authors. The difference, in our data, in the Rc magnitudes of the OT, resulting from the use of stars 1, 2 and 4, or only star 4 as a reference star, has an r.m.s of 0.027 magnitude. For data sets with a sufficiently large number of points and covering a time interval of at least 50 days on the power law decay part of the light curve (i.e., those of Sokolov et al. 1997, Pedersen et al. 1997, and our data) we made a second-order correction by a magnitude calibration offset, determined from the weighted average offset with respect to the power law decay part of the light curve. The corrections are , and , for, respectively, our data (Tab. 1), Sokolov et al. (1997) and Pedersen et al. (1997). We have assumed a conservative minimum error in the differential magnitudes of 0.05 magnitudes.
The Rc band light curve shows a maximum between May 10.2 and 10.8 UT, 1.3–1.9 days after the -ray burst. We fitted the rising and decaying parts of the light curve with power laws, . For the fit to the rising part we use both the non-differential photometry and the differential data (without the second-order correction), assuming a minimum error of 0.10 magnitudes. For the fit to the decaying part we only use the second-order corrected data. The Rc band light curve rises for log with exponent = 3.0 0.4 ( = 5.0/6). After the maximum (log) we find ( = 49/20). Including in the fit the non-differential data and the other differential data, i.e., without the second-order correction (assuming a minimum error of 0.10 magnitudes) gives ( = 74.6/38). Since a hint of flattening of the light curve was reported (Pedersen et al. 1997), we have also fitted a power law plus a constant, , to the decay part of the second-order corrected differential Rc band light curve. We find ; the constant corresponds to ( 43/19; note that this corresponds to in the calibration of Pedersen et al. 1997).
We also determined the optical fluence of the OT (3000 Å– 10000 Å) taking for its spectral slope = –1 or –1/3 (see Sect. 4). We find erg cm-2 (), or erg cm-2 () for the fluence collected until day 110 after the event. Extrapolating the power law decay beyond day 110 we find a total optical fluence erg cm-2 () and erg cm-2 ().
4 Broad-band optical flux distribution
Between May 9.905 UT and May 10.033 UT the Rc band flux increased by 0.137 0.014 magnitude per hour. In estimating the spectral energy distribution we corrected the May 9.9 UT observations for this brightening, i.e., we assumed that in all passbands the rate of brightening is the same, and reduced the magnitudes to a single epoch (May 9.93 UT). The May 10.98 UT observations occured at maximum light (see Fig. 1), so we have not applied any corrections. Corrections to the May 12 data were calculated using a power law fit to the decay part of the Rc band light curve (see Sect. 3). The corrections are minor ( mag) and marginally ( 0.02) affect the spectral slope.
We fitted our B, V, Rc, Ic photometry with a power law, , using the photometric calibration of Bessell (1979; table IV) (We chose to exlude the U band data to be able to compare our results directly with Sokolov et al., 1997. This exclusion does not affect the spectral slope significantly). Before the fits were made, the data were corrected for interstellar extinction AV. Using the IRAS database, we have determined the 100 m cirrus flux in the direction of the OT, 0.08 MJy sr-1 (, corresponding to 0.01 (Laureijs et al. 1989). However, to compare our results with those of Djorgovski et al. (1997) we also used their value for the interstellar extinction ( = 0.08, corresponding to their = 0.11). The effect of varying the interstellar extinction on the spectral slope is small; the maximum correction to the exponent (with respect to = 0.08) is –0.10 (for = 0). We have also taken the B, V, Rc and Ic measurements of Sokolov et al. (1997) and determined , correcting for an extinction of = 0.08. In Figure 2 we have plotted the spectral slopes as a function of time, including the results of Djorgovski et al. (1997) and Metzger et al. (1997b).
5 Discussion
The differential Rc light curve shows that deviations from a smooth power law decay are moderate (r.m.s. = 0.15 mag; lower panel in Fig. 1). The magnitude for a possible underlying galaxy is consistent with the limits derived by Sahu et al. (1997b) and Pian et al. (1997), i.e., . We note, however, that the introduction of a constant to the power law fit has not improved the substantially; we conclude that the evidence for a flattening of the light curve at late times is not yet convincing.
The optical fluence (3000Å-10000Å, ; Sect. 4), is about 5% of the BATSE 20-1000 keV and 20% of the WFC 2-26 keV GRB fluences. A similar comparison with the X-ray afterglow (Piro et al. 1997a; = 7.3 erg cm-2 2-10 keV, from an extrapolation of the X-ray light curve for 27 s) shows that the optical afterglow fluence is 20 % of the X-ray afterglow fluence.
The optical spectrum of the OT becomes redder before reaching maximum light (Fig. 2); afterwards the spectral slope remains constant. We distinguish three phases of the light curve: phase I, the rising phase (, phase II at maximum light (, and phase III, the decaying phase (. Wijers et al. (1997) give a relation between the spectral slope and the temporal slope for the simplest fireball remnant model (a forward blast wave with single Lorentz factor ; their Eq. 2) and for a ‘beamed’ fireball, i.e. and the energy per unit solid angle E are functions of angle (their Eq. 4). For phase III we find very good agreement with implying for the ‘beamed’ case (marginal agreement with for the simple case). Phases I and II are not in agreement with the simple and beamed fireball models, that predict less steep or even inverted spectral slopes . However, these early phases might be explained by a continuous distribution of Lorentz factors (Rees & Mészáros 1997). Lower (redder) material takes longer to sweep up a significant amount of external matter and hence its emission is delayed with respect to the higher (bluer) material. The lower material catches up gradually with the decelerated higher material. Hence the rise of the light curve and evolution from blue to red can be explained with building up the emission from material with lower , while the power law decay (phase III) sets in when most of the material has been mixed to a single .
6 Acknowledgments
The WHT is operated on behalf of the English PPARC and Dutch NFRA at the Spanish observatory Roque de Los Muchachos on La Palma, Spain. The 3.5m WIYN telescope at Kitt Peak National Observatory, National Optical Astronomy Observatories is operated by the Association of Universities for Research in Astronomy, Inc. (AURA) under cooperative agreement with the National Science Foundation. The WIYN Observatory is a joint facility of the University of Wisconsin-Madison, Indiana University, Yale University, and the National Optical Astronomy Observatories. T. Galama is supported through a grant by NFRA under contract 781.76.011. C. Kouveliotou acknowledges support from NASA grant NAG 5-2560. We thank the BeppoSAX team for the alert.
References
- (1) Bessell, M.S. 1979, PASP, 91, 589
- (2) Bond, H. 1997, IAU Circ., 6654
- (3) Castro-Tirado, A.J. et al. 1998, preprint, accepted for publication in Science
- (4) Chevalier, C. et al. 1997, IAU Circ., 6663
- (5) Costa, E. et al. 1997a, IAU Circ., 6533
- (6) Costa, E. et al. 1997b, IAU Circ., 6572
- (7) Costa, E. et al. 1997c, IAU Circ., 6649
- (8) Djorgovski, S.G. et al. 1997, Nature, 387, 876
- (9) Fishman, G.J. et al. 1989, in Proc. of the GRO Science Workshop, ed. W.N. Johnson, p. 2
- (10) Fruchter, A. et al. 1997, IAU Circ., 6674
- (11) Galama, T.J. et al. 1997a, Nature, 387, 479
- (12) Galama, T.J. et al. 1997b, to appear in Conf. Proc. of the 4rd Huntsville Symposium on Gamma-Ray Bursts
- (13) Garcia, M. et al. 1997, astro-ph 9710346
- (14) Groot, P.J. et al. 1997a, IAU Circ., 6584
- (15) Groot, P.J. et al. 1997b, IAU Circ., 6588
- (16) Heise. J. et al. 1997a, IAU Circ., 6610
- (17) Heise. J. et al. 1997b, IAU Circ., 6654
- (18) In ’t Zand, J. et al. 1997, IAU Circ., 6569
- (19) Jager, R., Heise, J., In ’t Zand, J., Brinkman, A.C. 1995, Adv. Space Res., 13, 315
- (20) Kelemen, J. 1997, Information Bull. Var. Star No. 4496
- (21) Kouveliotou, C., et al. 1997, IAU Circ., 6660
- (22) Landolt, A.U. 1992, AJ, 104, 340
- (23) Laureijs, R. J. 1989, PhD-thesis, Groningen University
- (24) Metzger, M.R. et al. 1997a, IAU Circ., 6588
- (25) Metzger, M.R. et al. 1997b, Nature, 387, 878
- (26) Metzger, M.R. et al. 1997c, IAU Circ., 6676
- (27) Mignoli, M. et al. 1997, IAU Circ., 6661
- (28) Natarajan, P. et al. 1997, New Astronomy, 2, 5, 461
- (29) Pedersen, H. et al. 1997, astro-ph 9710322
- (30) Pian, E. et al. 1997, astro-ph 9710334
- (31) Piro, L., Scarsi, L. and Butler, R.C. 1995, Proc. SPIE 2517, 169
- (32) Piro, L. et al. 1997a, astro-ph 9710335
- (33) Piro, L. et al. 1997b, IAU Circ., 6656
- (34) Rees, M.J., and Mészáros 1997, astro-ph 9712252
- (35) Sahu, K.C. et al. 1997a, Nature, 387, 467
- (36) Sahu, K.C. et al. 1997b, ApJ, 489, 127
- (37) Schaefer, B. et al. 1997, IAU Circ., 6658
- (38) Sokolov, V.V. et al. 1997, astro-ph 9709093
- (39) Smith, D., et al. 1997, to appear in Conf. Proc. of the 4rd Huntsville Symposium on Gamma-Ray Bursts
- (40) Takeshima, T. et al. 1997, to appear in Conf. Proc. of the 4rd Huntsville Symposium on Gamma-Ray Bursts
- (41) Van Paradijs, J. et al. 1997, Nature, 368, 686
- (42) Wijers, R.A.M.J., Rees, M.J., and Mészáros 1997, MNRAS, 288, L51


| Date (UT) | Telescope | U | B | V | Rc | Ic |
|---|---|---|---|---|---|---|
| May 9.20 | WIYN | 21.250.05 | ||||
| May 9.93 | WHT PF | 20.610.25 | 21.050.05 | 20.880.05 | 20.490.18 | |
| May 10.03 | WHT PF | 20.460.05 | ||||
| May 10.98 | WHT PF | 19.750.25 | 20.700.08 | 20.190.05 | 19.920.05 | 19.610.30 |
| May 11.01 | WHT PF | 19.770.07 | ||||
| May 12.03 | WHT PF | 19.970.25 | 21.210.08 | 20.710.05 | 20.300.07 | 19.890.18 |
| May 22.97 | WHT AUX | 22.040.07 | ||||
| July 4.19 | WHT AUX | 23.950.20 | ||||
| Aug 26.9 | WHT PF | 24.570.07 |