The radio properties of radio-quiet quasars
Abstract
Although radio-quiet quasars (RQQs) constitute of optically-identified quasar samples their radio properties are only poorly understood. In this paper we present the results of a multi-frequency VLA study of 27 low-redshift RQQs. We detect radio emission from 20 objects, half of which are unresolved (). In cases where significant structure can be resolved, double, triple and linear radio sources on scales of a few kpc are found. The radio emission (typically) has a steep spectrum (, where ), and high brightness temperatures ( K) are measured in some of the radio components. The RQQs form a natural extension to the radio luminosity - absolute magnitude distribution of nearby Seyfert 1s. We conclude that a significant fraction of the radio emission in RQQs originates in a compact nuclear source directly associated with the quasar. There are no significant differences between the radio properties of RQQs with elliptical hosts and those in disc galaxies within the current sample.
keywords:
galaxies: active – quasars: general – radio continuum: galaxies1 Introduction
Shortly after their initial identification in 1963 by Schmidt it became clear that less than 10% of quasars are strong sources of radio emission. The gap in the quasar radio luminosity function is extremely pronounced, with only a handful of objects occupying the region between quasars which are radio-loud and those which are radio-quiet (Kellermann et al. 1989; Miller, Peacock & Mead 1990; Miller, Rawlings & Saunders 1993, henceforth MRS93), and it is now widely accepted that there are two distinct populations of quasar.
However, from m through to soft X-ray wavelengths the properties of radio-loud and radio-quiet quasars (RLQs and RQQs respectively) are generally very similar, to the extent that to first order an RLQ spectrum can be considered to be the spectrum of an RQQ with the addition of a strong power-law component in the radio. The presence or absence of this radio component must be a fundamental indicator of the processes occurring in the quasar, but there is still no consensus as to exactly what it signifies.
Studies of less luminous, nearby active galaxies have shown that the radio-loud objects (ie Radio Galaxies) are invariably elliptical systems whereas the radio-quiets (Seyferts) tend to be spirals, suggesting that some property of gas-rich disc galaxies inhibits the formation of large, powerful radio sources (see Osterbrock 1991). Two factors have encouraged the extension of this result to the higher redshifts and larger nuclear luminosities typical of quasars: the success of Unified Schemes which link Radio Galaxies and RLQs via beaming effects and viewing angle (see Urry & Padovani 1995) and the established fact that Seyfert 1 nuclei and RQQs form a continuous sequence in terms of their optical luminosities and have identical emission line characteristics (see Osterbrock 1991, Antonucci 1993).
However, recent advances in ground- and space-based observing have allowed the host galaxies of nearby quasars to be imaged and reliably classified for the first time. The results have shown that not all RQQs lie in disc systems but that as many as 50% might be found in elliptical hosts (eg Taylor et al. 1996, Disney et al. 1995, Lacy, Rawlings & Hill 1992, Véron-Cetty & Woltjer 1990). Indeed, there is some evidence that elliptical galaxies might account for all of the most optically luminous RQQs (Taylor et al. 1996). Clearly the simple ‘radio-loud elliptical, radio-quiet disc’ picture can no longer be supported, and it has become more important than ever to determine in what respects radio-quiet quasars are different from their radio-loud counterparts. Unfortunately, the most obvious wavelength regime in which they differ - the radio - is also the regime in which least is known about the properties of RQQs. Most radio surveys of optically-selected quasar samples have lacked the sensitivity to detect the radio-quiet objects, and the few high-sensitivity surveys have tended to give only fluxes at a single frequency, with only limited information on radio structure and spectral index.
Like Seyferts, RQQs are not radio silent and with sensitivities at the milliJansky level modern multi-element synthesis telescopes can easily detect the radio emission from many of the nearer () objects. In this paper we present the results of a multi-frequency, high-resolution radio survey of low-redshift (), low-luminosity (M) RQQs using the Very Large Array (VLA) in its high-resolution A-configuration. The aim of this work was to search for compact, non-thermal radio sources associated with the quasars, to determine their properties and to compare them with those of radio-loud objects.
As well as our own observations, we also make use of data from the literature. Our RQQ sample comprises 27 objects, 19 of which have already been observed with A-array at 4.8 GHz by Kellermann et al. (1989) as part of their radio study of the Bright Quasar Survey (BQS; Schmidt & Green 1983, Green, Schmidt & Liebert 1986). We have observed all 27 RQQs at 1.4 GHz and completed the coverage of the sample at 4.8 GHz with observations of the 8 non-BQS quasars. In addition we obtained 8.4-GHz maps for 21 objects.
Seventeen of the RQQs in our sample were also included in a major investigation into quasar host galaxies (Dunlop et al. 1993, Taylor et al. 1996). We use these objects to investigate the relationship between the host and the ‘radio loudness’ of the quasar and refer to them as our ‘host galaxy subsample’.
Two objects (PG 0007106 & 1635119) have unusually large radio luminosities and arguably are not true radio-quiet quasars but belong to a separate class of their own. We use the term ‘radio-intermediate quasar’ (RIQ) to describe these.
The paper is structured as follows. Data acquisition and reduction are discussed in Section 2, followed by a description of the resulting radio images in Section 3. Section 4 of the paper summarises the debate over the origin of non-thermal radio emission in RQQs and Section 5 explores the implications of the current observations, and compares the RQQ emission with the radio properties of other types of active galactic nuclei (AGN). In Section 6 we examine the relationship between the radio properties of the 17 RQQs in our host galaxy subsample and the properties of the hosts themselves, and our conclusions are summarised in Section 7. We assume kms-1Mpc-1 and throughout.
2 Observations and data reduction
In order to build up a picture of RQQ radio emission over a range of frequencies, snapshot observations were made with the VLA in A-configuration at 1.4, 4.8 and 8.4 GHz (, and bands respectively).
Many of the objects in our sample have already been observed at one or more of these frequencies as part of previous surveys and we make use of these data in the current study.
All of the Palomar-Green (PG) objects were observed at 4.8 GHz with the VLA in both D- and A-configurations as part of the BQS (November 1983, Kellermann et al. 1989; June 1991, MRS93). PG 0050+124 (I Zw 1) was observed in A-configuration at 8.4 GHz (July 1991, Kukula et al. 1995) as part of the CfA Seyfert sample.
We also include additional data at 1.4 GHz for three quasars (PG 0007+106, PG 0026+129 & PG 0052+251). These maps have been presented previously in Philip Miller’s PhD thesis (Miller 1992), and we publish them here with his permission. The observations were made in August 1991.
Our own 1.4- and 8.4-GHz observations were made with A-configuration in December 1992 and July 1995. 4.8-GHz observations were made of the eight non-PG quasars in July 1995. Table 1 lists the observing dates for all 27 objects at each frequency to allow an assessment of the potential impact of any source variability on the individual flux measurements.
Data reduction followed the usual procedure within aips. Two 50-MHz IF channels were used and the flux densities were calibrated relative to 3C48, to give an estimated flux uncertainty of 5% in the final maps. A natural weighting scheme was used for the Fourier transform, giving noise levels in the final maps of 300, 80 and 60 Jy beam-1 at 1.4, 4.8 and 8.4 GHz respectively and synthesized beamwidths of 1.4, 0.4 and 0.24′′ (FWHM). Self-calibration was used on the brightest sources. We estimate the positional information in the high-resolution 8.4-GHz maps to be accurate to within mas.
| Object | 1.4 GHz | 4.8 GHz | 8.4 GHz |
|---|---|---|---|
| PG 0007+106 | 08/91∗ | 11/83 | 07/95 |
| PG 0026+129 | 08/91∗ | 11/83 | – |
| 0046+112 | 12/92 | 07/95 | 07/95 |
| PG 0050+124 | 07/95 | 07/95 | 07/91 |
| PG 0052+251 | 08/91∗ | 11/83 | 12/92 |
| 0054+144 | 12/92 | 07/95 | 07/95 |
| PG 0157+001 | 12/92 | 11/83 | 12/92 |
| 0244+194 | 12/92 | 07/95 | 07/95 |
| 0257+024 | 12/92 | 07/95 | 07/95 |
| PG 0804+761 | 12/92 | 11/83 | 12/92 |
| PG 0921+525 | 12/92 | 11/83 | 12/92 |
| PG 0923+201 | 07/95 | 11/83 | 07/95 |
| PG 0953+414 | 12/92 | 06/91 | 07/95 |
| PG 1012+008 | 12/92 | 11/83 | 12/92 |
| PG 1116+215 | 12/92 | 11/83 | 12/92 |
| PG 1149110 | 12/92 | 11/83 | – |
| PG 1211+143 | 12/92 | 11/83 | – |
| PG 1402+261 | 12/92 | 11/83 | – |
| PG 1440+356 | 12/92 | 11/83 | – |
| 1549+203 | 12/92 | 07/95 | 07/95 |
| PG 1612+261 | 12/92 | 11/83 | 12/92 |
| PG 1613+658 | 12/92 | 11/83 | 12/92 |
| 1635+119 | 12/92 | 07/95 | 07/95 |
| PG 1700+518 | 12/92 | 11/83 | 12/92 |
| PG 2130+099 | 12/92 | 11/83 | 12/92 |
| 2215037 | 12/92 | 07/95 | 07/95 |
| 2344+184 | 12/92 | 07/95 | 07/95 |
| Object | Optical position (B1950) | Alternative names | |||
|---|---|---|---|---|---|
| RA h m s | Dec | ||||
| PG 0007+106 | 0.089 | 15.40 | 00 07 56.74 | +10 41 48.3 | III Zw 2 |
| PG 0026+129 | 0.142 | 15.41 | 00 26 38.07 | +12 59 29.6 | |
| 0046+112 | 0.280 | 17.10 | 00 46 55.50 | +11 12 06.1 | PHL850 |
| PG 0050+124 | 0.061 | 14.03 | 00 50 57.8 | +12 25 20.0 | I Zw 1 |
| PG 0052+251 | 0.154 | 15.90 | 00 52 11.10 | +25 09 23.8 | |
| 0054+144 | 0.171 | 15.71 | 00 54 31.95 | +14 29 58.4 | PHL909 |
| PG 0157+001 | 0.164 | 15.69 | 01 57 16.30 | +00 09 09.5 | Mrk 1014 |
| 0244+194 | 0.176 | 16.66 | 02 44 51.70 | +19 28 23.8 | MS 02448+19 |
| 0257+024 | 0.115 | 16.10 | 02 57 53.91 | +02 29 00.8 | US3498 |
| PG 0804+761 | 0.100 | 15.15 | 08 04 35.4 | +76 11 32 | |
| PG 0921+525 | 0.035 | 16.0 | 09 21 44.40 | +52 30 07.8 | Mrk 110 |
| PG 0923+201 | 0.190 | 15.83 | 09 23 05.81 | +20 07 07.2 | Ton 1057 |
| PG 0953+414 | 0.239 | 15.55 | 09 53 48.31 | +41 29 58.2 | K 438-7 |
| PG 1012+008 | 0.185 | 15.85 | 10 12 20.78 | +00 48 33.0 | |
| PG 1116+215 | 0.177 | 15.04 | 11 16 30.1 | +21 35 43 | |
| PG 1149110 | 0.049 | 15.46 | 11 49 30.28 | 11 05 42.4 | |
| PG 1211+143 | 0.085 | 14.63 | 12 11 44.86 | +14 19 53.1 | |
| PG 1402+261 | 0.164 | 15.82 | 14 02 59.28 | +26 09 51.8 | Mrk 478 |
| PG 1440+356 | 0.077 | 14.58 | 14 40 04.55 | +35 39 07.4 | |
| 1549+203 | 0.250 | 16.50 | 15 49 49.41 | +20 22 56.6 | 1E15498+203, LB906, MS 15498+20 |
| PG 1612+261 | 0.131 | 15.41 | 16 12 08.72 | +26 11 46.7 | Ton 0256 |
| PG 1613+658 | 0.129 | 15.49 | 16 13 36.24 | +65 50 37.5 | Mrk 876 |
| 1635+119 | 0.146 | 16.50 | 16 35 25.90 | +11 55 46.4 | MC 2 |
| PG 1700+518 | 0.290 | 15.43 | 17 00 13.36 | +51 53 36.2 | |
| PG 2130+099 | 0.063 | 14.64 | 21 30 01.18 | +09 55 01.1 | II Zw 136 |
| 2215037 | 0.241 | 17.20 | 22 15 11.70 | 03 47 50.2 | MS 2215203, EX2215037 |
| 2344+184 | 0.138 | 15.9 | 23 44 53.30 | +18 28 18.0 | E2344+184 |
3 Results
Table 2 lists the redshifts, magnitudes and optical positions for the objects in the current sample. Of the 27 RQQs 20 were detected at 1.4 GHz. Half of the detected RQQs are unresolved point sources at all three frequencies, but ten objects (PG 0007+106, PG 0026+129, PG 0052+251, PG 0157+001, PG 0804+761, PG 0921+525, PG 1612+261, 1635+119, PG 1700+518 and PG 2130+099) show evidence for extended structure on arcsecond scales. Maps of eight of these sources are shown in Figures 1 & 2 with contour levels listed in Table 3. PG 0804+761 is known to possess a double radio source at 4.8 GHz (MRS93) but the current maps at 1.4 and 8.4 GHz show only the brightest of the two components. Gower & Hutchings (1984) list 1635+119 as an extended double source, but we detect only the unresolved core component with the current observations.
The radio positions of the detected RQQs, determined from 2D Gaussian fits to the high-resolution 8.4-GHz images (or from the 1.4-GHz images when the object was not observed in -band), are given in Table 4 along with the total flux densities of each distinct radio component, again determined from a 2-D Gaussian fit. Sources of error in these flux values include calibration uncertainties of order , but the major contributor is usually the rms noise in the final map. In the case of non-detections, upper limits are given. Table 5 lists the derived radio luminosities, radio source sizes and brightness temperatures.
Table 4 also lists spectral indices, (where ), for each radio component, calculated between 1.4, 4.8 and 8.4 GHz. The 4.8-GHz fluxes listed by MRS93 are peak values, but these will only differ from the total flux when the radio component is significantly resolved.
Two further caveats apply here. The first is that the A-array beam decreases in size with increasing frequency. The VLA therefore becomes less sensitive to extended radio emission at higher frequencies (the fact that such emission usually has a steep spectrum will exacerbate this problem). Consequently there is the possibility that faint, diffuse emission which is included in the larger beam at low frequencies might be resolved out at higher frequencies when the smaller beam of the array is only sensitive to compact structures. This would have the effect of making the radio spectrum appear steeper than it actually is. However, even at 8.4 GHz, A-array remains sensitive to extended emission on angular scales of up to 7′′. This is much larger than the synthesized beam at 1.4 GHz (1.4′′) and, in practice, we find that the 1.4-GHz emission from our RQQs is unresolved in almost every case. It therefore seems reasonable to conclude that the amount of diffuse emission picked up at 1.4 GHz but resolved out at 8.4 GHz is unlikely to be significant (ie ‘aperture corrections’ are not required).
More seriously, observations at different frequencies were often separated by a period of several years (see Table 1), during which the radio brightness of the RQQ may have varied considerably. Hence the most reliable spectral indices are those derived from measurements which were made concurrently - in most cases this will be the value derived between 1.4 and 8.4 GHz ( in Table 4).


| Object | Base | Contour levels ( base) |
|---|---|---|
| PG 0007+106 | -1, 1, 2, 4, 8, 16, 32,64, 128 | |
| PG 0026+129 | -1, 1, 1.5, 2, 2.5, 3, 3.5 | |
| PG 0052+251 | -1, 1, 1.5, 2, 2.5 | |
| PG 0157+001 | 1, 2, 4, 8, 16 | |
| PG 0921+525 | 1, 1.5, 2.2, 3.5, 5.5, 7, 8 | |
| PG 1612+261 | 1, 1.5, 2.5, 3.5, 4.5, 5.5 | |
| PG 1700+518 | 1, 2, 4, 8 | |
| PG 2130+099 | 1, 1.5, 2, 3, 4, 5 |
3.1 Notes on individual objects
PG 0007+106. This is the most radio-luminous object in the current sample and is classed as a ‘radio-intermediate quasar’ by MRS93 and Falcke, Sherwood & Patnaik (1996), rather than a true RQQ. Since none of the three flux measurements in Table 4 were made concurrently the precise values of the spectral indices must be treated with caution, but the spectrum appears to be inverted. The source is known to be variable at both radio and optical wavelengths (eg Schnopper et al. 1978, Teräsranta et al. 1992). A comparison of our December 1992 1.4-GHz data with the August 1991 map by Miller shows that the flux of the core component has declined from 155.9 mJy to 102.0 mJy over 16 months. The diffuse radio component 15′′ (33 kpc) SW of the quasar in the 1.4-GHz map (Figure 1) was first detected by Unger et al. (1987) and its flux density appears to have remained constant at 8 mJy between 1983 and 1991. This component does not appear at 4.8 or 8.4 GHz, indicating a steep spectrum.
PG 0026+129. Due to problems on some of the shorter baselines the noise in our 1.4-GHz map is relatively high and no radio source is detected. However, Miller’s deeper map of this object shows a 2-mJy nuclear radio component with an extension (6.5 kpc) to the south (Figure 1). MRS93 failed to detect any radio emission at 4.8 GHz and the object was not observed at 8.4 GHz.
PG 0050+124. I Zw 1 is one of the nearest objects in our sample () and is often classed as a Seyfert 1 rather than an RQQ (see Section 5.5). As such it was observed with A-array at 8.4 GHz by Kukula et al. (1995) as part of their radio survey of the CfA Seyfert sample and we quote their radio position and flux measurement in Table 4. The radio source is unresolved at all three frequencies, suggesting a physical size of kpc. Using VLBI techniques at 2295 MHz Roy et al. (1994) placed an upper limit of 0.1′′ on the angular size of the radio source, implying a brightness temperature K. The simultaneous flux measurements at 1.4 and 4.8 GHz give the most reliable estimate of the spectral slope, which appears to be steep ().
PG 0052+251. Our simultaneous flux measurements at 1.4 and 8.4 GHz in December 1992 show that PG 0052+251 has a relatively flat radio spectrum (). There is also some evidence for variability in this source: the flux measured by MRS93 at 4.8 GHz nine years earlier is significantly lower than the value predicted by the spectral index. Miller’s slightly deeper 1.4-GHz observations in August 1991 show marginal evidence for extended emission to the south of the nucleus (Figure 1).
PG 0157+001. Although unresolved in our 1.4 GHz map, this object appears as a (7 kpc) double source in both the 4.8-GHz map of MRS93 and our new 8.4 GHz map (Figure 2). The two radio components lie on either side of the optical nucleus, in the same PA as the 10-arcsec [Oiii] emission-line structure reported by Stockton & MacKenty (1987).
PG 0804+761. MRS93 and Kellermann et al. (1994) detect a (2.5 kpc) double radio source at 4.8 GHz, but only the brighter, northern component is visible in our 8.4-GHz image. From this we can infer that the southern component either has a steep spectrum () or that it exhibits variability. Due to the uncertainty in the optical position it is not clear which, if any, of the components is associated with the quasar nucleus. At 1.4 GHz the double source cannot be resolved. Kellermann et al. (1994) speculate that an 11-mJy elongated source 107′′ to the north in their 4.8-GHz D-array map might also be associated with the quasar, but at a projected distance of 263 kpc we consider the possibility to be unlikely and do not consider it further in the current work.
PG 0921+525. The 4.8-GHz images of MRS93 and Kellermann et al. (1994) show a bright nuclear component from which a highly-curved jet-like feature extends, initially to the NW. In our high-resolution 8.4-GHz image we detect only the central source, implying a steep spectrum () for the components in the ‘jet’, but our 1.4-GHz map reveals a (3 kpc) double source lying in PA (Figure 1). All of the structure reported by MRS93 and Kellermann et al. lies within the brighter, southern component of the 1.4-GHz double.
PG 1012+008. We derive a steep spectrum () for this object between 1.4 and 8.4 GHz consistent with the results of Barvainis et al. (1996) (). However, we note that Barvainis et al. also found evidence for a high-frequency turnover in the spectrum at 15 GHz.
PG 1116+215. We detect an unresolved ( kpc) nuclear component in this object, although we note that the D-array map by Kellermann et al. (1994) also shows several radio sources 1 arcminute ( kpc) to the north and west.
PG 1149110. At 8.4-GHz we detect an unresolved component coincident with the optical quasar. The weak extensions visible in the 4.8-GHz image by MRS93 are almost certainly artifacts, as the authors suggest.
PG 1612+261. This object possesses the most interesting radio structure of all the RQQs in the current sample (Figure 2). At 4.8 GHz MRS93 found a bright, elongated radio component associated with the optical nucleus, along with more diffuse emission extending (3 kpc) in PA . Our 8.4-GHz map reveals this structure in more detail: the nuclear component is resolved into a 0.5-arcsec double source lying in the same PA as the extended emission. The structure as a whole is approximately four times longer than it is wide and arguably could be described as a one-sided jet according to the criteria of Bridle & Perley (1984) (the optical nucleus lies at the eastern end of the radio structure). Overall, the radio source has a steep spectrum, consistent with the radio jets observed in RLQs and in some nearby Seyfert nuclei.
1635+119. Like PG 0007+106, the large radio luminosity and flat spectrum of this unresolved point source places it in the category of radio-intermediate quasars (RIQs). Gower & Hutchings (1984) report a second radio component ( kpc) south of the radio core, which they claim to be a hotspot in a lobe associated with the quasar.
PG 1700+518. Although unresolved at 1.4 GHz, this BAL quasar appears as a (5.4 kpc) double source in both the 4.8 GHz image of MRS93 and the current 8.4 GHz map (Figure 2). Both components are slightly resolved; by comparing the peak flux densities at 4.8 and 8.4 GHz (2.2, 1.6 mJy beam-1 and 2.0, 1.3 mJy beam-1 respectively) we find that the eastern component has a slightly flatter spectrum than its neighbour ( respectively). Barvainis et al. (1996) report a steep, straight spectrum () in this object, but their measurements were made with C-array and they would not have been able to separate the emission from the two components. However, Kellermann et al. (1994) do resolve the double structure at 15 GHz (with a beamsize of ) and report that the eastern source is brighter at this frequency and consists of an unresolved component. Although the nominal position of the optical QSO (Véron-Cetty & Véron 1993, marked by a cross in Figure 1) lies somewhere between the radio components, a revised position (Hutchings, Neff & Gower 1992) is coincident with the eastern source to well within the positional errors, suggesting that this is the synchrotron self-absorbed core of the quasar.
PG 2130+099. This is a triple radio source with a bright central component which is coincident with the optical nucleus, straddled by two steep-spectrum lobes in PA (Figure 2). The overall extent of the structure is , equivalent to a projected linear size of kpc. The extension to the SW of the nuclear component is probably the result of phase or amplitude errors which could not be removed because the object was too weak for self-calibration; it does not appear in the 4.8 GHz map of MRS93 even though the two radio lobes are clearly visible. However, we note that this feature is perpendicular to the triple source and lies in the same PA as the major axis of the host galaxy (Taylor et al. 1996) and therefore might be associated either with the galaxy itself or with the structure which is responsible for defining the axis of the triple source. The A-array beam at 1.4 GHz is too large to resolve the individual radio components but the source is slightly extended along the axis of the triple structure. We find no evidence for any extensions in the direction of the host galaxy major axis at this frequency.
| Object | Radio position (B1950) | Spectral index | ||||||
| RA | Dec | mJy | mJy | mJy | ||||
| PG 0007+106 | 00 07 56.725 | +10 41 48.26 | 0.0 | -1.8 | -0.6 | |||
| 00 07 55.82 | +10 41 40.3 (L) | – | – | – | – | |||
| PG 0026+129 | 00 26 38.05 | +12 59 29.6 (L) | – | – | – | – | ||
| 00 26 38.05 | +12 59 27.9 (L) | – | – | – | – | |||
| 0046+112 | 00 46 55.435 | +11 12 05.98 | 0.5 | 1.2 | 0.7 | |||
| PG 0050+124 | 00 50 57.77† | +12 25 19.21† | † | 0.7 | 1.8 | 1.0 | ||
| PG 0052+251 | 00 52 11.044 | +25 09 24.05 | 0.7 | -0.8 | 0.3 | |||
| 0054+144 | 00 54 31.960 | +14 29 57.65 | 0.7 | 0.2 | 0.6 | |||
| PG 0157+001 | 01 57 16.33 | +00 09 09.8 (L) | ‡ | ‡ | 1.0 | 0.6 | 0.7 | |
| 01 57 16.336 | +00 09 09.82 | – | – | 0.7 | – | |||
| 01 57 16.263 | +00 09 10.00 | – | – | 0.2 | – | |||
| 0244+194 | …………. | …………. | – | – | – | |||
| 0257+024 | 02 57 53.901 | +02 28 59.77 | 0.4 | 0.8 | 0.5 | |||
| PG 0804+761 | 08 04 35.581 | +76 11 32.60 | 0.2 | 0.8 | 0.4 | |||
| PG 0921+525 | 09 21 44.378 | +52 30 07.55 | 0.9 | 0.2 | 0.7 | |||
| 09 21 44.43 | +52 30 10.0 (L) | 1.0 | – | – | ||||
| PG 0923+201 | …………. | …………. | – | – | – | |||
| PG 0953+414 | …………. | …………. | – | – | – | |||
| PG 1012+008 | 10 12 20.797 | +00 48 33.55 | 0.9 | 0.8 | 0.9 | |||
| PG 1116+215 | 11 16 30.122 | +21 35 43.00 | 0.8 | 0.7 | 0.8 | |||
| PG 1149110 | 11 49 30.326 | 11 05 42.75 | 0.8 | -0.1 | 0.5 | |||
| PG 1211+143 | …………. | …………. | – | – | – | – | ||
| PG 1402+261 | 14 02 59.28 | +26 09 52.7 (L) | – | 0.7 | – | – | ||
| PG 1440+356 | 14 40 04.56 | +35 39 07.2 (L) | – | – | – | – | ||
| 1549+203 | …………. | …………. | – | – | – | |||
| PG 1612+261 | 16 12 08.69 | +26 11 46.2 (L) | – | ‡ | – | – | 0.9 | |
| 16 12 08.727 | +26 11 46.60 | – | – | – | – | – | ||
| 16 12 08.704 | +26 11 46.45 | – | – | 1.8 | – | |||
| 16 12 08.664 | +26 11 46.30 | – | – | – | – | – | ||
| PG 1613+658 | 16 13 36.236 | +65 50 37.75 | 1.1 | -1.0 | 0.4 | |||
| 1635+119 | 16 35 25.846 | +11 55 45.70 | 0.005 | -0.06 | -0.02 | |||
| PG 1700+518 | 17 00 13.32 | +51 53 36.4 (L) | ‡ | ‡ | 1.5 | -0.2 | 0.9 | |
| 17 00 13.286 | +51 53 36.20 | – | – | -0.3 | – | |||
| 17 00 13.389 | +51 53 36.15 | – | – | -0.1 | – | |||
| PG 2130+099 | 21 30 01.16 | +09 55 01.1 (L) | ‡ | ‡ | 2.9 | 1.1 | 1.8 | |
| 21 30 01.176 | +09 55 00.95 | – | 0.6 | |||||
| 21 30 01.112 | +09 55 01.80 | – | – | 1.2 | – | |||
| 21 30 01.203 | +09 55 01.30 | – | – | 2.4 | – | |||
| 2215037 | …………. | …………. | – | – | – | |||
| 2344+184 | …………. | …………. | – | – | – | |||
| ⋆ 1.4 GHz measurements taken from the August 1991 observations by Miller. Additional 1.4 GHz measurements from | ||||||||
| December 1992: PG 0007+106, mJy; PG 0026+129, mJy; PG 0052+251, mJy. | ||||||||
| ∗ 4.8 GHz peak flux densities taken from MRS93. Uncertainties are typically 0.2 mJy. | ||||||||
| † 8.4 GHz measurement taken from Kukula et al. (1995). | ||||||||
| ‡ Total flux density (sum of the individual components). | ||||||||
| Object | Max. extent | Radio | log10(Lradio) (W Hz-1) | Brightness temperature (K) | |||||
| ′′ | kpc | morph. | 1.4 GHz | 4.8 GHz | 8.4 GHz | beam | Deconvolved | ||
| PG 0007+106 | 23.24 | 15.0 | 33.4 | CL | 24.49 | 24.68 | 25.12 | ||
| 23.39 | – | 23.14 | – | – | |||||
| PG 0026+129 | 24.24 | 2.0 | 6.5 | D | 23.32 | 22.55 | – | – | – |
| 23.10 | 22.55 | – | – | – | |||||
| 0046+112 | 24.03 | 0.24 | 1.3 | P | 23.81 | 23.52 | 23.23 | ||
| PG 0050+124 | 23.82 | 0.24 | 0.4 | P | 22.96 | 22.59 | 22.14 | ||
| PG 0052+251 | 23.93 | 1 | 3.5 | CJ? | 23.15 | 22.65 | 22.84 | ||
| 0054+144 | 24.34 | 0.24 | 0.9 | P | 23.37 | 22.97 | 22.92 | ||
| PG 0157+001 | 24.27 | 2.0 | 7.3 | D | 24.48 | 23.94‡ | 23.77‡ | – | – |
| – | 23.87 | 23.69 | |||||||
| – | 23.08 | 23.02 | |||||||
| 0244+194 | 23.46 | – | – | – | 23.47 | 22.53 | 22.44 | – | – |
| 0257+024 | 23.09 | 0.24 | 0.7 | P | 23.50 | 23.29 | 23.10 | ||
| PG 0804+761 | 23.74 | 1.0 | 2.5 | D | 22.75 | 22.63 | 22.44 | ||
| PG 0921+525 | 20.61 | 3.0 | 2.9 | D | 22.49 | 22.00 | 21.95 | ||
| 21.95 | 21.42 | 20.80 | – | – | |||||
| PG 0923+201 | 24.45 | – | – | – | 22.84 | 22.76 | 22.38 | – | – |
| PG 0953+414 | 25.23 | – | – | – | 22.97 | 22.79 | 22.72 | – | – |
| PG 1012+008 | 24.38 | 0.24 | 1.0 | P | 23.58 | 23.10 | 22.90 | ||
| PG 1116+215 | 25.09 | 0.24 | 0.9 | P | 23.90 | 23.46 | 23.29 | ||
| PG 1149110 | 21.88 | 0.24 | 0.3 | P | 22.50 | 22.09 | 22.11 | ||
| PG 1211+143 | 23.91 | – | – | – | 23.02 | 22.38 | – | – | – |
| PG 1402+261 | 24.14 | 0.4 | 1.5 | P | 23.10 | 22.73 | – | – | – |
| PG 1440+356 | 23.74 | 0.4 | 0.8 | P | 23.01 | 22.31 | – | – | – |
| 1549+203 | 24.38 | – | – | – | 23.50 | 22.82 | 22.71 | – | – |
| PG 1612+261 | 24.07 | 1.0 | 3.1 | CJ | 24.10 | – | 23.41‡ | – | – |
| – | – | 22.67 | |||||||
| – | 23.15 | 22.73 | |||||||
| – | – | 22.37 | |||||||
| PG 1613+658 | 23.95 | 0.24 | 0.7 | P | 23.33 | 22.76 | 23.00 | ||
| 1635+119 | 23.21 | 53.0 | 175.0 | CL | 24.15 | 24.12 | 24.16 | ||
| PG 1700+518 | 25.77 | 1.0 | 5.4 | D | 24.97 | 24.18‡ | 24.23‡ | – | – |
| – | 23.95 | 24.02 | |||||||
| – | 23.79 | 23.82 | |||||||
| PG 2130+099 | 23.25 | 2.5 | 4.1 | T | 24.05 | 22.48‡ | 22.24‡ | – | – |
| – | 22.22 | 22.07 | |||||||
| – | 21.84 | 21.57 | |||||||
| – | 21.84 | 21.27 | |||||||
| 2215037 | 23.60 | – | – | – | 24.58 | 22.98 | 23.10 | – | – |
| 2344+184 | 23.69 | – | – | – | 23.84 | 22.28 | 22.58 | – | – |
| ‡ Total radio luminosity. | |||||||||
4 The origin of the radio emission in RQQs
In this section we describe various models to explain the compact nuclear radio emission in RQQs and discuss the ways in which they can be distinguished observationally.
Kellermann et al. (1989), in their radio survey of the BQS quasars, compare the total flux at 4.8 GHz (measured with D-array with a resolution of ) with the flux of the central clean component in their high-resolution ( FWHM) A-array maps. Taking the average value of this ratio for the radio-quiet BQS objects reveals that the central component accounts for 72% of the total radio emission from the quasar. In other words almost three quarters of the total radio luminosity of an RQQ comes from a very small ( arcsec) region in the nucleus of the host galaxy.
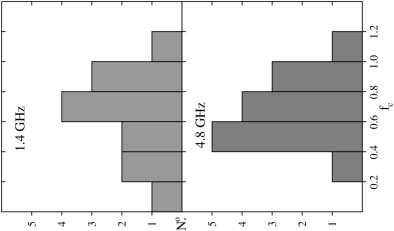
The current observations were all made with the high-resolution A-configuration of the VLA and are therefore more sensitive to the compact nuclear radio sources than to diffuse emission from the rest of the host galaxy. In Table 6 we list the total and compact radio fluxes of all the RQQs in our sample at both 1.4 and 4.8 GHz. In this case the ‘compact’ flux refers to all of the emission detected in our A-array maps with FWHM beam sizes of 1.4′′ and 0.4′′ at 1.4 GHz and 4.8 GHz respectively. In the case of PG 1612+261 we do not have a measured flux at 4.8 GHz for the extended structure in the A-array map (MRS93 give only the peak value) so we have extrapolated from the flux at 1.4 GHz using the measured spectral index of . The ‘total’ fluxes are D-array measurements taken from the literature or downloaded from the Internet. At 1.4 GHz we used frames taken from the NRAO/VLA Sky Survey (NVSS; Condon et al. 1996) with a beam size of (38-220 kpc for 0.035-0.3). The 4.8-GHz fluxes are from Kellermann et al. (1989) and have a beam size of (17-99 kpc for 0.035-0.3). The ratio, , of the compact to the total radio emission is given at each frequency. The average values for are 0.67 and 0.64 at 1.4 and 4.8 GHz respectively - demonstrating that the majority of the total radio emission from the RQQ comes from the compact features in the nucleus rather than the body of the host galaxy. The distribution of shows this more clearly (Figure 3). It should be noted that no attempt has been made to correct for any variability in the intrinsic radio luminosity of the quasar between the dates of the D- and A-array measurements.
| 1.4-GHz flux (mJy) | 4.8-GHz flux (mJy) | |||||
|---|---|---|---|---|---|---|
| D | A | D | A | |||
| Source | Array | Array | fc | Array | Array | fc |
| PG 0007+106 | 100.1 | 102.0 | 1.02 | 321.00 | 155.00 | 0.48 |
| PG 0026+129 | 7.6 | 3.8 | 0.50 | 5.10 | 0.40 | – |
| 0046+112 | 1.2 | 1.7 | – | – | 0.9 | – |
| PG 0050+124 | 9.0 | 5.1 | 0.57 | 2.60 | 2.4 | 0.92 |
| PG 0052+251 | – | 1.4 | – | 0.74 | 0.46 | 0.62 |
| 0054+144 | 2.4 | 1.8 | 0.75 | – | 0.73 | – |
| PG 0157+001 | 27.4 | 24.7 | 0.90 | 8.00 | 7.00 | 0.88 |
| 0244+194 | 1.1 | 1.9 | – | – | 0.2 | – |
| 0257+024 | 5.7 | 5.5 | 0.96 | – | 3.4 | – |
| PG 0804+761 | 3.4 | 1.3 | 0.38 | 2.38 | 1.00 | 0.42 |
| PG 0921+525 | 10.4 | 7.5 | 0.72 | 3.80 | 2.4 | 0.63 |
| PG 0923+201 | 1.1 | 0.4 | – | 0.25 | 0.36 | – |
| PG 0953+414 | 4.7 | 2.5 | – | 1.90 | 0.20 | – |
| PG 1012+008 | – | 2.4 | – | – | 0.80 | – |
| PG 1116+215 | – | 5.6 | – | 2.80 | 2.01 | 0.72 |
| PG 1149110 | 10.5 | 3.1 | 0.30 | 2.60 | 1.20 | 0.46 |
| PG 1211+143 | – | 3.3 | – | 157.00 | 0.75 | – |
| PG 1402+261 | 13.8 | 1.1 | 0.08 | 0.62 | 0.45 | 0.73 |
| PG 1440+356 | 5.1 | 3.9 | 0.76 | 1.66 | 0.78 | 0.45 |
| 1549+203 | – | 1.0 | – | – | 0.22 | – |
| PG 1612+261 | 18.6 | 16.0 | 0.86 | 5.07 | 5.30 | 1.04 |
| PG 1613+658 | 4.2 | 3.0 | 0.71 | 3.03 | 0.82 | 0.27 |
| 1635+119 | – | 16.3 | – | – | 15.3 | – |
| PG 1700+518 | – | 23.2 | – | 7.20 | 3.8 | 0.53 |
| PG 2130+099 | – | 58.2 | – | 2.05 | 1.67 | 0.81 |
| 2215-037 | – | 11.1 | – | – | 0.28 | – |
| 2344+184 | 1.0 | 7.3 | – | – | 0.20 | – |
Clearly the nuclear emission contributes a significant, often dominant, fraction of the total radio luminosity of the RQQ. Whatever process is responsible for these compact components must be capable of producing large amounts of radio emission - comparable to the amount produced by the rest of the galaxy - within a region less than a kiloparsec across.
The radio sources in radio-loud AGN consist of both large-scale, highly-collimated structures and very compact features, sometimes with flat or inverted radio spectra. These latter often exhibit high brightness temperatures, extreme variability and apparently superluminal motions - phenomena for which the only plausible explanation seems to be a relativistic jet produced by a ‘central engine’ (Begelman, Blandford & Rees 1984). Thus, for radio-loud objects it seems indisputable that the ultimate source of the radio emission is a compact central engine, or ‘monster’; conventionally a supermassive black hole.
The origin of the much weaker radio emission in radio-quiet AGN is far less certain, and doubts remain as to whether the emission is directly associated with the AGN itself. Kellermann et al. (1994) found that the 5-GHz radio luminosities of the radio-quiet BQS objects were much larger than the typical values for spiral or elliptical galaxies, but only a handful of RQQs (3/92) exhibited linear kpc-scale emission. Sopp & Alexander (1991) point to the radio/FIR correlation in RQQs as evidence that the source of the ‘extra’ radio emission is a circumnuclear starburst. In a more radical approach, Terlevich et al. (1992) have attempted to explain the entire phenomenon of radio-quiet activity, including the radio emission, in terms of a dense, nuclear starburst rather than a central engine.
There are several differences between the radio emission produced by regions of enhanced starformation and that directly associated with the central engine of an AGN (Condon 1992), and these can, in principle, be used to distinguish between the two mechanisms.
In starburst regions we observe both non-thermal synchrotron radiation and thermal free-free emission, the former from radio supernovae (RSN) and supernova remnants (SNR) and the latter from Hii regions. The radio emission can be distributed over a large volume but will be constrained to lie roughly within the isophotes of the host galaxy (though some of the plasma might diffuse out of the galaxy along local density gradients). With very high resolution numerous small radio sources might be resolved, corresponding to individual supernova remnants (eg those in M82, Muxlow et al. 1994). The brightness temperature of starburst-related radio emission should not exceed K and the emission becomes optically thick, with a flat spectrum, for K. The explosion of RSN can lead to random variations in the radio emission.
By contrast, radio-loud AGN produce non-thermal synchrotron emission from highly-collimated jets of plasma which contain compact knots and terminate in diffuse radio lobes. The knots are typically several orders of magnitude more luminous than individual supernova remnants. Extremely high apparent brightness temperatures are observed, but the emission remains optically thin with a steep spectrum until synchrotron self-absorption becomes significant at K. Flat-spectrum, self-absorbed radio cores are frequently associated with the optical nucleus of the AGN. When a relativistic jet is closely aligned with the line of sight the radio emission is boosted in the direction of the observer and the source will be highly variable with a flat radio spectrum and apparent brightness temperatures of up to K. In such cases apparent superluminal motions are sometimes also observed.
Strong evidence is now emerging that at least some RQQs contain radio sources which are fundamentally similar to those in RLQs, albeit several orders of magnitude smaller and less powerful. Barvainis et al. (1996) found evidence for a flat-spectrum radio component in 40 of their 23 RQQs and several of these sources also showed the variability and high brightness temperatures characteristic of the radio emission in RLQs. They conclude that at least some RQQs contain a partially opaque synchrotron core which is associated with a compact central engine.
The presence of relativistic jets in at least some RQQs has been inferred by MRS93 from the correlation between radio and [OIII]5007 luminosities (though in many cases an extra-nuclear starburst is also required in order to explain correlations between non-nuclear radio and [OIII] emission). Also, several authors have argued that the simplest interpretation of the so-called ‘radio-intermediate quasars’ (RIQs) is that they are objects which have been boosted out of the radio-quiet population by relativistic beaming effects (MRS93, Falcke, Malkan & Biermann 1995, Falcke, Sherwood & Patnaik 1996). This in turn implies the existence of misaligned radio jets in at least some RQQs.
Finally, high-resolution mapping with VLBI has revealed extremely compact (milliarcsecond-scale), high radio components in a handful of RQQs (eg Hutchings & Neff 1992) including the object E1821+643 which contains both a compact, flat spectrum, pc-scale core and a steep-spectrum, 100-pc-scale radio jet (Papadopoulos et al. 1995, Blundell & Lacy 1995, Blundell et al. 1996).
5 Implications of the current data
Our observations have enabled us to determine the radio luminosities, spectral indices and, in some cases, morphologies of the RQQs in our sample. Using this information we can now attempt to place some constraints on the processes responsible for the compact radio emission in RQQs and to compare their radio properties with those of other types of AGN.
5.1 Supernovae and supernova remnants
Both supernova remnants (SNRs) and recently exploded supernovae can be strong sources of radio emission, with the latter up to 300 times as powerful as Cas A. Ulvestad (1982) used the surface brightness – diameter () relation for galactic SNRs to estimate the supernova rate required to produce the observed radio luminosity of nearby Seyfert nuclei. In the majority of cases an unfeasibly large supernova rate is implied. The number of massive stars required to maintain such a rate would have an energy output at optical wavelengths far in excess of the observed luminosities of Seyferts.
However, this method assumes that all the energy of the supernova is released during the adiabatic (Sedov) phase and thus ignores emission from remnants older than years. As a result, the relation overestimates the supernova rate of our own Galaxy and predicts flatter radio spectral indices for nearby spirals than are actually observed. Condon & Yin (1990) argue that the ratio of our Galaxy’s non-thermal radio emission to its supernova rate gives a more reliable means of estimating supernova rates:
| (1) |
where is the radio spectral index and is the supernova rate per year. Applying this formula to our 8.4-GHz A-array fluxes gives supernova rates ranging from to 50 per year to power the compact radio components in RQQs. Although the lower figure is comparable to the supernova rate in our Galaxy, the upper value is times larger than the typical supernova rates in nearby starburst galaxies. In the compact radio sources in RQQs all of this activity must take place within a region which is typically less than a kiloparsec across. Thus it seems unlikely that supernovae and their remnants can account for the non-thermal emission, except in the faintest and largest nuclear radio sources.
5.2 Brightness temperatures
Table 5 lists the 8.4-GHz brightness temperatures for all the detected radio components. Since all of the components are essentially unresolved the FWHM of the A-array beam has been used to give an upper limit on the angular size of 0.24′′ - the corresponding value of is therefore a lower limit only.
Using this method gives typical lower limits on in the range to K. Such brightness temperatures could easily be produced by either the starburst or the AGN mechanism. However, deconvolving the radio component from the A-array beam using the aips task jmfit allows us to derive a much more stringent limit on the angular size. The reliability of the deconvolution algorithm is highly dependent on the signal-to-noise ratio in the radio map. For our 8.4-GHz snapshot observations this ratio is relatively low (peak flux densities are typically mJy beam-1, with noise levels of mJy beam-1) and the deconvolved sizes must therefore be treated with caution. However, using this method we find that in the majority of objects the deconvolved radio source is extremely compact, leading to values of which are typically to K (and as high as K in one case). For K we would expect any starburst related radio emission to become optically thick with a flat spectrum, whereas we find that in the majority of cases the radio emission between 1.4 and 8.4 GHz has a steep spectrum.
The VLBI measurements necessary to confirm these values of have so far been carried out for only a handful of RQQs (eg Hutchings & Neff 1992, Roy et al. 1994, Blundell et al. 1996), but temperatures in excess of K appear to be common. This constitutes strong evidence that the primary source of the compact radio emission in RQQs is non-stellar - ie a central engine rather than a starburst.
5.3 Radio structures
If the radio emission in RQQs can be shown to take the form of highly-collimated jets as it does in RLQs and Radio Galaxies then we can confidently ascribe it to the central engine of the RQQ and rule out starburst regions as the primary source of the radio plasma. Although the jet collimation mechanism in radio-loud AGN is not understood there is no viable mechanism by which an ensemble of supernovae could produce continuous, highly-collimated outflows.
At 8.4 GHz the angular diameter (FWHM) of the A-array beam is 0.24′′, corresponding to a spatial resolution of kpc to kpc over the redshift range of our RQQ sample. Arcsecond-scale radio structures have been detected in 9 of our objects (10 if we accept the marginal evidence for extended emission in PG 0052+251), although none of these can unambiguously be identified as jets (Table 5). However, in each case the radio morphology conforms to the pattern of double, triple and linear sources familiar from maps of radio-loud quasars - where it is invariably associated with powerful jets from the AGN. Conceivably a starburst taking place in a nuclear bar might be able to produce symmetrical or elongated radio morphologies, but not highly collimated jet-like structures. Forthcoming MERLIN observations of our RQQs, with a five-fold improvement in angular resolution, should enable us to test this possibility.
The emitting regions in the resolved RQQs are all at least 2 kpc across and are thus consistent with the largest radio structures observed in nearby Seyfert galaxies - objects in which detailed studies have also found evidence for radio jets (see Section 5.4). However, in the unresolved RQQs the upper limits on the physical sizes are typically kpc or less. This is also consistent with radio studies of Seyfert nuclei, in which of objects appear to possess only a compact ( pc) nuclear radio source, with no evidence for extended structure (eg Kukula et al. 1995).
5.4 Comparison with Seyfert nuclei
There are many similarities between the radio properties of Seyfert galaxies and those of the RQQs in the present survey. In both cases steep-spectrum, non-thermal emission and high brightness temperatures are observed. Although most of the RQQs are unresolved, the upper limits on their sizes place their radio sources in the same size regime as those of Seyferts. Where the radio source can be resolved we find double, triple and more complex radio structures, all highly reminiscent of early, low-resolution radio maps of Seyfert nuclei.
These similarities are unsurprising. In terms of spectroscopic characteristics there is no real difference between RQQs and the nuclei of Type 1 Seyfert galaxies - the distinction is purely one of optical luminosity. Historically, the classification of a particular object has depended on the method of discovery and is essentially a result of whether the host galaxy is easily detectable from the ground. In order to formalise the classification system Schmidt & Green (1983) proposed an arbitrary distinction in terms of absolute magnitudes: objects with are RQQs, whilst anything with is deemed a Seyfert galaxy. Although this definition has been generally adopted, low-redshift () objects with are still frequently referred to as Seyfert nuclei, particularly when the surrounding galaxy is clearly visible.
The relatively small distances to many Seyferts mean that the radio structures of their nuclei can be investigated on much smaller spatial scales than is possible for RQQs, providing a greater insight into the processes responsible for the radio emission. Typical flux densities of a few milliJanskys are measured, corresponding to radio luminosities LW Hz-1. Although the total radio emission of Seyfert galaxies includes contributions from the galaxy disc and from starburst regions, in many objects there is a strong radio source which is directly associated with the active nucleus. This source is generally confined to the central regions of the host galaxy but can exhibit structures on a range of scales from 10 kpc down to 1 pc at the limit of current resolving power. Radio structures are frequently linear or ‘jet-like’, ie elongated or consisting of a series of aligned radio knots. Spectra are usually steep () but flatter spectra () are sometimes found in compact radio components. There can be little doubt that these structures represent radio jets, similar to, but much weaker than, those in radio-loud AGN, and that they are capable of contributing a significant fraction of the total radio luminosity of the galaxy, in some cases becoming the dominant source of radio emission (eg de Bruyn & Wilson 1976, Ulvestad & Wilson 1984a,b, Kukula et al. 1995).
As we demonstrate in the next subsection, the distribution of radio luminosities in the RQQs is consistent with them being more radio powerful, as well as more optically luminous, versions of Seyfert 1 nuclei. The VLBA observations of E1821+643 by Blundell et al. (1996) have already demonstrated the existence of Seyfert-like radio structures in one RQQ, and there appears to be no reason why this should not also be the case in many other objects. Observations with high angular resolution, such as our own forthcoming MERLIN survey, will help to clarify this issue.
5.5 The radio-optical relation in radio-quiet AGN

The smooth increase in optical luminosities from the faintest Seyferts through into the RQQ population impelled us to look for a similar effect in the distribution of radio luminosities. The existence of a correlation between the radio and optical emission in radio-quiet AGN would constitute further evidence for a direct link between the central engine of the quasar, which produces the optical continuum, and the processes responsible for the nuclear radio emission.
Several authors have found evidence for radio-optical luminosity correlations in both radio-loud (Rawlings & Saunders 1991, Serjeant et al. 1997) and radio-quiet quasars (Stocke et al. 1992, Lonsdale, Smith & Lonsdale 1995). However, the existing evidence is not conclusive and the situation is complicated by the difficulty of separating optical luminosity from redshift in the major, flux-limited quasar samples.
In Figure 4 we plot the 8.4-GHz radio luminosities of the RQQs in our current sample as a function of absolute magnitude, . Also shown on this plot are the Type 1 Seyferts from the CfA sample (Huchra & Burg 1992). The radio luminosities of the Seyfert 1s are derived from the C-array measurements of Kukula et al. (1995), which give a comparable spatial resolution over the redshift range of the CfA sample () to our current A-array observations over the range covered by the RQQs (). Thus, in both sets of data roughly the same amount of the host galaxy has been included in the primary beam. It is important to note, however, that, unlike the CfA Seyfert sample, the current RQQ sample is in no sense complete, nor are the selection criteria of the RQQs and Seyferts comparable.
There is some overlap in terms of absolute magnitude between the two samples. Assuming neutral colours for the quasars and Seyfert nuclei, such that , it is clear that the two lowest redshift RQQs in our sample, PG 0921+525 and PG 1149110, fall below the optical luminosity threshold for quasars and should, strictly speaking, be regarded as Seyferts 1s. Equally, two of the more distant CfA Seyferts (Mrk 205 & Mrk 231) should strictly be regarded as RQQs, since they have M. One object (PG 0050+124; I Zw 1) is common to both samples and is treated here as an RQQ. For simplicity, in the discussion which follows we regard everything with as a Seyfert galaxy and everything with as a quasar.
The data in Figure 4 do appear to show a broad correlation between radio luminosity and absolute magnitude. In the case of the CfA Seyfert galaxies the correlation is already well known from the 5-GHz observations of Edelson (1987). Interestingly, however, the new data for RQQs puts them on a natural extension of this correlation.
Three objects stand out from the general distribution. These are the RQQs PG 0007106 and 1635119, both of which have compact, flat-spectrum radio nuclei, and the ‘Seyfert 1’ Mrk 231, which is known to be heavily reddened. However, as argued in Section 5.7, PG 0007+106 and 1635+119 are radio-intermediate quasars, with properties quite distinct from those of the general RQQ population. The available evidence suggests that they may be relativistically beamed sources, in which case their intrinsic radio luminosities would be considerably lower than the measured values. Meanwhile Boksenberg et al. (1977) estimate 2 magnitudes of extinction towards the optical nucleus of Mrk 231 and applying this correction moves the object to the right in Figure 4, placing it back on the radio-optical correlation. On these grounds, we exclude these three objects from our discussion (although we note that their inclusion would not alter our conclusions).
There is a slight tendency for the lower edge of the distribution to be defined by radio upper limits rather than detections. This is expected since both the Seyfert and RQQ samples are derived from surveys with an optical flux limit and will therefore suffer to some extent from an artificial correlation between and redshift. Nevertheless it is worth noting that the optical and radio flux limits are different for the two samples, offering us a degree of independence, and in any case the number of upper limits is relatively small compared to the total number of objects (9/46). This is compelling evidence in favour of there being a real correlation between the radio and optical luminosities even though the true distribution may not be as tightly constrained as Figure 4 suggests at first glance.
We can derive a probability that the correlation is real, taking into account all of the radio upper limits as well as the detections, by employing the techniques of survival analysis (Feigelson & Nelson 1985, Isobe, Feigelson & Nelson 1986).
Using the asurv package (Isobe & Feigelson 1990), and considering only the Seyfert 1s, we find the probability of a correlation to be 98% from Cox’s proportional hazard model (supported by the generalised Kendall’s Tau and Spearman’s Rho tests). This probability increases to 99.99% when the RQQs are included (there is no significant correlation amongst the RQQs alone).
The parametric EM algorithm gives a regression line for the two samples combined which is of the form
| (2) |
The fit is confirmed by the (non-parametric) Buckley-James method and is shown as a dotted line in Figure 4. When the Seyfert sample is considered in isolation the resulting regression line parameters are the same to within the calculated uncertainties.
Although the lower envelope of the radio luminosity distribution is artificially imposed by the flux limits in the two sets of observations, the upper envelope does seem to be real. The correlation appears to be telling us that for a given optical luminosity there is a maximum radio luminosity which can be achieved by a radio-quiet AGN (without the benefit of beaming effects) and that this maximum radio luminosity increases as a function of optical power. This implies a close link between the processes responsible for the radio and optical emission.
As a caveat it should be noted that the measured optical luminosities of the quasars and the Seyferts contain contributions from both the active nucleus and the host galaxy. We cannot entirely rule out the possibility that the radio emission is tied to the stellar component of the host rather than the central engine, but there are good reasons to suppose that the size of the stellar contribution is not large enough to cause the observed correlation. The magnitudes of the CfA Seyferts were measured over the nuclear region of the galaxy so the fraction due to starlight, although ill-defined, is not likely to be large (Huchra & Burg 1992). For the quasars the ratio of AGN to host luminosity for objects in this redshift and magnitude range is typically 10:1 or greater in -band (Taylor & Dunlop 1997), and so once again the contribution due to stars is probably small. A more accurate separation of host and quasar light at optical wavelengths forms one of the goals of a forthcoming Cycle 6 Hubble Space Telescope program involving 12 of the RQQs in the current sample.
For the moment it seems safe to assume that the observed distribution reflects a correlation between the radio emission and the non-stellar light from the quasar itself. Even so, recent studies have indicated the existence of a correlation between quasar luminosity and host galaxy mass (eg McLeod & Rieke 1994), so the relationship between radio emission and optical quasar emission in the present work might simply reflect the fact that the most optically luminous quasars occur in the most massive galaxies.
As a final point we note that it would be very interesting to see whether the radio-optical correlation applies to more powerful RQQs than those discussed here. Our current sample consists of relatively weak () quasars, but if the correlation persists out to the highest known absolute magnitudes for RQQs () then these objects would have typical radio luminosities of the order of W Hz-1. Kellermann et al.’s (1989) radio survey of the BQS appears to support this, but the BQS is known to be selectively incomplete for radio-quiet objects (eg Goldschmidt et al. 1992) and so confirmation of this result will require high-sensitivity radio surveys of carefully constructed quasar samples.
5.6 Comparison with Compact Steep-spectrum Sources
The typical radio source dimensions of our RQQs ( kpc) put them in the same size regime as the Compact Steep-spectrum Sources (CSSs) which make up between 15 and 30% of the objects in radio source catalogues (Fanti et al. 1990). There are, however, several important differences between CSSs and the radio sources in RQQs. The former, whose optical counterparts can be either elliptical galaxies or quasars, are all radio loud (indeed, they are disproportionately found towards the top end of the radio luminosity range), with radio luminosities several orders of magnitude larger than anything in our RQQ sample. The majority of quasar CSSs are also optically luminous () and have high redshifts: there are no known objects with .
One interpretation of CSSs is that they are young objects (Fanti & Spencer 1996), still in the process of ‘drilling’ their way through the interstellar medium of the host galaxy before escaping and evolving into the giant radio sources typical of RLQs and RGs of Fanaroff-Riley Type II (Fanti et al. 1990). In this model, as the radio source propagates outwards from scales of a few hundred parsecs to several kiloparsecs, changes in the radiation efficiency of the jet will cause the total radio luminosity of the source to decrease by a factor of (Fanti et al. 1995; Readhead et al 1995).
Are the compact RQQ radio sources in the current study also young objects in the process of boring their way out of the surrounding galaxy? If so, do they ever break free, and what do they look like when they do? If we assume that the compact sources in RQQs undergo a similar drop in radio luminosity as they expand from sub-kiloparsec to galactic scales then the fully evolved, large-scale radio structures would be too faint and diffuse to show up in our current maps. Highly sensitive, targeted observations of individual objects would be required in order to detect such structures in RQQs.
Diffuse, bipolar radio structures have been observed in some Seyfert galaxies on scales of tens of kiloparsecs - comparable to the size of the host galaxy (eg Baum et al. 1993, Colbert et al. 1996). However, compact, nuclear radio sources are also present in these objects so the weak large-scale features are unlikely to be fully-evolved radio sources, powered directly by the active nucleus in the manner of radio-loud objects. The structures are generally aligned with the minor axis of the host galaxy, rather than that of the nuclear radio source, and can be interpreted as plasma - perhaps a relic of previous cycles of activity - which has lost its bulk kinetic energy and is now drifting out of the plane of the host along the local density gradient (eg the features in Mrk 6; Kukula et al. 1996).
The fact that we detect compact radio components in 74% of our sample implies that there are few, if any, RQQs which have evolved into large-scale radio sources. This argues strongly that the radio sources in RQQs remain confined to the central regions of the host galaxy, at least over the lifetime of the optical quasar.
5.7 The nature of the Radio-Intermediate Quasars
Two of the objects in the current sample, PG 0007+106 (III Zw 2) and 1635+119, possess unusually large radio luminosities and lie well above the general distribution of radio-quiet quasars in the radio-optical luminosity plane (Figure 4) (but still below that of radio-loud quasars). MRS93 and Falcke, Sherwood & Patnaik (1996) describe such objects as ‘radio-intermediate quasars’ (RIQs) and interpret them as objects in which the radio emission is relativistically boosted along the line of sight. The variable radio and optical emission of these objects lends weight to such a scenario.
Several properties of the RIQs in our sample support this hypothesis. The ‘genuine’ RQQs invariably have steep radio spectra (at least, whenever simultaneous flux measurements are available) with typical spectral indices . The two RIQs stand out from this trend: 1635+119 has a flat radio spectrum, and that of PG 0007+106 appears to be inverted. Although we do not have simultaneous flux measurements for PG 0007+106, its spectral shape is confirmed by the observations of Schnopper et al. (1978) and Gower & Hutchings (1984).
A comparison of the current data with the observations of Gower & Hutchings (1984) shows that both sources are variable at radio wavelengths. PG 0007+106 is also known to be highly variable in the optical regime (eg Teräsranta et al. 1992, Lainela 1994).
Brightness temperatures exceeding K would constitute strong evidence in favour of the RIQs being beamed sources, but the angular resolution of the current VLA maps is much too low to place such a stringent limit on . However, Lawrence et al. (1985) have detected a VLBI component in PG 0007+106 less than 1 mas in size with a measured brightness temperature at 22 GHz of K.
PG 0007+106 and 1635+119 are 2 to 3 orders of magnitude more luminous than the RQQs in our sample with absolute magnitudes (Figure 4). Assuming that the jets in these objects are aligned very closely to the line of sight, Lorentz factors of would be sufficient to boost them from the general RQQ population to their observed positions on the radio luminosity - absolute magnitude plane. If this interpretation is correct then misaligned relativistic jets should be a common feature of RQQs.
However, in both these objects the compact flat-spectrum core appears to be associated with a radio lobe several arcseconds from the quasar nucleus. The projected physical sizes of these two radio sources are, at 33 kpc for PG 0007+106 and 175 kpc for 1635+119, much larger than those of any of the RQQs (with the possible exceptions of PG 0804+761 and PG 1116+215). If the properties of the radio cores in PG 0007+106 and 1635+119 are indeed the result of beaming then (in the absence of significant bending of the jets) this would imply that the radio source axis is very close to the line of sight and that the actual deprojected sizes are even larger. Thus, even if the nuclear radio components of the RIQs have unbeamed luminosities similar to those of the genuine RQQs in the sample, the overall sizes of the radio sources in these two objects are more in line with those observed in radio-loud quasars. In this case the RIQs might better be thought of as RLQs of very low luminosity rather than RQQs which we happen to observe from a preferred direction. Detailed investigations of a larger sample of these ‘intermediate’ objects will be required to determine whether they ultimately bear more similarity to radio-loud or radio-quiet quasars.
5.8 FIR-radio correlation
If a significant fraction of the radio emission from RQQs can be accounted for by a non-thermal source associated with the central engine then we are left with the problem of why they appear to lie on the far-infrared/radio correlation defined by galaxies which are undergoing starformation.
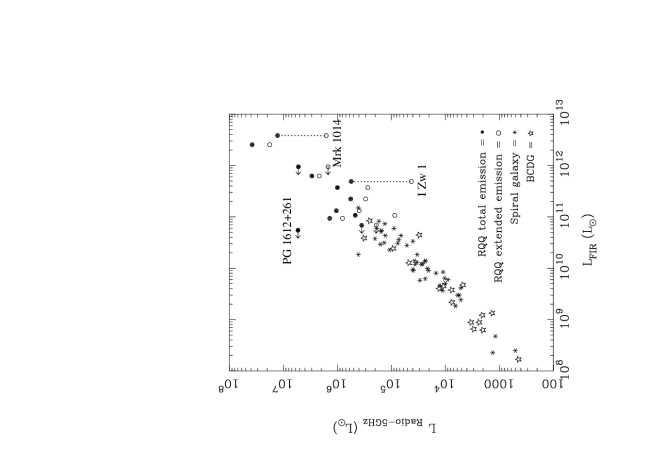
In high-mass starforming regions young OB stars heat their surrounding dusty, molecular material and consequently such regions emit strongly at FIR wavelengths. These massive stars, which evolve off the main sequence within years, are also the progenitors of the supernova remnants which accelerate electrons and produce radio synchrotron emission. Hence starformation is understood to be the origin of the tight correlation between the FIR and extended radio luminosities in the disks of spirals and starburst galaxies (Helou, Soifer & Rowan-Robinson 1985) over at least four decades in luminosity. In Figure 5 we show the 5-GHz radio luminosities of spiral and blue compact dwarf galaxies plotted as a function of of their 60-m IRAS luminosities (data from Wunderlich et al. 1987). In the same figure we also show those RQQs from the current sample for which IRAS fluxes were available.
The apparent overlap between the FIR and radio fluxes of RQQs and the FIR-radio correlation for spiral galaxies and starbursts led Sopp & Alexander (1991) to suggest that both the FIR and radio luminosities in RQQs were due entirely to starformation in the host galaxies and, as Figure 5 demonstrates, most of the quasars in the current sample (filled circles) do indeed appear to lie on this correlation. However, in Figure 5 we have also plotted the position of RQQs on the FIR-radio plane if only extended (ie galaxy-wide) emission is considered (open circles). This helps to demonstrate a number of important points which have perhaps not been properly appreciated before.
First, the scatter in the FIR-radio relation is sufficiently large that, in almost all cases, removal of the dominant contribution of the compact nuclear radio source leaves the RQQ still in a location consistent with the extension of the FIR-radio correlation of normal star-forming galaxies. It is thus perfectly possible for the radio emission from RQQs to be dominated by a non-thermal nuclear source, and yet for them to still appear to lie on the FIR-radio correlation displayed by normal and starburst galaxies. (One object, PG 1612+261, lies conspicuously above the correlation and it is interesting to note that in this instance all of the radio emission from the RQQ appears to originate in the jet-like radio source in the nucleus.)
Second, two objects stand out on this diagram in that plotting only their extended radio luminosities places them well below the FIR-radio relation: PG 0050+124 (I Zw 1) and PG 0157+001 (Mrk 1014). These two sources can be used to illustrate how an RQQ can conspire to lie on the FIR-radio relation even if its radio emission is almost totally due to an active nucleus. If we suppose that their extended radio luminosities are indicators of the level of starformation in the host galaxies then their far-infrared luminosities can be viewed as an order of magnitude larger than expected on the basis of of the FIR-radio correlation.
This excess FIR luminosity must therefore be due to either (i) additional nuclear starburst activity or (ii) additional dust heating by the AGN. Our radio data offer a means to differentiate between these two alternatives, because if the former option is correct the compact radio source must also be due to the nuclear starburst since its addition is just sufficient to return the source to the FIR-radio correlation. However, as argued above, the spectral indices and apparent brightness temperatures of the nuclear radio sources in these two objects (as with many of the other quasars in our sample), and (in the case of PG 0157+001) the structure of the radio source, favour a non-starburst origin for the compact radio components.
This in turn implies that the extra far-infrared luminosity of these two sources is not due to a nuclear starburst but rather to excess dust heating by the central engine. Interestingly, these are the only two quasars in the current sample in which strong CO line emission has also been detected.
If this interpretation is correct, then the fact that these sources are lifted back onto the FIR-radio correlation by the addition of their compact nuclear radio components must be due to a link between the optical luminosity of the quasar nucleus (responsible for the dust heating) and the radio emission from the AGN. This is entirely consistent with the results of Section 5.5, in which we showed that there does indeed seem to be a relation between the nuclear optical and radio emission in RQQs and Seyfert 1 nuclei.
In conclusion the fact that most RQQs appear to lie in a natural extrapolation of the the FIR-radio relation cannot be taken as evidence that the radio emission is dominated by a starburst component. Rather, the large scatter in this relation, coupled with the fact that additional AGN heating of dust brings with it a proportional amount of AGN-related radio emission means that no RQQs are found to lie below the lower border of the relation.
5.9 Summary of important results
The angular resolution of the current observations is not sufficient to unambiguously determine the nature of the nuclear radio emission in RQQs. However, from the data we are able to place reasonably tight constraints on the emission mechanisms and thus to make some strong statements about the likely origins of the compact radio components.
To explain the radio luminosities of the compact components with a pure starburst model would require supernova rates at least as high as that of our own Galaxy (and in some cases much higher than the rates observed in nearby starburst galaxies) occurring in a region no more than a few hundred parsecs across. Lower limits on the brightness temperatures of the deconvolved radio components are close to the maximum values possible for starburst regions, but the radio spectra are steep, indicating a predominantly non-thermal origin, contrary to what one would expect if supernovae and Hii regions were the primary source of the emission.
The morphologies and sizes of the nuclear radio sources in RQQs bear close comparison to those of Seyfert galaxies, and the RQQs fall on the extension of the Seyfert 1 radio-optical luminosity correlation. Imaging studies of nearby Seyferts have now resolved the nuclear structure, in many cases revealing collimated radio jets, and it seems overwhelmingly likely that such structures are also present in RQQs. Forthcoming MERLIN and VLBI studies should confirm this. The high rate of occurrence of compact nuclear radio sources in RQQs implies that the radio emission remains confined to the nucleus of the host galaxy for a large proportion of the quasar’s lifetime, ie the radio sources are not small simply because they are young.
The properties of the two radio-intermediate quasars in the sample are generally consistent with them being beamed versions of RQQs of the same optical luminosity, suggesting that at least some RQQs also possess relativistic jets.
Finally, we have shown that the tendency of RQQs to lie on the FIR-radio correlation for star-forming spirals and starburst galaxies cannot be taken as proof that stellar processes are responsible for the radio emission in RQQs. Dust-heating by the quasar and associated radio emission from the AGN can conspire to keep the RQQ on the FIR-radio relation.
6 Radio properties and the nature of the host galaxy in our host galaxy sample
| Radio source properties | Host galaxy properties | |||||
| Source | log(L | Structure | Scale | Type | ||
| (W Hz-1) | (2.2m) | (kpc) | ||||
| PG 0007+106 | ∗24.69 | 0.6 | core-lobe | 24.47 | 15.4 | D |
| 0046+112 | 23.47 | 0.7 | point | 23.74 | – | ? |
| PG 0052+251 | 22.65 | 0.3 | core-jet? | 24.89 | 18 | E |
| 0054+144 | 22.94 | 0.6 | point | 26.13 | 15 | E |
| PG 0157+001 | 23.82 | 0.7 | double | 26.66 | 20 | E |
| 0244+194 | 22.44 | – | - | 24.72 | 9 | D |
| 0257+024 | 23.52 | 0.5 | point | 25.56 | 10 | D |
| PG 0923+201 | 22.72 | – | - | 25.25 | – | ? |
| PG 0953+414 | 22.66 | – | - | 25.71 | – | ? |
| PG 1012+008 | 23.05 | 0.9 | point | 26.13 | 19.5 | D |
| PG 1211+143 | 22.38 | – | - | 24.43 | 8.0 | D |
| PG 1440+356 | 22.31 | – | point | 25.16 | 7.1 | D |
| 1549+203 | 22.75 | – | - | 25.02 | 46? | D? |
| 1635+119 | ∗24.12 | 0.02 | core-lobe | 25.20 | 28 | E |
| PG 2130+099 | 22.48 | 1.8 | triple | 25.28 | 7.5 | E |
| 2215-037 | 22.82 | – | - | 25.46 | 13? | D? |
| 2344+184 | 22.19 | – | - | 25.11 | 12 | E |
Taylor et al. (1996) have determined the NIR (-band: 2.2m) luminosities, scalelengths and morphological types for the host galaxies surrounding 17 of the RQQs in the current sample (Table 7). They found that, whilst of the RQQs were found in disc systems, for a significant fraction of objects the best fitting model was in fact an elliptical galaxy. This is consistent with the results of several other studies which also find RQQs to be distributed amongst a mixture of disc-like and spheroidal hosts (eg. Véron-Cetty & Woltjer 1990, Disney et al. 1995). However, Taylor et al. also found a tendency for the quasars in disc hosts to be less luminous than those in ellipticals. Although the sample was too small for the result to be statistically significant, the trend is supported by the results of McLeod & Rieke (1994), who determined the NIR morphologies of galaxies containing low-luminosity RQQs close to the RQQ/Seyfert boundary and found that essentially all of these objects lie in disc systems. Taylor et al. speculate that for all RQQs might occur in elliptical galaxies rather than discs.
The AGN traditionally associated with elliptical hosts (ie radio galaxies and RLQs) produce large, powerful radio sources and this suggests that the RQQs in elliptical galaxies, whilst technically ‘radio quiet’, might still harbour radio sources which differ in size and luminosity from those in disc galaxies.
Within our sample of 17 RQQs, 8 objects have hosts in which the dominant stellar component is disc-like, 6 lie in spheroidal systems and 3 have ambiguous morphologies. We find no statistically significant differences between the radio sources in different types of host galaxy. The size distributions of the radio sources (including upper limits) are indistinguishable for elliptical and disc hosts. The RQQs in elliptical hosts do not contain more luminous radio sources than those in disc galaxies, although this may not be true for values of if all optically luminous RRQs are found in ellipticals and the radio-optical correlation is real. Radio spectral indices are generally steep in both types of host, and it appears that radio-intermediate quasars can occur in either. If the interpretation of these objects as beamed sources is correct then we can infer that having an elliptical galaxy as a host is not a prerequisite for the formation of a relativistic jet.
One interesting (though not formally significant) point is that, of the 5 objects in Table 7 in which radio structure has been resolved, 4 are in elliptical systems (the fourth is an RIQ and therefore may not be representative of the radio-quiet population). This is the only indication that RQQs in elliptical galaxies might have different radio properties from those in discs.
The current sample is small, and is limited to RQQs of relatively low optical luminosity, but our radio survey clearly demonstrates that having an elliptical host does not automatically confer a large radio luminosity on the quasar. A significant number of elliptical galaxies with active nuclei do not produce large, powerful radio sources. Instead they contain small, weak sources very similar to those in disc systems. More detailed studies of the host galaxies, such as our own -band HST imaging programme, should allow us to determine if and how these elliptical RQQ hosts differ from the elliptical systems containing radio-loud AGN.
6.1 Radio source morphology and related structures in the host galaxy
In two of the RQQs with resolved radio morphologies we also see evidence for structure in the host galaxies along similar position angles, and thus possibly related to the radio emission.
In PG 0157001 the two radio ‘lobes’ straddle the optical nucleus in the same PA as an emission-line structure visible in the [Oiii] image by Stockton & MacKenty (1987). The scale of the [Oiii] emission is (37 kpc) - much larger than the (7 kpc) separation of the radio lobes, so the two features are unlikely to be directly associated. However, the morphology is consistent with standard models of anisotropy in AGN in which radio jets are ejected along the axis of a cone of radiation from the central engine which can ionise gas clouds further out in the body of the host galaxy.
The triple radio source in PG 2130+099 is perpendicular to the major axis of the host (as determined by Taylor et al. 1996) but is aligned with an anomalously blue region of the galaxy nucleus (Hutchings & Neff 1992). Once again, this is consistent with the standard model for AGN, in which quasar light is emitted preferentially in the direction of the radio jet but is scattered back into the line of sight by material in the host galaxy. Alternatively, the blue excess may be due to a burst of massive starformation triggered by the radio jet as it passes through the host. At 8.4 GHz we find marginal evidence for extended emission across the quasar nucleus in a direction orthogonal to that of the triple source - ie parallel to the major axis of the host galaxy (Figure 2). This is similar to radio structure in the Seyfert nucleus of NGC 5929 (Su et al. 1996). Detection of a high-frequency excess in PG 2130+099 at 15 GHz (Antonucci & Barvainis 1988) lends support to the theory that the orthogonal structure might consist of thermal emission from a circumnuclear starburst lying in the plane of the host galaxy. The emission would have to have a low ( K), but this should be testable with more sensitive observations at 8.4 & 15 GHz.
7 Summary
We have measured the radio fluxes and spectral indices of a sample of 27 RQQs using the VLA in A-configuration. The angular resolution of the VLA is not sufficient to unambiguously determine the origin of the radio emission in these objects, but from the data we are able to conclude the following:
(1) In 74% of the sample we detect a radio source which is coincident with the optical quasar to within the positional uncertainty of the optical measurements.
(2) The spectral indices of the RQQs are generally steep (, where ), although two objects, which also exhibit variability and unusually large radio luminosities, have flat radio spectra.
(3) Lower limits on the brightness temperatures of many of the radio sources place them at the upper end of the range expected for emission related to stellar processes ( K) (ie in the regime in which we would expect to see some spectral flattening if the emission was indeed stellar in origin). In some objects the brightness temperature is almost certainly many orders of magnitude greater than this, in which case the radio emission cannot be produced by a starburst. Large numbers of supernovae occurring within a very small volume would be required in order to reproduce the observed radio luminosities. Future observations with greater angular resolution will place more rigorous constraints on all these parameters.
(4) In nine (possibly ten) objects we are able to resolve radio structure, which takes the form of double, triple and linear sources on scales of a few kiloparsecs. These structures are consistent with the 100-pc-scale radio jets observed in low-redshift Seyfert nuclei, and constitute strong evidence that collimated ejection of radio plasma from the central engine is occurring in RQQs.
(5) The distribution of radio luminosities in RQQs form a natural extension to those of Seyfert 1 nuclei. There appears to be a correlation between radio luminosity and the optical absolute magnitude of the quasar, suggesting a close relationship between the central engine and the mechanism responsible for the bulk of the radio emission.
(6) There are no statistically significant differences in the present data between the radio properties of the RQQs in disc-dominated galaxies and those in elliptical hosts.
Thus, our results are consistent with the conclusions of other recent radio studies of RQQs: that in at least some RQQs a significant contribution to the overall radio emission comes from a compact nuclear source which is directly associated with the central engine of the quasar, and which is qualitatively similar to the more powerful radio sources observed in RLQs.
Acknowledgments
The authors would like to thank Katherine Blundell for adding several sources into her observe file at very short notice, and Philip Miller for allowing us to use three of the maps from his thesis. We would also like to thank Ian Browne, the referee, for several very useful comments and suggestions. MJK acknowledges PPARC support. This research has made use of the NASA/IPAC Extragalactic Database (NED) which is operated by the Jet Propulsion Laboratory, Caltech, under contract with the National Aeronautics and Space Administration. The National Radio Astronomy Observatory is operated by Associated Universities, Inc., under cooperative agreement with the National Science Foundation.
References
- [ploppy] Antonucci R., 1993, ARA&A, 31, 473
- [ploppy] Antonucci R., & Barvainis R., 1988, ApJ, 332, L13
- [ploppy] Barvainis R., Lonsdale C., Antonucci R., 1996, AJ, 111, 1431
- [ploppy] Baum S. A., O’Dea C. P., Dallacasa D., de Bruyn A. G., Pedlar A., 1993, ApJ, 419, 553
- [ploppy] Begelman M. C., Blandford R. D., Rees M. J., 1984, Rev. Mod. Phys., 56, 255
- [ploppy] Blundell K. M., Lacy M., 1995, MNRAS, 274, L9
- [ploppy] Blundell K. M., Beasley A. J., Lacy M., Garrington S. T., 1996, ApJ, 468, L91
- [ploppy] Boksenberg A., Carswell R. F., Allen D. A., Fosbury R. A. E., Penston M. V., Sargent W. L. W., 1977, MNRAS, 178, 451
- [ploppy] Bridle A. H., Perley R. A., 1984, ARA&A, 22, 319
- [ploppy] de Bruyn A. G., Wilson A. S., 1976, A&A, 53, 93
- [ploppy] Colbert E. J. M., Baum S. A., Gallimore J. F., O’Dea C. P., Christensen J. A., 1996, ApJ, 467, 551
- [ploppy] Condon J. J., 1992, in Holt S. S., Neff S. G., Urry C. M., eds., ‘Testing the AGN Paradigm’, AIP Conference Series 254, New York, p. 629
- [ploppy] Condon J. J., Yin Q. F., 1990, ApJ, 357, 97
- [ploppy] Condon J. J., Cotton W. D., Greissen E. W., Yin Q. F., Perley R. A., Taylor G. B., Broderick J. J., 1996, preprint
- [ploppy] Disney M. J. et al., 1995, Nat, 376, 150
- [ploppy] Dunlop J. S., Taylor G. L., Hughes D. H., Robson E. I., 1993, MNRAS, 264, 455
- [ploppy] Edelson R. A., 1987, ApJ, 313, 651
- [ploppy] Falcke H., Malkan M., Biermann P. L., 1995, A&A, 298, 375
- [ploppy] Falcke H., Sherwood W., Patnaik A. R., 1996, ApJ, 471, 106
- [ploppy] Fanti C., Fanti R., Dallacasa D., Schilizzi R. T., Spencer R. E., Stangellini C., 1995, A&A, 302, 317
- [ploppy] Fanti R., Fanti C., Schilizzi R. T., Spencer R. E., Nan Rendong, Parma P., van Breugel W. J. M., Venturi T., 1990, A&A, 231, 333
- [ploppy] Fanti R., Spencer R. E., 1996, in Ekers R., Fanti C., Padrielli L., eds., ‘Extragalactic Radio Sources’, IAU Symposium 175, Kluwer, Dordrecht, p. 63
- [ploppy] Feigelson E.D., Nelson P.I., 1985, ApJ, 293, 192
- [ploppy] Goldschmidt P., Miller L., la Franca F., Cristiani S., 1992, MNRAS, 256, 65p
- [ploppy] Gower A. C., Hutchings J. B., 1984, AJ, 89, 1658
- [ploppy] Green R. F., Schmidt M., Liebert J., 1986, ApJS, 61, 305
- [ploppy] Helou G., Soifer B. T., Rowan-Robinson M., 1985, ApJ, 298, L7
- [ploppy] Huchra J. P., Burg R., 1992, ApJ, 186, 433
- [ploppy] Hutchings J. B., Neff S. G., Gower A. C., 1992, PASP, 104, 62
- [ploppy] Hutchings J. B., Neff S. G., 1992, AJ, 104, 1
- [ploppy] Isobe T., Feigelson E.D., & Nelson P.I., 1986, ApJ, 306, 490
- [ploppy] Isobe T., Feigelson E.D., 1990, BAAS, 22, 917
- [ploppy] Kellermann K. I., Sramek R., Schmidt M., Shaffer D. B., Green R., 1989, AJ, 98, 1195
- [ploppy] Kellermann K. I., Sramek R. A., Schmidt M., Green R. F., Shaffer D. B., 1994, AJ, 108, 1163
- [ploppy] Kukula M. J., Pedlar A., Baum S. A., O’Dea C. P., 1995, MNRAS, 276, 1262
- [ploppy] Kukula M. J., Holloway A. J., Pedlar A., Meaburn J., Lopez J. A., Axon D. J., Schilizzi R. T., Baum S. A., 1996, MNRAS, 280, 1283
- [ploppy] Lacy M., Rawlings S., Hill G., 1992, MNRAS, 258, 828
- [ploppy] Lainela M., 1994, A&A, 286, 408
- [ploppy] Lawrence C. R., et al., 1985, ApJ, 296, 458
- [ploppy] Lonsdale C. J., Smith H. E., Lonsdale C. J., 1995, ApJ, 438, 632
- [ploppy] McLeod K. K., Rieke G. H., 1994, ApJ, 420, 58
- [ploppy] Miller L., Peacock J. A., Mead A. R. G., 1990, MNRAS, 244, 207
- [ploppy] Miller P., 1992, PhD Thesis, University of Cambridge
- [ploppy] Miller P., Rawlings S., Saunders R., 1993, MNRAS, 263, 425
- [ploppy] Muxlow T. W. M., Pedlar A., Wilkinson P. N., Axon D. J., Sanders E. M., de Bruyn A. G., 1994, MNRAS, 266, 455
- [ploppy] Osterbrock D. E., 1991, Rep. Prog. Phys., 54, 579
- [ploppy] Papadopoulos P. P., Seaquist E. R., Wrobel J. M., Binette L., 1995, AJ, 446, 150
- [ploppy] Rawlings S., Saunders R., 1991, Nat, 349, 138
- [ploppy] Readhead A. C. S., Taylor G. B., Pearson T. J., Wilkinson P. N., 1995, ApJ, 460, 634
- [ploppy] Roy A. L., Norris, R. P., Kesteven M. J., Troup E. R., Reynolds J. E., 1994, ApJ, 432, 496
- [ploppy] Serjeant S., Rawlings S., Maddox S. J., Baker J. C., Clements D., Lacy M., Lilje P. B., 1997, MNRAS in press
- [ploppy] Schmidt M., 1963, Nat, 197, 1040
- [ploppy] Schmidt M., Green R. F., 1983, ApJ, 269, 352
- [ploppy] Schnopper H. W., Delvaille J. P., Epstein A., Cash W., Charles P., Bowyer S., Hjellming R. M., Owen F. N., 1978, ApJ, 222, L91
- [ploppy] Sopp H. M., Alexander P., 1991, MNRAS, 251, 14P
- [ploppy] Stocke J., Morris J. L., Weymann R. J., Foltz C. B., 1992, ApJ, 396, 487
- [ploppy] Stockton A., MacKenty J. W., 1987, ApJ, 316, 584
- [ploppy] Su B. M., Muxlow T. W. B., Pedlar A., Holloway A. J., Steffen W., Kukula M. J., Mutel R. L., 1996, MNRAS, 279, 1111
- [ploppy] Taylor G. L., Dunlop J. S., Hughes D. H., Robson E. I., 1996, MNRAS, 283, 930
- [ploppy] Taylor G. L., Dunlop J. S., 1997, in preparation
- [ploppy] Teräsranta H. et al., 1992, A&AS, 94, 121
- [ploppy] Terlevich R., Tenorio-Tagle G., Franco J., Melnick J., 1992, MNRAS, 255, 715
- [ploppy] Ulvestad J. S., 1982, ApJ, 259, 96
- [ploppy] Ulvestad J. S., Wilson A. S., 1984a, ApJ, 278, 544
- [ploppy] Ulvestad J. S., Wilson A. S., 1984b, ApJ, 285, 439
- [ploppy] Unger S. W., Lawrence A., Wilson A. S., Elvis M., Wright A. E., 1987, MNRAS, 228, 521
- [ploppy] Urry C. M., Padovani P., 1995, PASP, 107, 803
- [ploppy] Véron-Cetty M.-P., Woltjer L., 1990, A&A, 236, 69
- [ploppy] Véron-Cetty M.-P., Véron P., 1993, ESO Scientific Report No. 13
- [ploppy] Wunderlich E., Klein U., Wielebinski, R., 1987, A&AS, 69, 487