Gamma-ray bursts and density evolution of neutron star binary mergers
Abstract
The evolution of the comoving cosmic merger-rate density of neutron star binaries is calculated using a distribution of their merging times provided by population-synthesis computations of binary stars. We adopt an exponential law for the star formation rate with various timescales for different morphological types of galaxies. For elliptical galaxies also an initial burst of star formation, lasting one Gyr, is considered. The resulting of most models agree with the form for , which has been proposed for the source population of -ray bursts. Assuming a standard candle luminosity, the computed brightness distribution is consistent with the BATSE results if bursts at the peak flux threshold, =0.4 photonscm-2s-1, are located at a limiting redshift of 1.9 to 3.3. Progenitors of the systems producing -ray bursts at small redshift (bright) are likely to host in spiral galaxies and star forming regions whereas these at high redshift (dim) reside mainly in elliptical galaxies. The location of a burst may be up to Mpc away from the host galaxy.
Key words: stars: binaries – stars: evolution – stars: neutron – cosmology: theory – gamma rays: bursts – gamma rays: theory
1 Introduction
The recent discoveries of optical counterparts of the -ray bursts GRB970228 (Groot et al. 1997) and GRB970508 (Bond 1997) and the measured emission-line redshift of (Metzger et al. 1997) for the latter provide evidence for their cosmological origin. A possible source for -ray bursts (GRBs) may be the merging of two neutron stars in a close binary (Blinnikov et al. 1984).
For cosmologies with no vacuum energy, the brightness distribution of burst intensities expected for a uniform source population is consistent with the BATSE distribution if the limiting redshift is about unity (e.g. Dermer 1992; Mao & Paczyński 1992). However, cosmological time-dilation effects in the BATSE sample indicate that the dimmest sources should be located at (Norris et al. 1995). If this is the actual limiting redshift, a source population with a comoving rate density of the form is compatible with the BATSE distribution for (Horack et al. 1995). Therefore, it is worthwhile to examine whether the comoving merger rate density of neutron-star binaries evolves in a similar fashion.
By means of population synthesis computations for binary stars the merger rate of neutron-star binaries [hereafter ] can be computed (see Portegies Zwart & Yungelson 1998 and references therein). Using this approach Lipunov et al. (1995) computed the evolution of mergers as a function of redshift and distributions of GRBs for a cosmic population which contains galaxies with a constant star-formation rate and also galaxies with initial bursts of star formation in different proportions. Totani (1997) computed the evolution of the GRBs rate density from mergers in a model based on the observationally determined history of cosmic star formation and in a model derived from detailed galaxy evolution. Totani assumed a distribution of merging times for systems111Sahu et al. (1997) made similar computations for “cosmic” star formation history and a fixed merger time of yr.. We go a step further by adopting for all galaxies exponentially decreasing star formation rates (SFR) with different timescales depending on galaxy morphology (e. g. Sandage 1986). We apply the distribution of from model B of Portegies Zwart & Yungelson (1998, henceforth PZY98) which provides the best fit to the expected birthrate and orbital parameters of the Galactic population of high-mass binary pulsars.
2 Model
The annual birthrate is proportional to the SFR in the galaxy where is the timescale for star formation. The SFR adopted is a decreasing exponential, which appears when the SFR is supposed to be proportional to the gas content without taking into account the gas ejected by stars (e.g. Bruzual & Charlot 1993):
| (1) |
where the age of the galaxy is given by and the time at which the galaxy was formed. At any time the merger rate has a contribution from systems that are formed at different epochs in the history of that galaxy. It can thus be expressed as a convolution integral of the birthrate of stars and the distribution of merging times :
| (2) |
The results of the population synthesis computations give and the normalization coefficient . The function from PZY98 is approximated by a Gaussian with as a parameter, the maximum at and with =1 ( is the age of the galaxy at ). We assume that the distribution function , normalized to unity, is time-independent and the same for all galaxies. For the normalization of we require that in a reference galaxy similar to the Milky Way (type Sb, , with a current astration rate of ) the current rate of mergers is , which is the merger rate obtained for the Galaxy by PZY98.
For simplicity, we split the Hubble sequence into three types of galaxies: E to SO, Sa to Sb and Sc to Sd. For our selected mixture of Hubble types, two sets of characteristic star formation timescales are used (cf. Table 1). This parameterization is rather simplistic; the fraction of E/S0 galaxies may differ considerably from 20% (Dressler 1980) and the star formation history in spirals of the same morphological type may be a function of their mass (Gallagher et al. 1984). If indeed most stars in the Universe formed in dwarf star-burst galaxies (e. g. Babul & Ferguson 1996) at , this may affect our results considerably.
Star formation is assumed to occur continuously according to Eq.1 in all galaxies. We also investigate the case of an initial burst of star formation during the first Gyr in E-SO galaxies and no star formation thereafter. The latter models are denoted as sets1b and2b.
| Type | (Gyr) | |||
|---|---|---|---|---|
| set1 | set2 | [] | ||
| E - SO | 1 | 1 | 20 % | 10 |
| Sa - Sb | 4 | 6 | 40 % | 5 |
| Sc - Sd | 10 | 15 | 40 % | 2 |
The comoving rate density can be related to via the B-band luminosity density from the Universe (Efstathiou et al. 1988) where :
| (3) |
Here the summation is taken over all morphological types and is the contribution of each type of galaxy to the B-band luminosity of the Universe, is in solar units (see Table1).
The comoving rate density depends on the cosmological parameters and on the redshift of formation , via the relation for the age of galaxies relative to redshift: . We consider two cosmological models with and no vacuum energy: and (0.75,0.2) for which =12.16 and 9.92Gyr, respectively.
3 Application
Figure1 shows the redshift dependence of for several of our models. We normalize the merger rate density to unity at =0. The gray shaded area demonstrates that the results are basically consistent with the estimates derived from the GRB source distribution as observed by BATSE (Horack et al. 1995); the computed merger rate falls roughly in the allowed region for . Qualitatively, the behavior of is easily understood from Fig.2 which shows the relative contribution of galaxies of different types to the merger rate (for set 1). At high it is dominated by early-type galaxies with initially a high time-averaged SFR. In set Ib (upper solid line) the sudden drop at reflects the cessation of star formation in ellipticals in one Gyr after formation and the relatively short typical merger time of Gyr (PZY98). The more gradual decline of in set 1 reflects the continuous star formation in both elliptical and spiral galaxies. Comparison of sets 1 with 2 suggests that the evolution of is better described by the models with longer star-formation time scales. The lower solid line uses the same merger-time function as Totani (1997). This model predicts a lower merger rate.
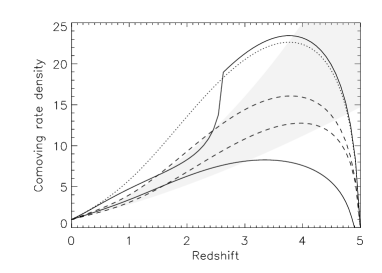

The upper and lower dashed lines in Fig.1 (set2) demonstrate the effect of the age of galaxies on the comoving merger rate, i. e.; the influence of the cosmological parameters.
Figure2 gives the relative contribution to the merger-rate density for each selected subclass of galaxies. The majority of events which are potentially detectable by gravitational-wave observatories (LIGO/VIRGO) are located in early-type spiral galaxies. If GRBs originate from coalescence the dimmest bursts are expected to be hosted in elliptical galaxies.
Following the standard procedure (e.g. Horack et al. 1996) we compute the number of bursts with a peak flux greater than . We assume that bursts are standard candles and the intrinsic luminosity doesn’t evolve. The spectral form of the burst similar to that observed is adopted: , where =350 keV is a characteristic energy. For comparison, we use the observed integral brightness distribution from the BATSE 3B catalog in the energy range 50-300 keV measured at a timespan of 1024 ms (Meegan et al.1996). Figure 3 shows the expected brightness distributions computed for sets of parameters 1 and 1b, superimposed on the BATSE data. The curves are normalized at the peak flux threshold =0.4 photonscm-2s-1. Figure4 provides the results of a Kolmogorov-Smirnov test of the BATSE 3B catalog to the results of our computations. Only data above the peak flux of 0.4 photonscm-2s-1 are used to avoid threshold effects. The highest confidence level (CL)is obtained for sets1 and 1b if the limiting redshift at the peak flux threshold is 2.4 and 3.0 respectively. For other values of the star formation timescales and cosmological parameters is found to range from 1.9 to 2.7 (with a CL) for the models with a burst of star formation in elliptical galaxies (models 1b and 2b). Without an initial burst of star formation ranges from 2.9 to 3.3. Similar results are found for in the range 300-400 keV.
Note that for higher limiting redshift, Fig.4 shows the existence of other possible fits with a lower CL (i.e. model 1b, ). The primary peak at corresponds to the first change of the slope of the comoving rate density (Fig.1). For higher redshifts, the sudden increase of the merger rate would require the same behavior of the BATSE data for consistency. As a consequence, the secondary peak at , although providing a good fit for peak flux values near the threshold, tends to depart more and more with the data for higher values of (Fig.3). Therefore, the redshift range related to an assumed initial burst of star formation in elliptical galaxies is likely to be beyond the actual limiting redshift for GRBs.
Finally, it has to be pointed out that the models can hardly reproduce the peak flux values of BATSE’s faintest bursts (see also Totani 1997). As shown by Reichard & Mészáros (1997), this feature results from the assumption that GRBs are standard candles.


4 Conclusion
The computed relative merger rate as a function of redshift is in agreement with the detected rate of -ray bursts up-to the limiting redshift of BATSE. For the models where elliptical galaxies experience an initial burst of star formation the occurrence rate of coalescence increases suddenly by more than a factor two at a redshift of 2.5, which is beyond our current detection limit. The synthetic distribution is compatible with the observations down to the completeness limit of -ray catalogues. The same is true for models based on observationally inferred cosmic star formation history (see e. g. Sahu et al. 1997) and for models based on galactic evolution (Totani 1997). They, however, predict a different behavior if star bursts occur at high .
The absolute value of the merger rate is found to be 100 times larger than the GRBs frequency. Escape from this conundrum is obtained if the opening angle of the observed phenomenon is a few degrees, which is consistent with fire-ball models where leptons are converted into bulk barionic motion (Mészáros & Rees 1992).
If -ray bursts indeed originate from mergers and our model for star formation is correct, interesting implications follow. The progenitors of bright GRBs or bursts at low redshift () most likely belonged to early-type spiral galaxies whereas the progenitors of the dimmest bursts and those at high redshift () were located in elliptical galaxies. The majority of the bursts of gravitational waves in this model are expected to originate from early-type spiral galaxies. If most stars in the Universe formed in dwarf star-burst galaxies, a substantial fraction of the parental population may originate from them. Suggested by current observational data the decline in the star formation rate beyond (e. g. Connolly et al. 1997), if real, will show-up as a turn over in the distribution for GRBs.
As noticed by Tutukov & Yungelson (1994) and confirmed by PZY98 (their Figs. 6 and 8), space velocities of binaries may well exceed escape velocities of dwarf as well as giant galaxies and they may travel up to Mpc before coalescence. Thus, a significant fraction of the sites of GRBs may not be directly associated with star forming regions.
-
Acknowledgements.
We thank Jan van Paradijs for reading the manuscript. This work was partially supported through NWO Spinoza grant 08-0 to E.P.J.van den Heuvel and RFBR Grant 96-02-16351. L.R.Y acknowledges hospitality of the Astronomical Institute “Anton Pannekoek” and Meudon Observatory.
References
- Babul, A., Ferguson, H. C. 1996, ApJ 458, 100
- Blinnikov, S.I., Novikov, I.D., Perevodchikova, T.V., Polnarev, A.G. 1984, SvAL 10, 177
- Bond, H. 1997, IAU Circ. 6654
- Bruzual, G.A., Charlot, S. 1993, ApJ 405, 538
- Connolly, A.J., Szalay, A.S., Dickinson, M., et al. 1997, ApJ 486, L11
- Dermer, C.D. 1992, Phys. Rev. Lett. 68, 1799
- Dressler, A. 1980, ApJ 236, 351
- Efstathiou, G., Ellis, R.S., Peterson B.A. 1988, MNRAS 232, 431
- Gallagher, J. S., Hunter, D., Tutukov, A.V. 1984, ApJ 284, 544
- Groot, P.J., Galama, T.J., van Paradijs, J., et al. 1997, IAU Circ. 6584
- Guiderdoni, B., Rocca-Volmerange, B. 1987, A&A 186, 1
- Horack, J.M., Emslie, A.G., Hartmann, D.H. 1995, ApJ 447, 474
- Horack, J.M., Mallozzi, R.S., Koshut, T.M. 1996, ApJ 466, 21
- Lipunov, V.M. Nazin S.N., Panchenko I.E., et al. 1995, A&A 298, 677
- Mao, S., Paczyński, B. 1992, ApJ 388, L45
- Meegan, C.A., Pendleton, G.N., Briggs, M.S. et al. 1996, ApJS 106, 25
- Mészáros, P., Rees, M.J. 1992, ApJ 397, 570
- Metzger, M.R., Djorgovski, S.G., Kulkarni, S.R., et al. 1997, Nat 387, 878
- Norris, J.P., Bonnell, J.T., Nemiroff, R.J., et al. 1995, ApJ 439, 542
- Phinney, E.S. 1991, ApJ 380, L17
- 1 Portegies Zwart, S.F., Verbunt, F. 1996, A&A 309, 179
- Portegies Zwart, S. F., Yungelson, L. R. 1998, A&A in press (astro-ph/9710347)
- Reichard, D.E., Mészáros, P. 1997, ApJ 483 597
- Sahu, K.C., Livio, M., Petro, L., et al. 1997, ApJ 489, L127
- Sandage, A. 1986, A&A 161, 89
- Tutukov, A.V., Yungelson, L.R. 1994, MNRAS 268, 871
- Totani, T. 1997, ApJ 486, L71