Testing the COBE/IRAS All-Sky Reddening Map Using the Galactic Globular Clusters
Abstract
We live in a dusty Universe, and correcting for the dust extinction and reddening affects almost all aspects of the optical astronomy. Recently Schlegel, Finkbeiner & Davis published an all-sky reddening map based on the COBE/DIRBE and IRAS/ISSA infrared sky surveys. Their map is intended to supersede the older Burstein & Heiles reddening estimates. In this paper I test this new reddening map by comparing the reddening values for a sample of 110 Galactic globular clusters selected from compilation of Harris. I find a good agreement for globular clusters with galactic latitude and fair overall agreement for globular clusters with , but with several significant deviations. I discuss four individual clusters with largest deviations, NGC 6144, Terzan 3, NGC 6355 and IC 1276, in order to investigate the reasons for these large deviations. It seems that the new reddening map overestimates the reddening in some large extinction regions. However, with its high spatial resolution the new reddening map can be used to estimate the relative variation of the reddening on scales .
1 INTRODUCTION
We live in a dusty Universe (Hoover 1998, private communication), and correcting for the dust extinction and reddening affects almost all aspects of optical astronomy. For us, observing from within the Milky Way, it is of crucial importance to know how much Galactic dust there is towards various objects. Burstein & Hailes (1982; hereafter: BH) constructed an all-sky reddening map, used extensively by the astronomical community.111Their paper was cited 540 times between 1992 and 1997 Recently, Schlegel, Finkbeiner & Davis (1998; hereafter: SFD) published a new all-sky reddening map, based on the COBE/DIRBE and IRAS/ISSA maps.222The reddening map and related files and programs are available using the WWW at: http://astro.berkeley.edu/davis/dust/ This map is intended to supersede the BH map in both the accuracy (16%) and the spatial resolution (). Indeed, the potential of the SFD reddening map is immediately apparent after examining their Fig.7. It is therefore important to independently test the SFD map to determine the accuracy of the predicted reddenings.
In this paper I use an electronic catalog of the Galactic globular clusters compiled by Harris (1996) to test the SFD map. In Section 2 I compare the values of reddening and discuss the dependence of the deviations on various properties of the GCs. In Section 3 I discuss several individual GCs for which the derived deviations are the largest.
2 COMPARISON BETWEEN THE REDDENING VALUES
Harris (1996) surveyed the vast literature on the Galactic globular clusters (GCs), producing an electronic catalog333The catalog is available using the WWW at: http://www.physics.mcmaster.ca/Globular.html of GCs with reasonably well-known properties, among them the reddening . Many Galactic globular clusters are extensively studied objects, for which it is possible to accurately determine their extinction and reddening using a variety of methods (Burstein & Heiles 1978; Webbink 1985; Zinn 1985; Reed, Hesser & Shawl 1988). However, many GCs in Harris (1996) compilation have been poorly studied, in which cases the reddening estimates are rather inaccurate.
The additional advantage of GCs comes from their distribution on the sky, which, although concentrated towards the Galactic center, has a sizeable number of GCs scattered across the whole sky. This assures that there is s good sample of GCs far enough from us that we “intercept” most of the interstellar reddening when observing a cluster. Burstein & Heiles (1978) used a sample of 49 globular clusters with to test their method of the reddening determination.
There are 147 GCs in the catalog of Harris (1996), out of which I excluded two which had no distance information. For the remaining 145 clusters I used the program “dust_getval” included with the SFD reddening map to obtain the value of reddening predicted by the SFD, which I hereafter call . This was done by obtaining 49 values of on a uniform grid with spacing centered on the cluster ( part of the sky), which allowed me to obtain an average value of as well as its standard deviation . At this point I excluded 35 GCs with ’no_list’ flag, which were mostly clusters with the galactic latitude , but also two GCs which fell into the region of the sky not scanned by IRAS. This leaves me with 110 GCs with which I can test the SFD map. I denote the reddening obtained using the catalog of Harris by .
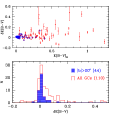
In the upper panel of Figure 1 I plot the values of the deviations between the SFD values and the Harris’ values as the function of , with as errorbars. In the lower panel of Figure 1 I show the histogram of the deviations for all 110 Galactic globular clusters and for the subset of 44 GCs with (shaded). The reddening extends from 0.0 to 1.24 and the deviations cover .
The distribution of is skewed towards the positive values, which might be to some extent expected. The SFD map gives, by its construction, a total dust emission (converted to reddening) along given line of sight, so it could be expected that the GCs, located at some finite distance from us, are subject to only some fraction of the total reddening. The subset of GCs with shows a much smaller values of , with only one cluster with mag. However, the sample shows a significant number of large deviations mag, including four clusters with mag. This can result from number of effects:
-
1.
Inaccurately determined for the region of the sky (or part of it containing large number of GCs, i.e. region close to the Galactic center), which on average is subject to significantly more dust reddening than the high galactic latitude regions (Figure 1, upper panel). As noted by SFD (their Fig.6) when calibrating the COBE/IRAS map, their highest reddening values appear to be overestimated. This could be caused by the ratio being significantly different from the value of 3.1, assumed to hold universally by SFD, in some high extinction regions.
-
2.
Poorly determined for some of the clusters.
-
3.
The finite distance to the globular clusters, which for small values of the galactic latitude could translate to some Galactic dust behind the clusters.
It is possible that all of the above contribute to the large deviations mag found. In the next Section I will discuss in some detail the four clusters with the largest deviations trying to determine which effect might be the dominant one.
3 INVESTIGATING THE DEVIATIONS
In the upper panel of Figure 2 I show part of the sky centered on the Galactic center, with the globular clusters plotted as small dots. For each cluster I also plot a circle with radius proportional to its , with the largest circle corresponding to mag. The shaded region correspond to the part of the Galaxy, from which the globular clusters were removed. All four GCs with mag are located in the northern Galactic hemisphere and are relatively close to each other on the sky.
| Name | |||||||
|---|---|---|---|---|---|---|---|
| NGC 6144 | 0.32 | 351.9286 | 15.6990 | 10.1 | 9.6 | 2.7 | |
| Terzan 3 | 0.32 | 345.0765 | 9.1868 | 26.4 | 25.2 | 4.2 | |
| NGC 6355 | 0.75 | 359.5849 | 5.4277 | 7.1 | 7.0 | 0.7 | |
| IC 1276 | 0.92 | 21.8321 | 5.6685 | 9.3 | 8.6 | 0.9 |
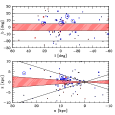
In the lower panel of Figure 2 I plot the GCs in the x-z plane, perpendicular to the plane of the Galaxy, with the Sun at . The symbols are the same as in the upper panel of Figure 2. The clusters are concentrated towards the Galactic center, and so are the GCs with the largest values of , most of them positive. This could indicate that the cause of the large deviations found is the presence of significant amounts of dust beyond the Galactic center, causing a real difference between the reddening values measured towards some of the GCs and the total reddening along these lines of sight. However, at from the Sun the galactic latitude of corresponds to the distance from the Galactic plane of , which is significantly larger than expected for significant amounts of dust to be present (e.g. Méndez & van Altena 1998). However, as argued by SFD in their Section 7.3, it might be plausible that such high- material exists.
I select four GCs with the largest deviations mag (all of them positive). Their properties, selected from Harris (1996), are in Table 1. For each cluster I give its name, both values of reddening and (along with its standard deviation), galactic longitude and latitude , distance from the Sun and the distance components in a Sun-centered coordinate system, where points toward the Galactic center and toward the North Galactic Pole. I will now discuss each cluster in some detail trying to determine the possible cause for the large .
NGC 6144
The value of for this cluster comes originally from Bica & Pastoriza (1983), who used an average of their value based on the integrated photometry and value of of Alcaino (1980), based on color-magnitude data. Alcaino (1980) noted that the extinction for this cluster increases towards the NE direction. Indeed, using the SFD map for a grid discussed earlier in the paper I find gradient of from 0.48 to 1.11. Given this large range of , large deviation for this cluster could be spurious. As noted by Webbink (1985), many clusters with suffer nonuniform extinction, which is confirmed by large values of for these clusters (Figure 1). As it turns out both NGC 6144 and a neighboring M4 globular cluster are located on the sky close to the Ophiuchus molecular cloud complex (de Geus, Bronfman & Thaddeus 1990). Huterer, Sasselov & Schechter (1995) analyzed the consistency of two distance estimates for M4 and found that it requires a non-standard ratio of total to selective extinction .
Terzan 3
This is a poorly studied globular cluster with no color-magnitude data, for which the was estimated by Webbink (1985) using a modified “cosecant law”, an educated guess at best. It seems therefore justified to replace by the value of , which has the effect of reducing its -band distance modulus by mag, and therefore reducing its distance from to .
NGC 6355
The value of was adopted by Webbink (1985), based on integrated photometry of the cluster, which as discussed by Webbink is a secondary method of medium accuracy. As for NGC 6144, the SFD map gives a large gradient of from 0.96 to 1.50 on the grid centered on the cluster.
IC 1276
The value of was adopted by Webbink (1985), based on integrated photometry of the cluster. The SFD map gives only a modest range of from 1.26 to 1.46.
4 DISCUSSION
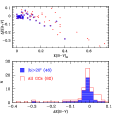
It might be also interesting to compare the deviations between the values of and those predicted by the BH map, which I denote . In Figure 3, analogous to Figure 1, I plot the deviation . Since the BH map excludes objects with , there is fewer (82) GCs now, with smaller range of . There is a clear trend between and , indicating that the BH map underestimates the value of reddening, especially in high reddening regions. As noticed by SFD, even in high galactic latitude regions there is a systematic offset of mag between the SFD and the BH maps, with the BH map predicting lower values of the reddening. Comparing Figures 1 and 3, it is clear that overall the SFD map does a much better job in predicting the reddening values of the Galactic globular clusters.
To summarize, the SFD map predicts well the reddening for most of the globular clusters in the Harris (1996) sample, especially for the clusters. It is however possible that it overestimates the reddening in some large extinction regions, such as in the case of NGC 6144, NGC 6355 and IC 1276 discussed above, although it might be that the estimates based on the integrated properties of globular clusters are at fault here (see discussion in Burstein & Hailes 1978). In any case, the SFD map is a very valuable tool in predicting large reddening gradients on scales of . Further tests of the SFD map would be most useful, using for example field RR Lyrae stars (Burstein & Hailes 1978), such as the sample of Layden (1998), but with reddenings not based on the BH map.
References
- (1)
- (2) Alcaino, G., 1980, A&AS, 39, 315
- (3)
- (4) Bica, E. L. D., & Pastoriza, M. G., 1983, Ap&SS, 91, 99
- (5)
- (6) Burstein, D., & Hailes, C., 1978, ApJ, 225, 40
- (7)
- (8) Burstein, D., & Hailes, C., 1982, AJ, 87, 1165 [BH]
- (9)
- (10) de Geus, E. J., Bronfman, L., & Thaddeus, P., 1990, A&A, 231, 137
- (11)
- (12) Harris, W. E., 1996, AJ, 112, 1487
- (13)
- (14) Huterer, D., Sasselov, D. D., Schechter, P. L., 1995, AJ, 100, 2705
- (15)
- (16) Layden, A. C., 1998, AJ, 115, 193
- (17)
- (18) Méndez, R. A., & van Altena, W. F., 1998, A&A, in press (astro-ph/9710030)
- (19)
- (20) Reed, B. C., Hesser, J. E., & Shawl, S. J., 1988, PASP 100, 545
- (21)
- (22) Schlegel, D. J., Finkbeiner, D. P., & Davis, M., 1998, ApJ, in press (astro-ph/9710327) [SFD]
- (23)
- (24) Webbink, R. F., 1985, in “Dynamics of Star Clusters”, IAU Symposium 113, eds. J.Goodman and P.Hut (Dordrecht: Reidel), 541
- (25)
- (26) Zinn, R., 1985, ApJ, 293, 424
- (27)