Spectra of GRB 970228 from the Transient Gamma-Ray Spectrometer
Abstract
Visible afterglow counterparts have now been detected for two GRBs (970228 and 970508) but are absent, with ratios at least two orders of magnitude lower, for other GRBs, e.g., 970828. The causes of this variation are unknown. Any correspondence which could be discovered between the -ray properties of a GRB and its would be useful, both in determining the GRB mechanisms, and in allocating resources for counterpart searches and studies. This paper presents the -ray spectra of GRB 970228 as measured by the Transient Gamma-Ray Spectrometer and comments on characteristics of this GRB compared to others that do and do not have observable counterparts.
Introduction
The detection of counterparts to GRBs has revolutionized the field, firmly establishing that at least some GRBs are highly energetic objects at cosmological distances (see numerous other papers in these Proceedings). As is the case with most other observable parameters of GRBs, the luminosities of afterglow counterparts vary over a wide range among bursts. For example, GRB 970828 was brighter in -ray flux and fluence than GRB 970508, yet it showed no optical counterpart, with an upper limit more than 4 magnitudes dimmer than the peak measured for the 970508 optical transient.
By definition, all GRBs have strong -ray emission, and in most cases -ray measurements are the only available data on which to base follow-up observations. With the limited resources available at short notice, it is often necessary to select for further study only those GRBs which are most likely to produce counterpart detections. This is likely to cause selection effects in the long term (if early experience suggests e.g., that only long-duration bursts have counterparts, then no counterparts to short-duration GRBs will be sought and found). In the short term, it is an unfortunate reality.
GRB 970228, the first GRB to show an optical counterpart, was observed by the Transient Gamma-Ray Spectrometer (TGRS), a 35 germanium spectrometer operating on the WIND spacecraft tgrs95 . TGRS is exposed only to the Southern ecliptic hemisphere, and so it did not see the only other GRB which has so far yield an optical counterpart: the Northern hemisphere GRB 970508. TGRS spectra of other GRBs which had no comparable optical counterpart will be the subject of a later paper.
Analysis Techniques
We use the ‘forward convolution’ method to fit the measured, background-subtracted ‘counts spectra’ of deposited energy to spectral models and to obtain photon spectra. We use a detector response matrix calculated by a Monte Carlo codetgrs95 (simulated with incidence angle for this GRB). Although this produces model-dependent results for the photon spectra, the dependency tends to be small for smooth continuum models over energy ranges where the instrument has good efficiency.
Data and Results
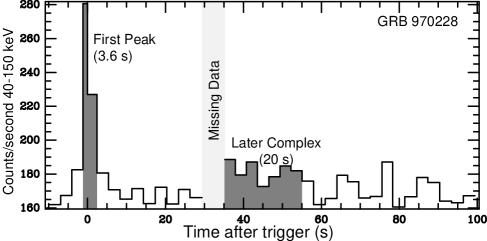
Figure 1 shows the 40-150 keV light curve of this burst as seen by TGRS. The temporal resolution is set by the binning of the 0-190 keV histogram data type used in this analysis. Events at energies above 190 keV are recorded individually and combined with the histogram data to produce spectra up to 8 MeV. The typical resolution below 1 MeV is 2-4 keV. The two intervals of this GRB which will be discussed in this paper are marked as the ‘first peak’ and the ‘later complex’ on the light curve. The missing data before the later complex does not contain significant flux, as verified by light curves produced using other TGRS data types and by other instruments hurley97 . Observations of this burst by the instruments on the BeppoSAX spacecraft show that the later complex consists of three softer pulses peaking at approximately 40, 52, and 70 seconds after the trigger time, with the 40 s pulse exceeding the amplitude of the first pulse in the 2-10 keV band frontera97 . The 70 s pulse is too weak in our energy band to contribute significantly, so it is excluded from this analysis.
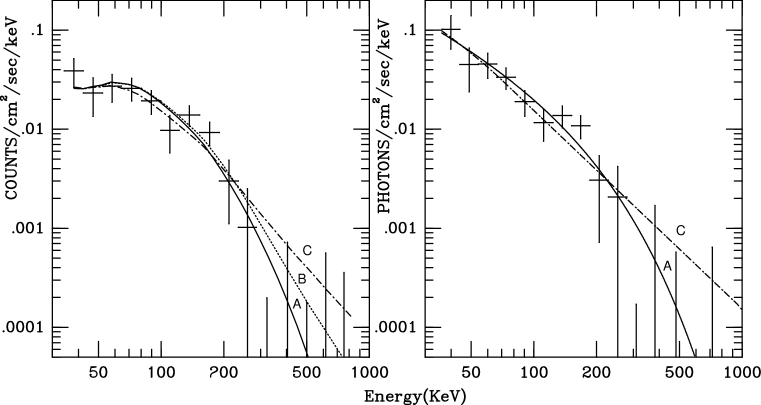
Figure 2 shows the spectrum of 3.6 s period labeled ‘first peak’. The three model fits shown are an Optically Thin Thermal Bremsstrahlung (OTTB) and two Band model spectra. The Band modelbandmod is a spectral form with a low energy power law, rolling over exponentially to a high energy power law. For the special case of and , this form is equivalent to the OTTB form . The Band model has been quite successful in matching the spectral shapes of GRBs (within the limits of the resolution and sensitivity of the current generation of instruments) and has the added advantage of being a purely mathematical form with no misleading implications about the physical processes of the GRB. Likewise, the use of an OTTB spectral form should not be taken to imply that the emission process is bremsstrahlung, nor that the emitter is optically-thin.
When the first peak spectrum is fit with a Band model with all parameters free, , the high-energy index, tends towards and takes on a value near -1. This implies that an OTTB would fit this spectrum well, and indeed it does, with parameter keV giving d.o.f., shown as the solid Line A in Figure 2.
Pendleton et al.nhe have found that pulses in GRBs can be classified as either High-Energy or No-High-Energy (HE or NHE) pulses, where NHE pulses have no detectable emission above 300 keV. A burst may be composed purely of one type of pulse, or may be mixed. HE pulses typically have Band . By constraining we can set upper limits on the strength of the high-energy emission from a spectrum. For the first peak, constraining the fit to gives an acceptable d.o.f. ( with one additional unconstrained parameter, shown by the dotted Line B), but is excluded with d.o.f. (, the dash-dotted Line C). Thus, we consider the first peak of the GRB to be an NHE pulse.
From the photon spectral models, we can determine fluences for these GRBs. In the 50-300 keV energy band, the fluence of this peak during these 3.6 seconds is , where the error range covers all three models. The estimated fluence for the 300-1000 keV energy range is much more model dependent, with values of for the [OTTB, , ] models, respectively. This demonstrates the need for a good spectral model for determining the fluence of a GRB outside a detector’s sensitivity range. (Indeed, a model has infinite energy fluence when extrapolated to high energies.)
If we make the simplifying assumption of no spectral evolution during the analyzed 3.6 seconds of the first peak, we can pro-rate this fluence by the light curve to find that the peak flux, over the 1.2 second first bin of this peak, is for the 50-300 keV band.
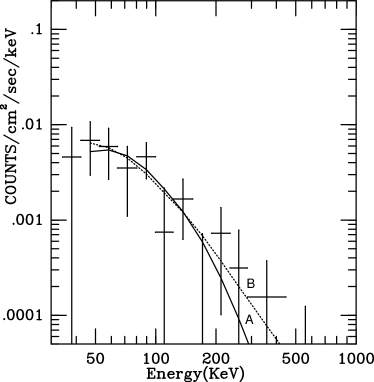
Figure 3 shows the counts spectrum of the 20 seconds we have analyzed in the later complex. This series of peaks has lower flux in our energy range than the first peak, and so the measurements have more fractional statistical error due to background counts. An OTTB and a single power law fit the data about equally well, with a slight advantage () to the power law with . A second power law (as in the Band model) is not required by the data at our level of sensitivity. The fluence for this period is for 50-300 keV, and for 300-1000 with [OTTB, ] models.
Discussion
GRB 970228, one of the two bursts known so far to have an optical counterpart, has at least one NHE pulse. Since NHE pulses seem to be rarer than HE pulses (albeit with an extreme selection bias) it is natural to wonder whether optical counterparts are produced only by NHE GRBs. The only other GRB with an optical counterpart, 970508, provides a counterexample. This GRB was seen by BATSE to be hard, with a fluence above 300 keV that was twice the fluence for 25-300 keV batsecat .
A comparison between 970228 and 970508 shows that the GRB spectrum (or at least the existence of NHE peaks) is not immediately successful in predicting the existence of an optical counterpart. The case of 970828 shows that -ray flux and fluence are not good predictors either. At our current state of knowledge, it seems that the most reliable way to determine whether a GRB has an optical counterpart is simply to look.
References
- (1) Seifert, H., et al., in Gamma-Ray Bursts, 3rd Huntsville Symposium, eds. C. Kouveliotou, M.F. Briggs, G.J. Fishman, AIP Conf. Proc. 384 (New York: AIP) pp. 258-262 (1995).
- (2) Hurley, K., et al., ApJL, in press astro-ph/9705128 (1997).
- (3) Frontera, F., et al., ApJL, in press astro-ph/9711279 (1997).
- (4) Band, D.L., et al., ApJ 413, 281 (1993).
- (5) Pendleton, G.N., et al., ApJ 489, 175 (1997).
- (6) Meegan, C., et al., BATSE catalog, Trigger 6225 http://www.batse.msfc.nasa.gov/data/grb/catalog/flux.html (1997).