Near Infrared Observations of the Local Arm
Abstract
Observations of the Local Arm have been carried out in the near-infrared with the 1.5 m “Carlos Sánchez” telescope in Tenerife. A model of the disc with adjustable parameters fitted to reproduce the DIRBE-COBE survey, has been subtracted from the observational data in order to obtain a clean map of the Local Arm, uncontaminated by other components of the disc. The arm is more than 70 pc over the plane and is wider than 200 pc. At a latitude of about the deviation of the arm from the galactic plane is so large that was only partially observed with our observational window of . The elevation over the plane vanishes and the width decreases as the Arm comes closer to the Sun.
Key Words.:
Galaxy: General – Galaxy: Structure – Infrared: Galaxy1 Introduction
Because of its proximity, considerable attention has been paid to the spiral feature known as the Local Arm. Optical and 21 cm observations have long been available. Buss et al. (1994) in the ultraviolet, Fatoohi et al. (1996) in gamma-rays, Oliver et al. (1996) in CO, have, more recently, among others, reported observations at other wavelengths. Dynamic properties have been analyzed by Palous (1987), Comeron & Torra (1991) and others.
In the near infrared, recent surveys (e.g. Odenwald & Schwartz 1993; Freudenreich et al. 1994; Garzón et al. 1993) have provided significant information, but the application of these to the study of the Local Arm has been insufficient. Ortiz & Lepine (1993) themselves found their description of the Local Arm to be unsatisfactory. More infrared observations are necessary and the main purpose of this work is to compensate for this shortcoming.
We report our own observations with the 1.5 “Carlos Sánchez” telescope in Tenerife, used to search the infrared morphology of the closest spiral feature; this was undertaken bearing in mind the following goals:
1.- To observe the first quadrant region of the arm, which in practice limits attention to the longitude range . Observations extend to slightly higher longitudes, but here interpretation becomes difficult because the arm is too close.
2.- To use high spatial resolution techniques in order to observe individual stars. We determine stellar counts instead of total fluxes. We can in this way perform detailed analysis at various magnitude ranges. The immediate advantage is that this procedure constitutes a natural filter: very bright magnitude stars must, necessarily, be nearby. The importance of the contribution of other components is thus minimized. This probably compensates for the considerable observation time, which in practice means a reduced number of scans. COBE data, for instance, are poorer resolution flux data, and are therefore less suitable to study a close feature like the Local Arm, as they are contaminated by the contribution of larger scale features behind it.
3.- To discriminate between the different contributions to the star counts from other galactic components, mainly the exponential component of the disc. It is to be emphasized that the northern warp of our galaxy is just behind the Local Arm in its first quadrant portion.
2 Observations
Observations were made as part of the TMGS (“ Two Micron Galactic Survey”) (Garzón et al. 1993; Hammersley et al. 1994; Calbet et al. 1995) carried out by the IAC (Instituto de Astrofísica de Canarias). The aim is the survey in the K-band of the galactic plane with a 15 arcsec resolution and a 10.5 limit magnitude (Calbet, 1993); therefore, individual stars are observed, so that position and magnitude are determined for each star. Before the observations made for this work, the survey was mainly devoted to the galactic centre and the order of scans was altered to observe the galactic longitude zone, where the Local Arm lies. The original purpose was the study of the north warp in the near infrared, but in this zone the emission is dominated by the Local Arm. The obtained data were therefore used to describe the NIR Local Arm.
For TMGS the 1.5 m NIR “Carlos Sánchez” telescope is used. The telescope is located in Tenerife at 2400 m altitude. Scans are obtained by switching off the right ascension telescope motor, and thus constant declination scans are obtained, taking advantage of terrestrial rotation. We do not further describe the observation techniques and the system for data acquisition and processing as this has been extensively done on previous occasions (Hammersley 1989; Garzón et al. 1993)
In Fig. 1 we show the scans used in the present work. An interpolation technique was carried out in order to have values at each point in a mesh (also reproduced in the figure) with constant and constant

3 Results
To isolate the contribution from the Local Arm, it is necessary to subtract the background emission, which is mainly due to the exponential component of the disc. It is very important to take into account the north warp, for which the maximum deviation is near the direction of interest here. Moreover, both the warp and the optical Local Arm are observed over the mean galactic plane. It is therefore necessary to use a model of the exponential component of the warped disc.
In a recent paper, Porcel et al. (1997) developed a model of the warped disc, which was used to interpret the data from DIRBE (“Diffuse Infrared Background Experiment ”) (Freudenreich et al. 1994) on board COBE (“Cosmic Background Experiment”). They have shown that either the stellar disc is noticeably less warped than the gas, or a truncation of the stellar disc, taking place not far from the Sun, prevents comparison between the stellar and the gaseous warps. In this latter case, the truncation radius cannot be larger than 13 kpc.
We will now use the same model to undertake the subtraction. First of all, we must adjust the parameters of this model for a better fit to the COBE observations. Suppose that we adopt the first interpretation, i.e. that the stellar warp is smaller than the gas one. Suppose that both warps are related at all galactocentric radii by a constant. In other words, let be the stellar warp curve and the gaseous warp curve: then, we assume , where is less than unity and is one of our adjustable parameters.
The other two adjustable parameters are , the Sun’s height over the mean plane and , the galactocentric azimuth of the maximum deviation from the mean plane due to the warp. After comparison of the COBE results with a family of our three-parametric models, we deduced that the best fit is obtained for the following set of parameters: , , . To obtain this family of parameters we benefited from the fact that they can be in principle obtained independently. The value of the mean depends on and not on the others parameters. The value of similarly is obtainable from a displacement of the origin alone, independent of the other parameters. These facts provided a very limited range of possible values, which were, on the other hand, similar to current values typically adopted in other papers. What was considered a main object of this paper, and therefore with much more detail, was the obtention of the value of , considered implicitly to be one in most previous papers. A numerical least squares method provided the value of . After trials with different close values we estimated the error to be about 0.1.
The first two values for and are typical, just confirming those found by various authors, and lie close to currently adopted values. The value of , on the other hand, is striking, as unity is an implicitly assumed value in most gravitational models of the warp (see Binney 1992 and Combes 1994, for a review). Under this interpretation, the stellar warp is roughly half the gas warp.
We have not included the extinction in our computations. Being the infrared extinction coefficient so small, it was demonstrated in the previous model by Porcel et al.(1997) that the results are noticeably insensitive to extinction, even when studying so distant features as warps. The effect of extinction is clearly much less important for a very close feature, as the Local Arm.
Within the region of the Local Arm, we now subtract the data of the best fit model with , and from the near-infrared data obtained by the ground-based telescope at Tenerife to obtain a clear map of the Local Arm. The mean latitude of the L-band flux predicted by the best fit model is reproduced in Fig. 2, together with the same data from DIRBE. The fitting cannot account for the observational values in galactic latitudes , i.e. the region of the Local Arm.

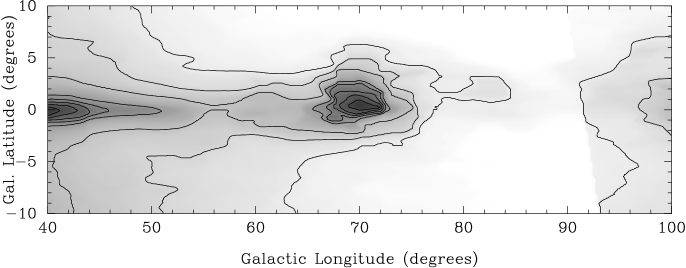
Of course, the Local Arm is necessarily present in the DIRBE data. This is clear in Fig. 3, where we show the 12 m flux contour maps obtained from DIRBE data for the region of interest.
Our procedure is correct because of the very different angular extent of the warp and the Local Arm. We used data to deduce the best fit model using DIRBE, and then applied this model to study a small feature, as the Local Arm is only in longitude. Fortunately for us, the Local Arm is larger (see for instance, Becker & Fenkart, 1970) but is angularly small because it passes through the Sun. To obtain the fitting parameters the zone outside the Local Arm was considered with a greater weight.
Suppose, on the other hand, that we adopt the second interpretation of the apparent smallness of the stellar warp, i.e. that it is due to a truncation of the stellar disc, which therefore does not reach the zone of highest warp. Though this explanation is plausible and physically very different in the interpretation of warps, the distinction is not important for our present purposes, because the truncated disc produces the same map to be subtracted from the ground-based data.
In Fig. 4 we plot the contour maps corresponding to the Tenerife observations, for the number of stars with .
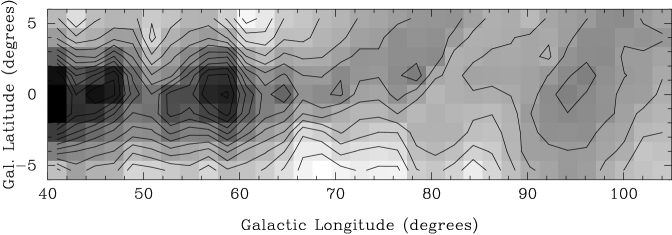
Figure 5 shows the same plot for stars with . The first map includes nearly all observed stars; the second map may be more interesting for our purposes, as nearly all stars belong to the Local Arm. Some bright stars may not belong to the Local Arm, but the number of distant stars must be so scarce, that the distribution of in the expected region of the Local Arm is the best way to define its geometry. Latitude profiles for four longitudes, , , and are very illustrative to see how the contribution of the Local Arm is apparent over the emission of the rest of the disc (Figs. 6a-d). These profiles reasonably match what is to be expected from the model outside the Local Arm region. This fact is appreciated at longitude where the arm lies outside, but in the Local Arm the profile varies from the model. At , the great extension in latitude is noticeable, as observational data do not show any clear dependence on latitude.
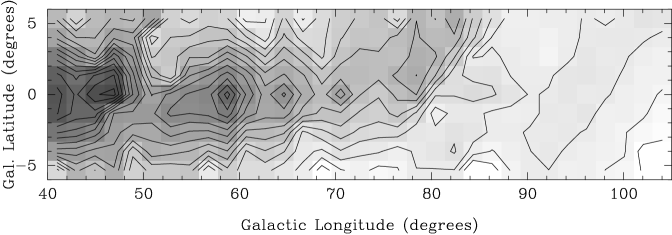

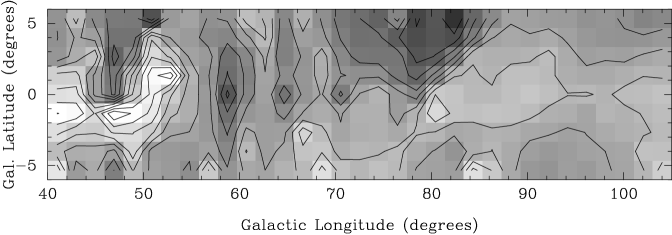
Figure 7 is the final objective of this work, which is clear contour maps of the Local Arm without contamination from the exponential component of the warped thin disc. The Arm is clearly seen with values of stars per square degree higher than 130, at a longitude of in the North. There is also visible a large extension in latitude at longitudes between and . This thickening of the disc is produced by the proximity of the Local Arm to the Sun. We then see two properties of the Arm. It is oriented towards the Sun with a net elevation above the disc and is (angularly) very thick.
4 Conclusions
In order to better interpret Fig. 7, we calculated the curve [mean b,l] to quantify the elevation of the Local Arm over the mean plane. This is depicted in Fig. 8.

As the projected configuration of the arm is reasonably well known from Becker & Fenkart (1970) we have also plotted [mean z,l] in Fig. 9. The projected configuration of the arm is a logarithmic spiral with parameters taken from Wainscoat et al. (1992). Furthermore, longitude can be translated into real distance , which is exactly the length along the arc, taking as the origin a point in the arm where , about 3000 pc away. Figure 10 shows the curve [mean z,]. The arm is elevated about 70 pc and this elevation decreases when the arm comes closer to the Sun, where the elevation practically vanishes. The other part of the arm lies in the direction around and cannot be observed in the northern hemisphere.


We have also calculated the width of the arm, and Fig. 11 shows the [width,] curve. It must be interpreted with caution: as scans are limited in latitude () the arm width and the arm mean position are underestimated. We have seen that the angular width of the arm becomes very large close to the Sun. But when angles are translated to real widths, we see that the arm is thinner as the Sun is approached. At =0 the width is larger than 200 pc.

In Fig. 7 a sharp peak is observed around . The identification of this feature is not easy but it is clear that it corresponds to a real peak in the number of stars found in that direction, and not to an error in the reduction processes. Such a peak is not observed in the DIRBE data. Possible explanations should take into account the patchy nature of the absorbing clouds, and the different resolution of DIRBE and our data, but we have not found a relation with any other known feature of the galaxy, nor with detectable especial features in CO or 21 cm maps.
At a galactic latitude around , a large and unexpected deviation of the arm with respect to the mean plane prevents us to obtain reasonable values of the mean position of the Local Arm, so that the values in our Fig. 8 are highly underestimated. The Arm is to a great extent outside the small observation window of . Clearly, future observations should be carried out for in order to assure better observing conditions and better quantitative results. Nevertheless, even if incomplete, our map in figure 8 constitutes a first observation at this wavelength. This fact together with the substraction of the foreground sources which has been carried out, makes our observations an important source of information to study the closest known spiral arm.
There is a very noticeable agreement between our [mean z,l] curve and the similar one obtained by Kolesnick & Vedenicheva (1978). This agreement is mainly due to the fact that we are actually observing young stars. Near infrared surveys are usually used to trace the distribution of old stars, but due to the proximity of the Local Arm, what we are mainly observing are OB stars with . Nevertheless observations at different wavelengths must be obtained even if they confirm the optical description. Our map, on the other hand, is uncontaminated by other sources, i.e. by the exponential component of the disc, warp included. This is important, as the positions of the arm and the north warp maximum are found in the same direction.
Figure 12 represents the geometrical configuration of the Local Arm, when viewed from approximately the galactic centre.

Acknowledgements.
The COBE data sets were developed by the NASA Goddard Space Flight Center under the guidance of the COBE Science Working Group and were provided by the NSSDC.References
- (1) Becker W., Fenkart R., 1970. In The Spiral Structure of our Galaxy IAU symp. 38, ed. W. Becker y G. Contopoulos.
- (2) Binney J., 1992. ARA&A 30, 51.
- (3) Buss R. H. Jr., Allen M., McCandliss S., Kruk J., Liu Ji-Cheng, 1994. ApJ 430, 630
- (4) Calbet X., 1993. PhD thesis. University of La Laguna.
- (5) Calbet X., Mahoney T., Garzón F., Hammersley P. L., 1995. MNRAS 276, 301
- (6) Combes F., 1994. In The formation of galaxies, ed. C. Muñoz-Tuñon and F. Sánchez. Cambridge University Press.
- (7) Comeron F., Torra J., 1991. A&A 241, 57
- (8) Hammersley P. L, 1989. PhD thesis . University of London.
- (9) Hammersley P. L., Garzón F., Mahoney T., Calbet X., 1994. MNRAS 269, 753
- (10) Fatoohi L.J., Giller M., Wdowczyk J., Wolfendale A. W., Zhang L., 1996. A&AS 120, 407
- (11) Freudenreich H. T., Sodroski T.J., Berriman G. B. et al., 1994. ApJ. 429, L69
- (12) Garzón F., Hammersley P. L., Mahoney T. et al., 1993. MNRAS, 264, 773
- (13) Kolesnick L. N., Vedenicheva I. P., 1978 A&A 76,128
- (14) Oliver R. J., Masheder M. R. W., Thadeus P., 1996. A&A 315, 578
- (15) Odenwald S.F., Schwartz P. R., 1993. ApJ 405,706
- (16) Ortiz R., Lepine J., 1993. A&A 279, 90
- (17) Palous J., 1987. In European Regional Astronomy Meeting of the IAU, 10th, Prague,Czechoslovakia. Proceeding. Volume 4 page 209-216
- (18) Porcel C., Battaner E., Jiménez-Vicente J., 1997. A&A 322, 103
- (19) Wainscoat R. J., Cohen M., Volk K. et al., 1992 ApJS 83, 111