The new gravitational lens system B1030+074
Abstract
We report the discovery of a new double image gravitational lens system B1030+074 which was found during the Jodrell Bank - VLA Astrometric Survey (JVAS). We have collected extensive radio data on the system using the VLA, MERLIN, the EVN and the VLBA and optical observations using WFPC2 on the HST. The lensed images are separated by 1.56 arcseconds and their flux density ratio at centimetric wavelengths is approximately 14:1 although the ratio is slightly frequency dependent and the images appear to be time variable. The HST pictures show both the lensed images and the lensing galaxy close to the weaker image. The lensing galaxy has substructure which could be a spiral arm or an interacting galaxy.
keywords:
gravitation – galaxies: individual: B1030+074 – gravitational lensing.1 Introduction
The Jodrell-Bank VLA Astrometric Survey (JVAS) is a survey of flat-spectrum radio sources one of whose purposes is to search for gravitational lens systems. JVAS contains the 2400 strongest flat spectrum sources in the northern sky (Patnaik et al. 1992a; Patnaik 1993a; Browne et al. 1998, Wilkinson et al. 1998). All sources were observed with the VLA at 8.4 GHz giving a resolution of 200 mas. Those that were found to possess multiple components or very complex structure have been followed-up either with the VLA or with MERLIN and the VLBA to give high resolution images (King et al., 1998). By this process the lens systems B0218+257 (Patnaik et al. 1993b), B1422+231 (Patnaik et al. 1992b) and B1938+666 (King et al. 1997) were discovered. Also in the survey is the known system MG0414+0534 (Hewitt et al. 1989; Hewitt et al. 1992) and the probable lens B2114+022 (Augusto et al. 1998). The advantage of JVAS compared to the MIT - Green Bank (MG) lens survey (Bennett et al. 1986) is that by observing only flat spectrum, hence core-dominated, sources, it is relatively straightforward to recognize lens systems, even those which consist of just two images. We report here the discovery of such a double system, B1030+074. We present VLA, MERLIN and VLBA radio images and EVN information, together with HST WFPC2 results at 555 nm and 814 nm. In Section 2 we present the radio data and the optical data obtained for B1030+074. A discussion of B1030+074 as a lens system follows in Section 3.
2 Radio and optical observations
In this section we present all the radio maps and information obtained since the discovery of B1030+074. In Table 1 we present the radio data. Columns 1-4 show the telescope used for various observations, the date, the frequency and the resolution, respectively. The flux density in mJy of the A and B components as well as the flux density ratio A/B are shown in columns 5-7. In Table 2 we present the optical data. Columns 1-4 correspond to the same information as in Table 1 while in columns 5-7 we quote the Johnson V and Cousins I system magnitudes for the two components and their flux density ratio respectively.
2.1 Radio observations
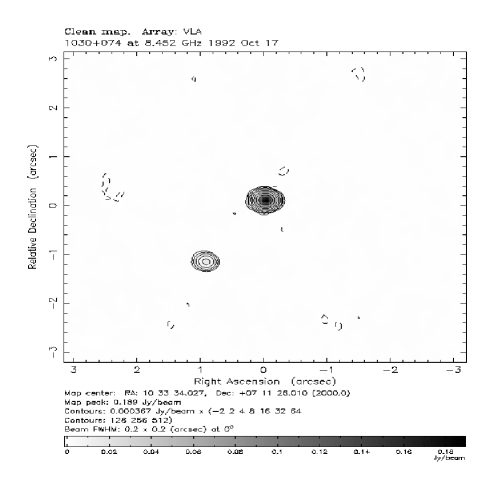
All the data were analysed using a combination of the NRAO AIPS software package and the Caltech DIFMAP software package (Pearson et al. 1994; Shepherd 1997). The discovery map of B1030+074, made from VLA A-configuration 8.4 GHz data giving 0.2 arcsec resolution, is shown in Fig. 1. It shows two distinct compact components with a separation of 1.56 arcsec, with the fainter image, B, at a PA of 142∘ relative to image A. The flux ratio at 8.4 GHz is 12.6.
VLA data for B1030+074 were also obtained at two more epochs, in 1994 February 22 at 8.4, 15 and 22 GHz, and 1995 December 20 and 19 at 15 and 22 GHz respectively. Though both components are detected, each is unresolved in the maps. The 15 and 22 GHz maps from 1995 December 20 and 19 are shown in Fig. 1. The integrated flux densities were determined using the tasks IMEAN or JMFIT/IMFIT within AIPS and are also shown in Table 1.
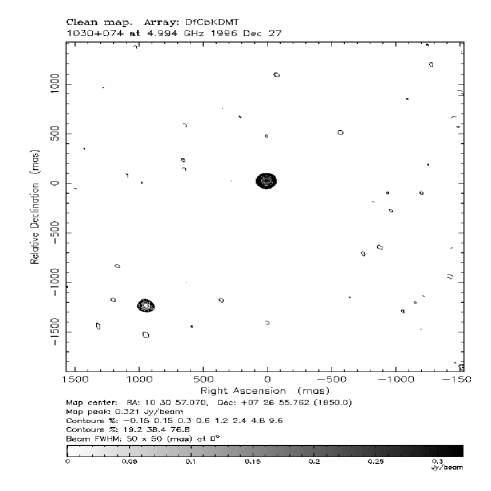
MERLIN data were obtained at 1.7 and 5 GHz in 1993 September 27 and 1996 December 27 respectively with resolutions of 150 milliarcsec and 50 milliarcsec respectively. The two components of the lens system are again unresolved and a model fit to the data yields a flux ratio of 18.8 at the 1.7 GHz and 12.0 at the 5 GHz data. The MERLIN 5 GHz map is shown in Fig. 1.
| Telesc. | Obs. date | Frequ. | Resol. | Flux density of A | Flux density of B | Flux density ratio |
| (GHz) | (arcsec) | (mJy) | (mJy) | |||
| EVN | 1994 05 15 | 1.7 | 0.015 | 147 | 8.1 | 18.1 |
| EVN | 1994 11 18 | 5 | 0.005 | 173 | 10.9 | 15.9 |
| MERLIN | 1993 09 27 | 1.7 | 0.150 | 186 | 9.8 | 18.8 |
| MERLIN | 1996 12 27 | 5 | 0.050 | 326 | 27.3 | 12.0 |
| VLBA | 1995 11 12 | 5 | 0.003 | 248 | 19.1 | 13.0 |
| VLA | 1992 10 17 | 8.4 | 0.240 | 202 | 16.0 | 12.6 |
| VLA | 1994 02 22 | 8.4 | 0.240 | 197 | 12.9 | 15.2 |
| VLA | 1994 02 22 | 15 | 0.140 | 208 | 14.8 | 14.0 |
| VLA | 1995 12 20 | 15 | 0.140 | 295 | 24.4 | 12.1 |
| VLA | 1994 02 22 | 22 | 0.080 | 184 | 15.3 | 12.0 |
| VLA | 1995 12 19 | 22 | 0.080 | 219 | 12.2 | 18.0 |
| Telesc. | Obs. date | Wavelength | Resol. | Magnitude of A | Magnitude of B | Flux density ratio |
|---|---|---|---|---|---|---|
| (nm) | (arcsec) | |||||
| HST/WFPC2 | 1997 02 03 | 555 | 0.045 | 20.34 | 24.10 | 27.4 |
| HST/WFPC2 | 1997 02 03 | 814 | 0.045 | 18.75 | 22.17 | 23.4 |
 |
 |
 |
 |
 |
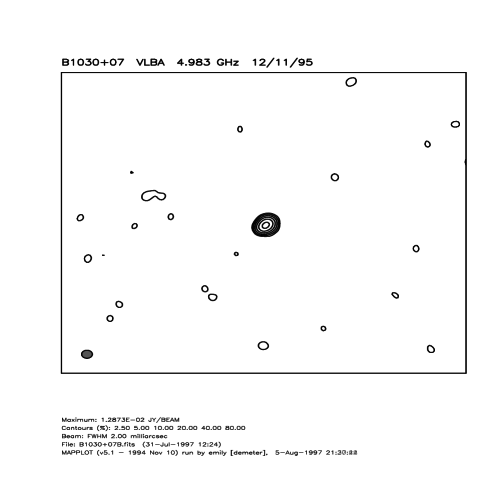 |
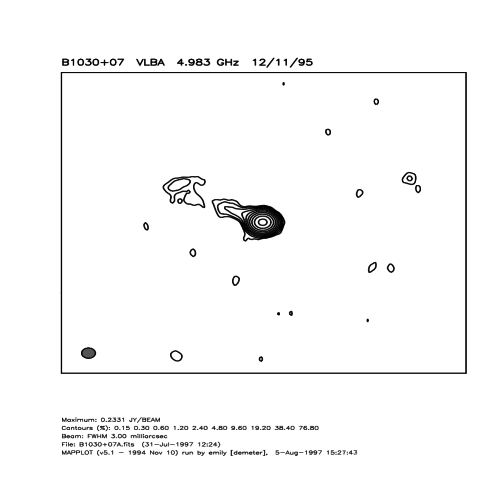
VLBA observations from 1995 November 12 at 5 GHz with a resolution of 3 mas were able to resolve at least one of the components. In Fig. 2 the stronger A component is seen to have a jet-like extension to the North-East (PA of 65 ) and 20 mas in length. The weaker B component remains unresolved even at this resolution. From the VLBA data the flux ratio of the two components is found to be 13.0.
EVN observations at 1.7 with a resolution of 15 mas and 5 GHz with a resolution of 5 mas were carried out during 1994 May 15 and November 18 respectively. Both lens components are detected and are unresolved at 1.7 GHz. The 1.7 GHz data give a flux density ratio of 18.1 for the two components and a position separation of 15671 mas (J2000) in position angle 143 .40.1. However, there is a slight extension of the A component visible in the 5 GHz map, at the same position angle as the VLBA extension. From the 5 GHz data we find the flux ratio of the two components to be 15.9 and the position separation is the same as for the 1.7 GHz data.
Since we had VLA data in two epochs at each of the three frequencies 8.4, 15 and 22 GHz, we were able to look for variations in the components. There is a definite change in the flux density ratio and the flux densities of the two components change with time (see Table 1).
2.2 HST observations
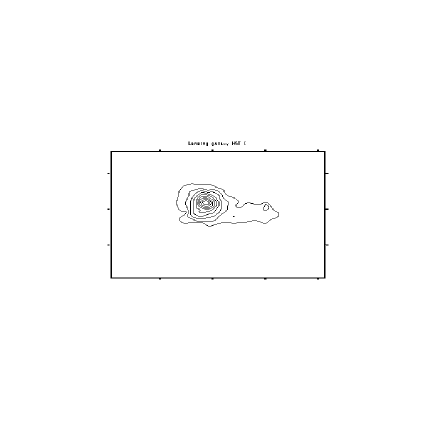
On 1997 February 3, HST images were obtained of B1030+074 using the Wide Field Planetary Camera (WFPC2) in two filters F555W (nearly Johnson V) and F814W (nearly Cousins I). Two exposures of 500 seconds each were obtained in each filter. For the reduction of the data we used STSDAS and other packages within IRAF.111IRAF is distributed by the National Optical Astronomy Observatories, which is operated by the Association of Universities for Research in Astronomy, Inc. (AURA) under cooperative agreement with the National Science Foundation. The images were rotated, cleared of cosmic ray events and the two exposures in each filter were averaged. The contour plots of the final images are shown in Fig. 3. The lowest contour level was selected to be 2 of the sky background value and the contour levels are separated by a factor of 2 in intensity. The HST contour plots of B1030+074 reveal compact optical objects corresponding to both radio components, together with a galaxy between them and very close to the B component. These data leave no doubt that B1030+074 is a gravitational lens system. The lensing galaxy appears not to have a simple smooth light distribution nor is it symmetric about the galaxy core. The overall extension of 1.035 arcsec is in a position angle nearly perpendicular to the image separation; it corresponds to 6.1 kpc at the redshift of 0.599 of the galaxy (see section 3), assuming H0 = 75 km sec-1 Mpc-1 and q0 = 0. Greyscale images of the two components and the galaxy in both the I and V filters are also presented in Fig. 3. The lowest intensity level is selected to be equal to 1 of the sky background value and the maximum intensity is selected such that most of the detailed structure of both the lens and the lensing galaxy is revealed. The transfer function between these two points is linear.
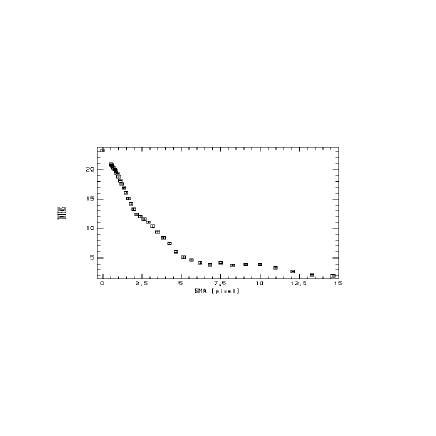
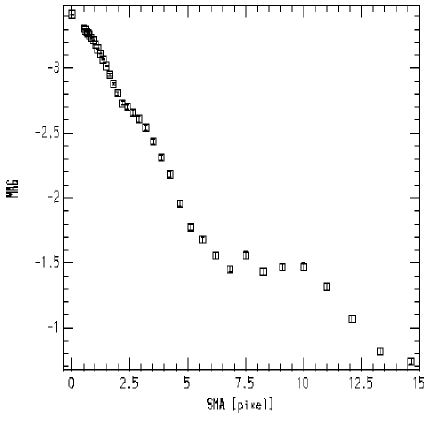
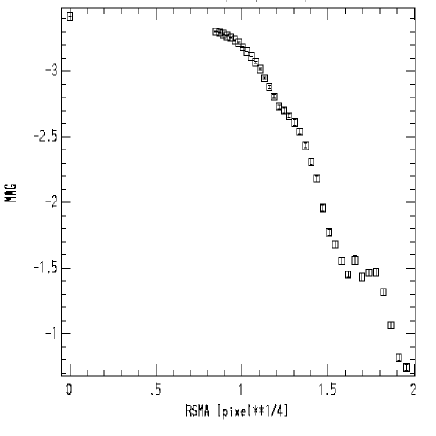
As the lensing galaxy is very close to the weak B lens component it is not easy to separate the galaxy from the lens component. In order to derive accurate photometry of the weak component and of the lensing galaxy, we computed and subtracted scaled PSFs from the direct CCD images. By means of the TinyTim program (Krist 1997) we computed an oversampled numerical PSF. We then used this optimal PSF in order to subtract, interactively, using programs within AIPS, the B component, until we saw no residuals of this component. More detail of the lensing galaxy is then revealed. A contour plot of the galaxy is shown in Fig. 4. The lowest contour level is 3 of the sky background value while consecutive contours differ by a factor of 2 in intensity. Although not an edge-on galaxy the lensing configuration bears a resemblance to that in the B1600+433 system (Jaunsen & Hjorth 1997). The extended structure to the West may be either a spiral arm, or a second interacting galaxy. Given the present resolution it is difficult to say which but future observations with the HST using the Advanced Camera might tell us the answer. Using the program/command “ellipse” within the STSDAS package in IRAF we fitted elliptical isophotes to the galaxy. The mean isophotal intensity as a function of the semi-major axis in pixels as well as the magnitude (logarithm of the isophote flux) as a function of the semi-major axis in pixels and the magnitude (logarithm of the isophote flux) as a function of the the semi-major axis (in pixels) to the 1/4 are also shown in Fig. 4. The profile information seems to support the spiral galaxy interpretation since an r1/4 law does not fit the surface brightness profile of the galaxy. Conselice (1997) show that there is a strong correlation between morphological asymmetry and Hubble type in the sense that later-type spirals show an increase in asymmetry. Hence, the asymmetry seen in the lens is further evidence for the spiral morphology.
Photometry of the A and B components and of the lensing galaxy was performed using the AIPS task TVSTAT which gives image statistics within user-defined apertures. We then followed the standard HST photometric procedures (Whitmore 1997) and relied upon the values of the PHOTFLAM and PHOTZPT keywords (that is the flux of a source with constant flux per unit wavelength in erg s-1 cm-2 A-1, which produces a count rate of 1 DN per second and the zeropoint of the instrument respectively) appearing in the header of the WFPC2 frames in order to convert the flux densities into standard V and I magnitudes. The individual magnitudes of the A and B components in the Johnson V and Cousins I systems were derived from the F555W and F814W magnitudes. The measurements for the galaxy result from the integration of the flux remaining after the removal of the fitted PSF to the B component. The integrated I magnitude of the galaxy is 20.440.1. The galaxy is not clearly visible in the HST V image, we only see its compact nucleus plus some faint extended structure which leads to an estimate of 22 for the total magnitude. The V and I magnitudes of the A component were found to be 20.340.1 and 18.750.07 respectively while those of the B component are fainter by 3.5 mag in both filters. The optical flux ratio of the two components (A/B is 23.4 in the I and 27.4 in the V) is much greater than the ratio in the radio which is consistent with extinction due to dust from the lensing galaxy. The position separation of the two components calculated from the I HST image is 15692 mas in a position angle 143.5 .0.1, same as that of the radio within the errors quoted, while the separation between the strong component and the center of the galaxy is 13694 mas in a position angle 142 .500.1 and of the weak component and the galaxy 1684 mas in a position angle of 156 .0.1.
3 B1030+074 as a lensed system
There is no doubt that B1030+074 is a gravitational lens system - the HST observations showing optical counterparts of the radio images and the lensing galaxy itself provide incontrovertible proof. The flux density ratio of the two components of B1030+074 is one of the highest for any known lensed system and close to the 20:1 limit adopted for the JVAS lens search (King et al. 1998). We attribute the different flux density ratios to the combined effects of variability and time delay. The same explanation must apply to the time variable flux density ratios at the same frequency. We plan to monitor B1030+074 to try to measure a time delay which we will use for a determination of the Hubble constant.
Spectra have been obtained by Fassnacht & Cohen (1998) using the Low Resolution Imaging Spectrograph (LRIS; Oke et al. 1995) on the Keck telescope. The emission of the background source and the lensing galaxy were spatially separated on the slit so spectra were extracted for each. From these Fassnacht & Cohen (1998) find a redshift for the lens of 0.599 and a redshift of the background source of 1.535. From the observed image splitting in the system they estimate the mass of the lensing galaxy within its Einstein ring to be 1.3 1011/h M⊙ (for H0 = 100h km/s/Mpc).
We have modeled B1030+074 using a Singular Isothermal Ellipsoid (SIE) mass distribution to describe the lens galaxy (Kormann, Schneider and Bartelmann 1994). We place the SIE mass distribution on the peak of the galaxy surface brightness distribution. Since the number of free parameters (5 in total; PA and axial ratio of the surface density distribution, velocity dispersion, and source position x,y) is equal to the number of constraints (position x,y of image A and B, flux ratio A/B and the center of the galaxy; 5 in total), we are able to find a mass model that reproduces the image positions and their flux ratio (Table 1). The critical (dashed) and caustic (solid) structure of this “best model” are shown in Fig. 5. To investigate the stability of this model, we performed 10,000 Monte-Carlo simulations, by adding Gaussian distributed errors to the image positions (0.3 mas), galaxy position (4 mas) and flux density ratio (20%) (all 1 errors). For each of the 10,000 models we solve for the mass model parameters and source position. We also calculate the time delay between images A and B. The resulting probability density distributions of the lens parameters and time delay are shown in Fig. 6. The error range on the ‘best model’ parameters (Table 3) indicates the range that contains 99% of the probability density distributions given in Fig. 6. These ranges assume that the SIE mass distribution is the correct description of the lens galaxy.
We have also tried models with an extra Singular Isothermal Sphere on the extension west of the lens galaxy, but find it has no significant influence on the position angle of the lensing galaxy inferred from the mass model. However, it does result in a smaller axis ratio and velocity dispersion of the main lens mass distribution. The position angle however appears very stable. We note that the mass distribution is almost perpendicular to the large scale structure of the galaxy.
The predicted time delay is around days with an error of only a few percent (assuming the validity of the SIE mass model).
The mass of the lensing galaxy from the “best mass model” inside the critical curve is found to be 1.552 /h 1011 M⊙ (for H0 = 100h km/s/Mpc), consistent with the mass inside the Einstein radius quoted by Fassnacht & Cohen (1998).
 |
 |
 |
 |
4 Summary
We have presented radio (VLA, MERLIN, EVN & VLBA) results and optical (HST) results for the new gravitational lens system B1030+074. The radio maps all show two unresolved components except for the higher resolution VLBA map which reveals faint jet-like structure in the strongest component. The lensing galaxy is revealed in the HST V and I images. It shows substructure which indicates that is it not a smooth elliptical galaxy. B1030+074 is likely to be a lens suitable for the measurement of the Hubble constant.
| Velocity dispersion | Surface density axis ratio | Position angle (NE) | Time delay (B-A) |
| (km/s) | (degree) | (day/h50) | |
| 258.5 (+8.4) (-5.5) | 0.66 (+0.09) (-0.12) | -10.2 (+14.7) (-10.1) | 156.1 (+2.7) (-2.5) |
Acknowledgments
We would like to thank Dr. Tom Muxlow for reducing the 1.7 GHz MERLIN map of B1030+074 and Dr. Sunita Nair for constructive comments on the paper. This research used observations with the Hubble Space Telescope, obtained at the Space Telescope Science Institute, which is operated by Associated Universities for Research in Astronomy Inc. under NASA contract NAS5-26555. The Very Large Array is operated by Associated Universities for Research in Astronomy Inc. on behalf of the National Science Foundation. MERLIN is operated as a National Facility by NRAL, University of Manchester, on behalf of the UK Particle Physics & Astronomy Research Council. We would also like to thank the staff of the EVN observatories and the MPIfR correlator for assistance with the EVN observations. This research was supported by European Commission, TMR Programme, Research Network Contract ERBFMRXCT96-0034 “CERES”.
References
- [1] Augusto, P., et al., 1998, MNRAS, in preparation
- [2] Bennett, C. L., Lawrence, C. R., Burke, B. F., Hewitt, J. N., Mahoney, J. H., 1986, ApJS, 61, 1
- [3] Browne, I. W. A., Patnaik, A. R., Wilkinson, P. N., Wrobel, J. B., 1998, MNRAS, 293, 257
- [4] Conselice, C. J., 1997, P.A.S.P., 109, 1251
- [5] Fassnacht, C. D., Cohen, J. G., 1998, AJ, submitted
- [6] Hewitt, J. N., Burke, B. F., Turner, E. L., Schneider, D. P., Lawrence, C. R., Langston, G. I., Brody, J. P., 1989, in Lecture Notes in Physics, vol. 330, Gravitational Lenses, ed. J. M. Moran, J. N. Hewitt, K. Y. Lo (Berlin:Springer Verlag), 147
- [7] Hewitt, J. N., Turner, E. L., Lawrence, C. R., Schneider, D. P., Brody, J. P., 1992, AJ, 104, 968
- [8] Jaunsen, A. O., Hjorth, J., 1997, A&A, 317, L39
- [9] King, L. J., Browne, I. W. A., Muxlow, T. W. B., Narasimha, D., Patnaik, A. R. Porcas, R. W., Wilkinson, P. N., 1997, MNRAS, 289, 450
- [10] King, L. J., Browne, I. W. A., Patnaik, A. R., Wilkinson, P. N., Marlow, D. R., 1998, MNRAS, in preparation
- [11] Kormann, R., Schneider, P., Bartelmann, M., 1994, A&A, 284, 285
- [12] Krist, J., 1997, “WFPC2 ghosts, scatter and PSF field dependence”, postscript document available via the STScI WWW page
- [13] Oke, J. B., Cohen, J. G., Carr, M., Cromer, J., Dingizian, A., Harris, F. H., Labrecque, S., Lucinio, R., Schaal, W., Epps, H., Miller, J., 1995, PASP, 107, 375
- [14] Patnaik, A. R., Browne, I. W. A., Wilkinson, P. N., Wrobel, J. M., 1992a, MNRAS, 254, 655
- [15] Patnaik, A. R., Browne, I. W. A., Walsh, D., Chaffee, F. H., Foltz, C. B., 1992b, MNRAS, 259, 1
- [16] Patnaik, A. R., 1993a, Proceedings of the 31st Liège International Astrophysical Colloquium “Gravitational Lenses in the Universe”, p. 311
- [17] Patnaik, A. R., Browne, I. W. A., King, L. J., Muxlow, T. W. B., Walsh, D., Wilkinson, P. N., 1993b, MNRAS, 261, 435
- [18] Pearson, T. J., Shepherd, M. C., Taylor, G. B., Meyers, S. T., 1994, BAAS 185, #08.08
- [19] Shepherd, M. C., 1997, ADASS VI, A.S.P. Conference Series, vol. 125, eds., Gareth Hunt and H. E. Payne, p. 77
- [20] Whitmore, B., 1997, “Photometry with the WFPC2”, postscript document available via the STScI WWW page
- [21] Wilkinson, P. N., et al., 1998, in preparation
 |
 |