03 (11.17.3; 11.17.4(RX J0947.0+4721); 11.17.4(RX J0947.1+4721); 13.25.2 ) \offprintsK. Molthagen, kmolt@mpe.mpg.de 11institutetext: Hamburger Sternwarte, Gojenbergsweg 112, D – 21029 Hamburg, Germany
RX J0947.0+4721 – an extremely soft Narrow Line QSO ††thanks: Based partly on observations from the German-Spanish Astronomical Center, Calar Alto, operated by the Max-Planck-Institut für Astronomie, Heidelberg, jointly with the Spanish National Commission for Astronomy
Abstract
RX J0947.0+4721 is a newly discovered example of a narrow–line Seyfert 1 type object with a quasar level luminosity (). It was detected in the ROSAT All–Sky Survey (RASS) and later in 17 pointed observations of the ROSAT Position sensitive Proportional Counter (PSPC). The optical spectrum contains strong FeII emission. We apply several spectral models to the X–ray data. A single power law fit yields a photon index . Single component thermal models underestimate the flux above 1 keV. A good fit is obtained with a blackbody plus power law model ( fixed) modified by Galactic absorption. The best fit temperature is , and the flux ratio in the ROSAT band is . Large count rate variations are visible with a maximum amplitude of a factor . The fastest change is a drop of a factor 2.7 in 25 hours. No spectral variations were observed. The maximum and minimum luminosities in the two component model are and , respectively. We discuss possible explanations for the extreme softness and the observed variability.
keywords:
Quasars: general – Quasars: individual: RX J0947.0+4721 – Quasars: individual: RX J0947.1+4721 – X–rays: galaxies1 Introduction
Studies of the soft X–ray excess were done preferentially with low redshift AGN because this spectral feature will be shifted out of the observed energy windows of the ROSAT, EXOSAT and Einstein satellites for higher redshifts. The existence of the soft X–ray excess was first detected for the Seyfert 1 galaxy E1615+061 (Pravdo et al. 1981) and Mrk 841, another Seyfert galaxy with (Arnaud et al. [1985]). Among the 58 AGN used for a study of the ultraviolet to soft X–ray bump (Walter & Fink, [1993]) the QSO with the highest redshift is 3C 263 with , and only one of the 31 narrow line Seyfert 1 galaxies (NLS1) investigated by Boller et al. (1996), has z higher than that. This object, E1346266 (see also Puchnarewicz et al. 1994), and PHL 1092 (Forster & Halpern 1996) are the most distant narrow line type 1 QSOs reported so far. It is therefore of great interest to examine the properties of further narrow line QSOs with high redshifts and steep soft X–ray spectra. The situation is similar for the study of the time behaviour of AGN. For a statistically unambiguous detection of a short–term variation a minimum of source counts is necessary. Therefore such studies preferred bright nearby AGN.
RX J0947.0+4721 was first detected in the RASS111ROSAT All Sky Survey (Voges 1992) (Bade et al. 1995). It appeared to be a very soft source, but the photon statistics were insufficient to determine the spectral shape. Besides that, RX J0947.0+4721 is the brightest and steepest source in a medium deep ROSAT survey in the field HS 47.5/22 (Molthagen 1996). The field is part of the Hamburg Quasar Survey (Hagen et al. 1995), an objective prism based survey of the northern hemisphere. Due to its brightness, RX J0947.0+4721 can be found in 16 of the 48 pointings which form the survey. Strong variations, already suggested in the RASS data, were clearly seen in the pointed data.
RX J0947.0+4721 shows striking similarity in optical and X–ray behaviour with NLS1 objects such as IRAS 132243809 (Boller et al. [1993]). Both RX J0947.0+4721 and IRAS 132243809 have exceptionally steep soft X–ray spectra, narrow Balmer lines, and strong optical Fe II emission. RX J0947.0+4721 is also an IRAS source (Moshir et al. 1990). Its optical and X–ray luminosities, computed with and , clearly denote it as quasar. The low Galactic absorption in the direction of this QSO enables high–quality spectral analysis of this quasar–luminosity NLS1.
2 The Data
2.1 X–ray observations
RX J0947.0+4721 was detected during an extensive search for AGN in the RASS by Bade et al. ([1995]). They found a very soft source with a count rate of in the total ROSAT band (0.1 – 2.4 keV).
Besides its presence in the RASS and the medium deep survey pointings, RX J0947.0+4721 is located in the outer part of a pointing on the Abell cluster A851. All observations were made with the PSPC detector (Pfeffermann et al. 1986) on board the ROSAT satellite (Trümper 1983), between April 1991 and October 1993. Each pointing was split into at least two observational intervals (OBIs) separated by intervals ranging from a few hours to more than a year. The OBIs are therefore treated separately for timing analysis. Table 1 lists date and length of the OBIs as well as number of counts, off–axis angle , count rates and hardness ratios of RX J0947.0+4721 found therein.
The entrance window of the PSPC is covered by a thin foil supported by aluminum struts (Pfeffermann et al. 1986). Depending on its position in the field of view (FOV), these struts can shadow a source. ROSAT is operated in the so–called ‘wobble mode’ to lessen the imprints of the struts. As a consequence, sources close to the detector edge can be moved (partly) out of the FOV. RX J0947.0+4721 is obscured by the struts or moved partly out of the FOV in several OBIs. These are marked (-) in Table 1.
In pointing 700165, RX J0947.0+4721 was detected only in the second OBI, but not in the first, although it is unobscured in both. We determined the vignetting corrected number of counts between 0.1 and 1.0 keV in the source area of the first OBI, , and use the count rate as an upper limit in the following.
| Pointing | date | HR | ||||
| [ s ] | [ ′ ] | [] | ||||
| 700166-1 | 91 04 14 | 1826 | 626.2 | 12.6 | ||
| 700171-1 | 91 04 14 | 1732 | 418.4 | 37.1 | ||
| 700171-2 | 91 04 18 | 591 | 299.5 | 37.1 | ||
| 700166-2 | 91 04 19 | 377 | 71.0 | 12.6 | ||
| 700170-1 (-) | 91 04 20 | 1386 | 163.1 | 52.1 | ||
| 700167-1 (-) | 91 04 21 | 571 | 64.3 | 22.9 | ||
| 700172-1 | 91 04 21 | 1097 | 204.6 | 8.7 | ||
| 700180-1 (-) | 91 04 21 | 1125 | 160.1 | 45.4 | ||
| 700173-1 (-) | 91 04 23 | 1521 | 158.7 | 25.7 | ||
| 700182-1 (-) | 91 05 10 | 837 | 93.7 | 23.5 | ||
| 700182-2 (-) | 91 05 10 | 2027 | 210.2 | 23.5 | ||
| 700165-1 | 91 11 15 | 1047 | 41.0 | |||
| 700181-1 (-) | 91 11 15 | 2263 | 43.6 | |||
| 800102-1 (-) | 91 11 17 | 1298 | 63.6 | 47.9 | ||
| 700165-2 | 91 11 17 | 943 | 86.0 | 41.0 | ||
| 800102-2 (-) | 91 11 18 | 2400 | 249.3 | 47.9 | ||
| 800102-3 (-) | 91 11 18 | 1904 | 147.7 | 47.9 | ||
| 800102-4 (-) | 91 11 19 | 1401 | 180.5 | 47.9 | ||
| 800102-5 (-) | 91 11 19 | 2253 | 89.1 | 47.9 | ||
| 800102-6 (-) | 91 11 19 | 2114 | 191.0 | 47.9 | ||
| 800102-7 (-) | 91 11 19 | 1634 | 68.6 | 47.9 | ||
| 800102-8 (-) | 91 11 20 | 1198 | 72.8 | 47.9 | ||
| 700181-2 (-) | 91 11 20 | 673 | 76.3 | 43.6 | ||
| 700457-1 | 92 05 09 | 1665 | 642.6 | 39.6 | ||
| 700454-1 (-) | 92 05 09 | 1585 | 266.7 | 24.1 | ||
| 700451-1 | 92 05 10 | 1695 | 408.8 | 43.7 | ||
| 700453-1 | 92 05 10 | 1768 | 428.4 | 34.1 | ||
| 700453-2 | 92 05 18 | 2887 | 662.8 | 34.1 | ||
| 700454-2 (-) | 92 05 19 | 1590 | 327.8 | 24.1 | ||
| 700457-2 (-) | 92 05 19 | 1607 | 397.9 | 39.6 | ||
| 700451-2 (-) | 92 05 19 | 1726 | 453.9 | 43.7 | ||
| 700173-2 (-) | 92 11 14 | 566 | 97.8 | 25.7 | ||
| 700180-2 | 92 11 19 | 696 | 73.3 | 45.4 | ||
| 700168-1 (-) | 92 11 19 | 716 | 75.5 | 30.5 | ||
| 700180-3 | 92 11 20 | 600 | 107.1 | 45.4 | ||
| 700167-2 (-) | 92 11 20 | 700 | 49.7 | 22.9 | ||
| 700170-2 (-) | 92 11 21 | 1032 | 100.7 | 52.1 | ||
| 700169-1 (-) | 93 04 24 | 1380 | 122.5 | 53.4 | ||
| 700169-2 (-) | 93 04 25 | 1018 | 81.6 | 53.4 | ||
| 700168-2 | 93 04 25 | 791 | 237.3 | 30.5 | ||
| 700168-3 | 93 04 25 | 619 | 167.0 | 30.5 | ||
| 700167-3 (-) | 93 10 20 | 1451 | 237.2 | 22.9 | ||
| a: upper limit for non–detection | b: no source counts above 0.4 keV | |||||
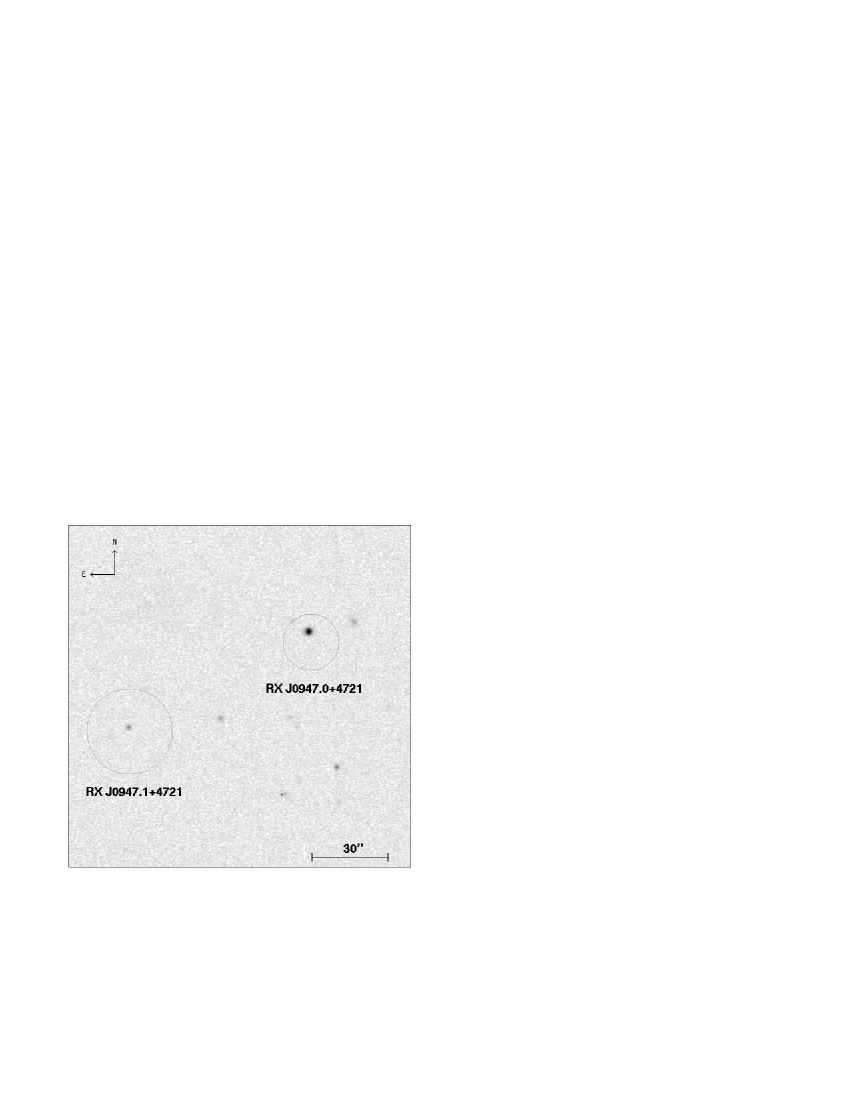
In those OBIs where RX J0947.0+4721 is located closest to the detector centre ( ), a fainter and harder source was found at a distance of from RX J0947.0+4721 (Fig. 1). The count rate of this neighbouring source, RX J0947.1+4721, is in the total ROSAT band. With the adaptive hardness ratio method developed by Schartel et al. (1996), assuming a power law spectrum () with absorption fixed at the Galactic value, we found a for RX J0947.1+4721, and a flux of in the total ROSAT band, which is about a factor 10 lower than the overall average value of RX J0947.0+4721 (see next section). The source might even be slightly fainter and harder than the values computed here, because the two sources are not fully separated.
In all other pointings the two sources are blended, due to the large point spread function (PSF) at larger off–axis angles, so that any extraction circle around RX J0947.0+4721 includes at least parts of the weaker source’s photons. The contamination will be more significant at the higher energies where RX J0947.0+4721 is faintest. The analysis was therefore largely restricted to the 0.1 – 1.0 keV band (0.15 – 1.54 keV in the quasar’s rest frame) which is called ’broad’ in the following.
2.2 Optical observations
Figure 2 shows a blue CCD image including both RX J0947.0+4721 and RX J0947.1+4721. It was taken with the 3.5m telescope focal reducer at Calar Alto in March 1994. The B–magnitudes for the two objects are and , respectively. In both cases, optical and X–ray positions agree within , and no other optical sources are present in the X–ray error circles, so that the identifications can be considered as unambiguous.
The identification spectrum of RX J0947.0+4721 was taken in February 1992 (Bade et al. [1995]). It shows Mg II and narrow Balmer emission lines with a redshift of and strong bumps due to the Fe II multiplets around and .
An additional spectrum with resolution taken at red wavelengths has the range from H to the FeII bump in the centre (Fig. 3a). Due to oncoming clouds during the exposure, no absolute flux calibration is possible, only relative values are given. H is of similar width and strength as in the first spectrum: and . (The instrumental profile has been subtracted. The quasar did not fill the slit, and so the FWHM might be slightly underestimated.) The rest frame equivalent widths for H and FeII are given in Table 2. The value for FeII might be underestimated due to the presence of the sky absorption line at at the blue side of the bump. Their ratio is FeII, placing RX J0947.0+4721 among the strong Fe II emitters, where strong means FeII (Joly [1991]).

RX J0947.1+4721 was observed with a low dispersion grism () to obtain high signal to noise in a short time. The spectrum is shown in Fig. 3b. It contains one strong emission line at which we identified with Mg II, leading to a redshift . The broad bump between and would then contain H and the [OIII] lines. No further emission lines can be seen in the spectrum, and since no strong lines are expected between MgII and H, we are confident that our identification is correct.
| RX J0947.0+4721 | |
| R.A. (J2000.0) | |
| DEC. (J2000.0) | |
| z | 0.541 |
| NH,gala | |
| EWHβ | 23.7 |
| EWFeIIλ4570 | 41.4 |
| a: error | |
2.3 Radio observations
RX J0947.0+4721 was detected as a radio source with the Dominion Radio Astrophysical Observatory synthesis radio telescope222details at http://www.drao.nrc.ca/web/homepage.shtml in Penticton, Canada. At 1420 MHz we found a source with a flux density , apart from the optical position. This is within the expected uncertainty of the radio position. Measurements were also made at 408 MHz, but due to confusion with a nearby source only an upper limit of was obtained.
With these two values, an upper limit for the radio spectral index (), , can be estimated. It is thus not impossible that RX J0947.0+4721 has a flat radio spectrum, i.e. . A limit for the radio–loudness can be estimated from the upper limit of . Wilkes & Elvis (1987) consider a quasar to be radio–loud if . With and from Table 2, we get and , leading to . This is quite close to the dividing value, and depending on the true spectral shape, RL can be larger than one.
The quasar is also found in the 1.4 GHz NRAO VLA Sky Survey (Condon et al. [1996]). Its flux there is , consistent with our DRAO value.
3 Results
3.1 Temporal Behaviour
The light curve of RX J0947.0+4721, shown in Fig. 4, contains data from all OBIs. The largest amplitude of variability between two unobscured detections is a factor of . However, this is not the maximum amplitude observed. Since there is no technical reason for the non–detection in OBI 700165-1, a genuine change of a factor must have occured.
Besides these large variations, the count rate has been seen to drop by a factor of 2.7 in 25 hours as well as a factor of 1.6 in 30 hours. There are also less significant indications of more rapid variability. Unfortunately, some of the relevant OBIs are obscured. The count rates derived from these data can be underestimated, so that the variations are of questionable significance.

It has to be checked whether the changes are pure intensity variations or spectral variations as well. Since the OBIs contain generally too few hard photons to perform a meaningful spectral fit, the hardness ratio is used instead, which is defined as
with B, H and S being the counts in the broad, hard (0.4 – 1.0 keV) and soft (0.1 – 0.4 keV) band, respectively. The error in HR is then
There could be some dependence of the hardness ratio on the position in the FOV: at large off–axis angles, parts of the soft PSF might fall outside the detector and the source appears harder. The available data did not show any correlation between HR and , regardless of whether the OBIs are partially shadowed or not. Separate unweighted averages for obscured and unobscured OBIs yield and , respectively, the overall average is .

Figure 5 shows HR vs. count rate. Three OBIs have been left out, the two upper limits and 800102-7, where no hard source counts were detected. No trend of HR with can be seen. A fit to all data (39 OBIs) gives with and a likelihood that this value of will be exceeded by chance of . Fits to the good (14) and obscured (25) OBIs separately give , , and , , , respectively. The values for constant HR are 9.50, 4.14 and 4.67 for all, good, and obscured OBIs. In all cases, the slopes are compatible with zero, and the differences in are too small to favour the straight line fit. The observed changes are therefore considered to be pure intensity variations.
3.2 Spectral Behaviour
Since no changes in HR could be detected, all data were merged into one spectrum () before conducting spectral fits. The spectrum was binned with roughly the same relative error in each bin below 1.0 keV, yielding 14 bins. Above 1.0 keV, only source photons are detected; these are filled into one single bin with a relative error of 14%. Merging, binning, and fitting was done using the EXSAS software package (Zimmermann et al. 1993); no additional errors were added.
| NH | kT | L | d.o.f. | ||||
| [] | [] | [ eV ] | [] | ||||
| power law | 4.0 | 4.66 | 12 | ||||
| ′′ | 12.3 | 1.24 | 11 | ||||
| thermal bremsstrahlung | 3.1 | 1.69 | 12 | ||||
| ′′ | 4.2 | 1.19 | 11 | ||||
| blackbody | 1.07a | 3.0 | 1.32 | 12 | |||
| ′′ | 2.5 | 1.20 | 11 | ||||
| bb + power lawb,c | 1.07a | 3.1 | 1.08 | 12 | |||
| bb + power lawb,c,e | 1.07a | 5.1 | 1.40 | 12 | |||
| a: NH f ixed at the Galactic value | b: f itted range is 0.1 – 2.4 keV | c: given separately | |||||
| d: f ixed at the ’canonical’ value | e: only unobscured OBIs used | ||||||
First, several single–component models were applied to the 0.1 – 1.0 keV range. Table 3 lists the results of the fits, and Fig. 6 shows

a: single power law; b: thermal bremsstrahlung; c: blackbody.
the error ellipses. A single power law with cold absorption gives an unacceptable fit when NH is fixed at the Galactic value. With NH free, the value obtained for the column density is more than twice the Galactic value. Thermal bremsstrahlung with fixed Galactic absorption yields a rather poor fit with and . Treating as a free parameter improves the fit, but again results in . An absorbed blackbody model gives acceptable fits for NH both fixed and free. The Galactic NH is higher than the best fit value, but still within the confidence interval.
When the high energy tail (1.0 – 2.4 keV) is included, both thermal models underestimate the flux above 1 keV significantly. A single power law fits the data, but again the fitted NH is more than twice the Galactic value.
We then tried a two–component fit of the total ROSAT band with Galactic absorption, the soft component modeled by a blackbody and the hard by a power law. It might be thought that the hard component is mainly a result of contamination by RX J0947.1+4721 which is at least partly inside the extraction area of RX J0947.0+4721. To check this, we fixed power law index and flux at the values estimated for that source. The fit gives unacceptable results by underestimating the high energy tail of the spectrum, thus hinting at a noticeable hard component of RX J0947.0+4721 itself. We decided to fix the power law index at the ’canonical’ value and fit only the two normalizations and the blackbody temperature because the statistics above 1 keV are too poor to fit as well. Only of the source photons are detected above 1 keV, and if these are filled into more than one spectral bin, the relative error per bin is above 25%, too high to give reasonable constraints on . The fit result is presented in Fig. 7, and the parameters are listed in Table 3.

With this model, the average flux is if all data are averaged, and if only the unobscured OBIs are used. As was the case for the hardness ratios, no significant change in the spectral parameters can be seen when only the unobscured OBIs are used for the fits. The contribution of RX J0947.1+4721 to the overall averaged flux will be about at worst (section 2.1).
With H0 and q0 as before, the fitted flux corresponds to a good (overall) average luminosity L () in the QSO’s rest frame (0.15 – 3.70 keV). The detected maximum and minimum luminosities, in this model, are and , respectively, and the upper limit corresponds to . We applied no K–correction to avoid including parts of the spectrum which we did not observe, and to avoid a shift of the band onto the Rayleigh–Jeans part of the blackbody component of the spectrum. The values for fx and Lx have to be taken with caution, because they are strongly model dependent.
So far, no indication for spectral variability could be found. As a further test, we created ‘high count rate’ and ‘low count rate’ spectra which were binned as described before, and then divided (fig. 8). The separating count rate, , was chosen to give roughly the same number of counts in both spectra. Spectral changes should be visible as a deviation of the ratio from a constant.

No such deviation can be seen. The data are consistent with a constant value ( 13 d.o.f.; ). If all data are used, or if a different binning is applied, the results are similar. Separate fits to high and low spectra give spectral parameters in good agreement with the ones in Table 3. Again, the conclusion is that no significant spectral changes are seen.
4 Discussion
RX J0947.0+4721 is denoted as a QSO (rather than a Seyfert) by its optical luminosity of . This is supported by the overall averaged X–ray luminosity of ; Seyferts do not normally have above several . Otherwise, RX J0947.0+4721 is very similar to NLS1 such as IRAS (Boller et al. 1993). The photon index and FWHM of place it well inside the range obtained by the NLS1 sample in Boller et al. (1996; their fig. 8). The ratio FeII is comparable with other values found for these objects. X–ray variability as observed is a common feature in NLS1 (Boller et al. 1996). As for IRAS 132243809, IZw1 and other NLS1, RX J0947.0+4721 has a high far infrared flux. It has been detected by IRAS at 60 with a flux of (Moshir et al. 1990), corresponding to an IR–luminosity of .
| RX J0947.0+4721 | E1346+266a | PHL 1092b | |
| FWHMHβ | |||
| 31.1 | 14 | ||
| 0.98 | 5.3 | ||
| a: Boller et al. 1996 | b: Forster & Halpern 1996 | ||
| c: The values of are highly model dependent. Here, a power law with Galactic (no K–correction) was applied, together with , . | |||
A comparison of RX J0947.0+4721 with the narrow line quasars shows that their X–ray parameters are quite similar: the luminosities in the ROSAT band are of the same order of magnitude, and the photon indices are practically identical. This latter observation may be taken as an indication that the steepness extends towards fairly high rest frame energies. However, the indication must not be overstressed. The value of for E1346266 is not well determined; Puchnarewicz et al. (1994) find smaller values () than Boller et al. (1996).
A better description of the observed spectrum can be achieved by thermal models, however, both the blackbody and thermal bremsstrahlung models underestimate the flux above 1 keV. The analysis in section 2.1 has shown that the hard component of the spectrum cannot be totally explained with the neighbouring harder source which is too weak. It must therefore be intrinsic to RX J0947.0+4721.
A good fit is obtained with a blackbody modeling the soft excess plus a power law as hard component, modified by Galactic absorption. For an accretion disk model this means that the X–rays originate from a small region with little variations in temperature.
This interpretation assumes a thermal origin for the X–ray emission in the inner parts of the accretion disk. There is, however, an indication against this assumption. No change of the hardness ratio with increasing count rate is observed, which means that the temperature of the emitting region remains constant over nearly one order of magnitude in luminosity. Over this luminosity range temperature variations should be easily detectable from the correlation .
Model calculations for a spectrum with fixed power law component, and all flux changes attributed to a temperature change in the blackbody component, show that only small deviations from the average flux (table 3, last row) would be compatible with the data.

This is illustrated in Fig. 9, which shows the ratio of high to low count rate spectra for the data (crosses with error bars) and six simulations (lines) with ratios between 0.4 and 2. The curves for ratios 2, 1.75, and 0.4, show significant deviations from the observed ratio, while the others agree with the data below channel 100 (roughly 1 keV). Only changes less than a factor 1.75 – 2 can be caused by a change in T. The large changes observed (factors 5.7, 2.7) must be caused by another process.
A luminosity change in dependency of the radius (pulsations with constant temperature, ) is difficult to model for an accreting black hole because the X–ray emitting region should have always the same distance (in Schwarzschild radii) from the central engine. As a consequence, models involving reprocessing of harder X–ray into softer photons could be a solution.
In Guilbert & Rees ([1988]), the central engine produces a non–thermal spectrum of hard X–rays and –rays of sufficient energy to produce electron – positron pairs which in turn can produce and maintain a secondary plasma with optical depth . The large optical depth is responsible for the existence of a cool component in the gas close to the central engine. Incident radiation is reflected and reprocessed by cold material. More recent works (e.g. Maraschi & Haardt 1997, Haardt et al. 1997) have shown that the disk corona may have only electrons instead of pairs, and that it is not necessarily optically thick. The fact that the iron line is not Comptonized to invisibility supports for the corona. However, although these models can explain the shape of the soft X–ray spectrum, the lack of spectral variations may cause problems. In Haardt et al. (1997), noticeable spectral changes are predicted for the ROSAT band, none of which are observed for RX J0947.0+4721.
Models including warm absorbers may be another possible explanation of NLS1 phenomena. A detailed description of such a model applied to Mrk 766 can be found in Leighly et al. ([1996]). Unfortunately, Mrk 766 is more a Sy 1.5 than a NLS1 (Osterbrock & Pogge 1985), and it may be inappropriate to generalize the results for this special object to the whole NLS1 class. The application of such a model to RX J0947.0+4721 would conflict with the lack of spectral variability, anyway. Changes of ionisation parameter and/or column density of the warm absorber would cause changes in spectral shape. Spectral changes are expected even if the variations arise via changes in the central source itself since photoionisation contributes to the ionisation structure of the absorber. The lack of spectral changes for RX J0947.0+4721 is a strong argument against warm absorber models.
Further model constraints can in principle be derived from timing analysis. The shortest variation significantly detected for RX J0947.0+4721 corresponds to a decrease (bb + pl model) in . Following Fabian & Rees (1979), this value implies an efficiency – far below the limit of 0.057 for accretion onto a Schwarzschild black hole. If the single power law model is used instead, we have , and subsequently , still more than a factor 4 below the limit.
Blazar–like activity, known to produce rapid X–ray variations, is usually not applied to NLS1 galaxies because NLS1 objects do not show properties which are typical for jet activities, as there are flat spectrum radio emission, strong polarisation, and nearly featureless multifrequency spectra. RX J0947.0+4721 may be different in that the possibility of a flat radio spectrum (i.e. , which would make it also radio loud) can presently not be ruled out.
If the short time variations are confirmed, a Schwarzschild black hole will no longer be a proper model. The Schwarzschild limit is passed if large amplitude variations () in 16000 s are detected. These would suggest either the presence of a Kerr black hole or relativistic X–ray beaming effects.
The large amplitude variation of a factor hints at models like a filamentary or spot–like emission region (IRAS 132243809; Otani et al. 1996) or tidal disruption of stars (IC 3599; Brandt et al. 1995, Grupe et al. 1995) which have been suggested to explain giant amplitude variations in these ultrasoft NLS1 galaxies.
5 Summary
This paper presents optical and soft X–ray observations of a QSO discovered within the RASS and present in 16 pointings from a medium deep ROSAT survey in the field HS 47.5/22 (Molthagen et al., [1997]).
The object is similar to narrow–line Seyfert 1 galaxies, but both its optical and X–ray luminosity are about an order of magnitude higher than most of the objects in Boller et al. (1996), thus clearly extending the object class into the quasar domain.
It shows an extremely soft X–ray spectrum. The usual description with a power law and low energy absorption gives only very poor fits. Single component thermal models underestimate the flux above 1 keV. A two component model with the soft excess modeled by a blackbody, and a power law as hard component, gives a better fit. Strong and – at the high luminosity – remarkably fast variations can be seen in the light curve of RX J0947.0+4721.
Warm absorbers could be an explanation of NLS1 phenomena. Applied to RX J0947.0+4721, such models conflict with the lack of observed spectral variability. However, the faintness of RX J0947.0+4721 at harder X–rays may have prohibited the detection of changes close to 1 keV.
Models including reprocessing might be another explanation for the X–ray emission of RX J0947.0+4721, but again, the lack of spectral variations may be a problem.
At present, the hard X–ray data are not sufficient to distinguish between the above models, or others like a filamentary or spot–like emission region, or the tidal disruption of stars. A thorough investigation of intensity and spectral changes would be highly desirable.
Acknowledgements.
The authors wish to thank W.N. Brandt for many useful comments. KM acknowledges support by BMFT (DARA FKZ 50 OR 9308) and NB by the Deutsche Forschungsgemeinschaft under Re 353/22-1 to 4 and DARA 50 OR 960116.References
- [1985] Arnaud K.A., Branduardi–Raymont G., Culhane J.L., et al., 1985, MNRAS 217, 105
- [1995] Bade N., Fink H.H., Engels D. et al., 1995, A&AS 110, 469
- [1993] Boller T., Trümper J., Molendi S., et al., 1993, A&A 279, 53
- [1996] Boller T., Brandt W.N., Fink H., 1996, A&A 305, 53
- [1995] Brandt W.N., Pounds K.A., Fink H., 1995, MNRAS 273, L47
- [1996] Condon J.J., Cotton W.D., Greisen E.W. et al., 1996, ADIL..JC..01
- [1997] Engels D., Hagen H.-J., Cordis L. et al., 1997, A&AS in press
- [1979] Fabian A.C., Rees M.J., 1979, in Proc. COSPAR Symp., X–Ray Astronomy, eds. Baity W.A., Peterson L.E., 381
- [1996] Forster K., Halpern J.P., 1996, ApJ 468, 565
- [1988] Guilbert P. W., Rees M. J., 1988, MNRAS 233, 474
- [1995] Grupe D., Beuermann K., Mannheim K. et al., 1995, A&A 299, L5
- [1997] Haardt F., Maraschi L., Ghisellini G., 1997, ApJ 476, 620
- [1995] Hagen H.J., Groote D., Engels D., Reimers D., 1995, A&AS 111, 195
- [1991] Joly M., 1991, A&A 242, 49
- [1996] Leighly K.M., Mushotzky R.F., Yaqoob T., Kunieda H., Edelson R., 1996, ApJ 469, 147
- [1997] Maraschi L., Haardt F., 1996, in 163 IAU conference, eds. Wickramasinghe D., Ferrario L., Bicknell G., in press
- [1996] Molthagen K., 1996, Ph.D. thesis, Hamburg University
- [1997] Molthagen K., Wendker H.J., Briel U.G., 1997, A&AS 126, 509
- [1990] Moshir M., Kopan G., Conrow T. et al., 1990, The Faint Source Catalog, Version 2.0
- [1985] Osterbrock D.E., Pogge R.W., 1985, ApJ 297, 166
- [1996] Otani C., Kii T., Miya K., in Röntgenstrahlung from the Universe, eds. Zimmermann H.U., Trümper J.E., Yorke H., 1996, 491
- [1] Pfeffermann E., Briel U.G., Hippmann H. et al., 1986, Proc.SPIE 733, 519
- [1981] Pravdo S.H., Nugent J.J., Nousek J.A. et al., 1981, ApJ 251, 501
- [1994] Puchnarewicz E.M., Mason K.O., Córdova F.A., 1994, MNRAS 270, 663
- [1994] Schartel N., Walter R., Fink H.H., Trümper J., 1996, A&A 307, 33
- [1983] Trümper J., 1983, Adv. Space Res., 2, No. 4, 241
- [1992] Voges W. 1992, in Proceedings on European International Space Year Meeting ESA ISY-3, 9
- [1993] Walter R., Fink, H.H., 1993, A&A 274, 105
- [1987] Wilkes B.J., Elvis M., 1987, ApJ 323, 243
- [1993] Zimmermann H.U., Belloni T., Izzo C., Kahabka P., Schwentker O., 1993, EXSAS User’s Guide, MPE rep. 244, Garching