The X–ray spectrum of the polar BY Cam
Abstract
ASCA and GINGA X-ray data from the magnetic Cataclysmic Variable BY Cam show that the spectrum is strongly affected by complex absorption, probably from the pre-shock accretion column. The intrinsic emission from the shock is significantly better described by the theoretically expected multi-temperature structure rather than a single temperature plasma, but with cyclotron cooling probably suppressing the highest temperature bremsstrahlung components. Reflection of this multi-temperature emission from the white dwarf surface is also significantly detected. All these spectral complexities are required to gain a physically self-consistent picture of the X-ray spectrum.
1 INTRODUCTION
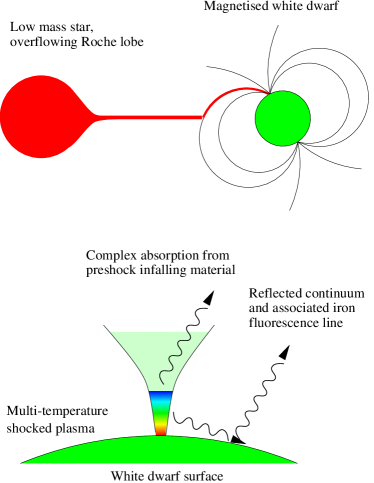
Magnetic cataclysmic variables (polars or AM Her stars) are binary systems where a magnetised ( G) white dwarf accretes from a low mass companion (see the upper panel of Figure 1 and e.g. the review by [1]). Such magnetic fields are strong enough to disrupt disk formation. Instead, the accreting stream is entrained by the magnetic field and falls freely through the gravitational potential until it hits the white dwarf surface. The resultant strong shock has a typical temperature of tens of keV for optically thin material, giving rise to an X–ray emitting plasma.
2 SPECTRAL COMPLEXITY
The shock clearly must have temperature structure as the heated post-shock gas must cool in order to settle onto the white dwarf surface. Thus the primary hard X-ray spectrum of a polar is expected to be the density weighted sum of optically thin spectra with temperatures ranging from the shock temperature to effectively the photospheric temperature of the white dwarf surface (see the lower panel of Figure 1 and e.g. [2, 3]). The spectral signature of this ‘cooling flow’ is that there is both high and low temperature gas present. Thus high temperature bremsstrahlung continuum and high ionisation iron K lines can be seen together with low ionisation iron L lines. Figure 2 shows this difference between the expected emission from a shock of maximum temperature of 25 keV, compared to a single temperature 10 keV plasma.
The primary emission illuminates the white dwarf surface and has some probability of being reflected (see lower panel of figure 1). The reflection probability is given by a trade–off between the importance of electron scattering and photo–electric absorption. Since the latter is energy dependent, the albedo is also energy dependent, with higher energy photons being preferentially reflected due to the smaller photo–electric opacity of the material. This gives rise to a reflected continuum spectrum that is harder than the incident spectrum in the 2–20 keV GINGA range, with an iron K fluorescence line superimposed on it. Figure 2 shows the reflected spectrum expected from the shock spectrum illuminating the cool white dwarf surface.
The X–ray shock spectrum can also be distorted by absorption from the pre–shock infalling material. This material is irradiated by the X–ray emission, so should have a complex ionization structure (see e.g. [4, 5, 6, 7]). It is also spatially extended over the X–ray source so that different segments of the X–ray emission travel through different path lengths of the material [3], especially as the accretion column is probably arc–like in cross-section, rather than circular (e.g. [1]). The column should also add further complexity from secondary emission [6, 7] and scattering [8]. Modelling including all these are being developed [9], but here we use a phenomenological description of this complex absorption in terms of a continuous (power law) distribution of neutral absorping column and covering fraction (, see also [10]).

3 THE ASCA AND GINGA SPECTRA OF BY CAM
Figure 3 shows the ASCA spectrum of BY Cam, a bright polar. The spectrum is very hard, and fitting it by a single temperature plasma gives a very high temperature of keV (). The expected multi–temperature plasma models do not help, since they include the softer cooling components, so give keV (). Clearly there is some distortion present that is hardening the observed spectrum in the ASCA bandpass. Absorption is the most obvious way to do this since Compton reflection only contributes significantly to the spectrum above 5 keV, so is unlikely to strongly affect the ASCA data. Neither simple absorption, nor partial covering, nor ionised absorption result in a smooth (rather than abrupt) hardening of the spectrum, so we use a power law distribution of column with covering fraction to approximate the complex physics. This gives a significantly better fit to the spectrum, with a physically resonable derived maximum temperature of keV for a maximum column of cm-2, with index .
While the resultant fit is statistically adequate, there are clear residuals left around the iron K line. Adding a narrow Gaussian line at 6.4 keV and reflection continuum that should accompany it gives , with a line equivalent width of eV and a reflection continuum normalisation of (where denotes the normalisation expected from an isotropically illuminated slab covering a solid angle of ) and keV. Both line and continuum are significantly detected, and the level of both is consistent with that expected from the geometry.

Substituting the primary continuum for a single temperature plasma model (and its reflection and including complex absorption as above) gives a much worse fit with for keV. The data contain significant iron L line emission which cannot be fit by the single temperature models. This is the first observational confirmation of the theoretically expected cooling of the shocked plasma in polars.
There are also GINGA data on BY Cam. These spectra extend from 2–20 keV so give better constraints on the high energy spectrum. Fitting the same models as above gives a maximum temperature of the cooling plasma of keV. Assuming that the shock only cools via bremsstrahlung then this implies that the mass of the white dwarf is (see e.g. [11]). While the mass of the white dwarf in BY Cam is not well constrained observationally, it is known that it has a substantial magnetic field of 28 MG [12] so cyclotron cooling should also be important. Cyclotron cooling can dominate over bremsstrahlung for high temperature, low density material (see e.g. [13]), so it has the effect of reducing the maximum observed X–ray bremsstrahlung temperature. For reasonable mass accretion rates it seems quite likely that the shock in BY Cam has a composite structure, cooling via both cyclotron and bremsstrahlung emission.
References
- [1] Cropper M., Sp. Sci. Rev. 54 (1990) 195
- [2] Imamura J N, & Durisen R H ApJ 268 (1983) 291
- [3] Done C., Osborne J.P., Beardmore A.P., MNRAS 276 (1995) 483
- [4] Ross R., Fabian A.C., MNRAS 193 (1980) 1P
- [5] Swank J.H., Fabian A.C., Ross R., ApJ. 280 (1984) 734
- [6] Kallman T.R., et al., ApJ. 411 (1993) 869.
- [7] Kallman T.R., Mukai K., Schlegel E.M., Paerels F.B., ApJ. 466 (1996) 973
- [8] Ishida M., Matsuzaki K., Fujimoto R., Mukai K., Osborne J.P., MNRAS 287 (1997) 651
- [9] Rainger J.F., et al 1997, in preparation.
- [10] Norton A.J., Watson M.G., King A.R., Lecture Notes in Physics Vol 385, eds Treves A., Perola G.C., Stella L., Springer–Verlag, (1991) p155
- [11] Frank J., King A.R. & Raine D., In “Accretion power in Astrophysics ”, 2d edition, Cambridge, UK: Cambridge University Press (1992)
- [12] Schwope A.D., Cataclysmic Variables and Related Objects (1996) p189 Kluwer, Dordrecht.
- [13] Wu K., Chanmugam G., Shaviv G., ApJ. 455 (1995) 260.