10.15.2: NGC 4815;08.06.03;08.12.3;10.19.2;03.13.6
bchen@mizar.am.ub.es
The spatial distribution and luminosity function of the open cluster NGC 4815
Abstract
NGC 4815 is a distant and populous open cluster, which lies in the galactic plane in a region of strong absorption. As a consequence, its membership, spatial distribution and luminosity function are not well determined. In this paper, we present an algorithm which uses both positional and photometric data simultaneously to search for open cluster members. The contribution of the field stars is estimated by our Galaxy model software. The method has been developed for deep CCD photometric observations, but it can also be used to investigate the membership in an n-dimensional space, including proper motions, radial velocity and metallicity.
A clean and well defined colour-magnitude diagram (CMD) for NGC 4815 has been obtained after decontaminating from field stars. We have investigated the spatial distribution of cluster members and the luminosity function. We have shown that the projected surface distribution of stars is well-represented by an exponentially decreasing function with a scale length of 1.67 0.06 arcmin. We have found evidence for mass segregation. The luminosity function for NGC 4815 is similar to that of the Hyades cluster, and shows a gap at = 15 mag.
keywords:
open clusters and associations:individual:NGC 4815; – Stars: luminosity function, mass function – Stars: fundamental parameters – Galaxy: stellar content – Methods: statistical1 Introduction
Galactic open clusters can be used to test both the theories of stellar evolution (Carraro et al. 1994) and the formation and kinematics of the Galactic disk (Palous et al. 1977; Sandage 1988). The advent of CCDs, with high sensitivity and linearity, has allowed observers to obtain deep photometry of open clusters. This is particularly important for distant clusters or clusters located at low galactic latitudes and highly contaminated by foreground stars (Carraro & Patat 1995). This is the case for NGC 4815 ( = 303o, =-2o), a distant open cluster lying in the galactic plane, in a region of strong absorption.
The first photometric observations of NGC 4815 were carried out by Moffat & Vogt (1973), who measured only 9 stars and did not recognize any sequence. Kjeldsen & Frandsen (1991) have obtained - CCD photometry of NGC 4815, including 599 stars, but, because of the contamination of noncluster members, they could not determine cluster membership, reddening or age. More recently, Carraro & Ortolani (1994, hereafter CO94) have obtained deeper - CCD photometry with the NTT 3.5 m telescope at the European Southern Observatory (ESO). Their sample includes 2498 stars.
Photometric observations have also been published by Phelps et al. (1994) in the context of a survey of old open clusters. Unfortunately their observations were made with a small telescope (0.9 m) and the errors in the photometric data do not allow an accurate determination of the physical properties of the cluster. To our knowledge, no proper motion study has been published in the literature. So, the studies of Kjeldsen & Frandsen (1991) and CO94 will be adopted as the reference photometric studies for this paper.
In order to investigate the cluster properties of NGC 4815, CO94 considered all stars within of the center to be open cluster members. The CMD of their cluster members (see Fig. 4 of CO94) is very similar to that of the total sample (see Fig. 2 of CO94). The red stars ( 1.5 and 16) in their CMD of cluster members are in fact non-cluster members from the stellar evolutionary point of view. Therefore, they cannot reliably discuss the spatial distribution and luminosity function of NGC 4815 because of the many field stars in the sample, and their conclusions must be considered as preliminary.
Large-format CCD observations can provide deep star counts and extend to the edge of the cluster, but the larger field and fainter magnitude limit also means that cluster sequences are contaminated with many field stars. For old open clusters, it is well-known that the brighter stars are more centrally concentrated (Reid, 1992). Thus, the radial distance from the cluster centre is not a suitable criterion by which to classify members: by choosing a large radius, the contamination of field stars increases, but by using a small radius, one can undersample the low mass stars which are not centrally concentrated, and thus bias the luminosity function. Therefore the development of an algorithm, which uses all information available (positions, photometry, and/or proper motions) simultaneously to search for open cluster members, is a necessary task prior to any study of many problems in open clusters.
In this paper, we present a new algorithm from pattern recognition theory. The advantage of our algorithm is twofold. First, we use all available information: apparent magnitude (), colour (), and positions (,) to extract open cluster members in a four-dimensional space. Second, we separate open cluster members from field stars without assuming any a priori distribution of the open cluster members. This is important for our studies about the spatial distribution and luminosity function of the cluster. We should point out that the method described in this paper is well suited to identifying members in a statistical sense, and hence allows one to study the statistical properties of the cluster. Additional methods clearly need to be used if an analysis requires only cluster members.
The paper is organized as follows: in Sect. 2, we briefly describe the structure parameters in our Galaxy model. In Sect. 3, we develop a new cluster member finding algorithm, and investigate the membership of open cluster NGC 4815. We have compared our results with those of CO94 and Kjeldsen & Frandsen (1991). In Sect. 4, the spatial distribution of cluster members and the luminosity function are discussed. Finally, we summarize the main conclusions in Sect. 5.
2 The Galaxy Model
The difficulty in cluster membership identification is the contamination by the field stars. In this paper, we use our Galaxy model to predict the distribution of the field stars in the direction of the cluster, and establish a classification system for identifying cluster members.
2.1 The starcounts Model
The main characteristics of stellar populations have been extracted from many observations, and the application of computer modeling to observations (Bahcall & Soneira 1980; Pritchet 1983; Gilmore 1984; Robin & Crézé 1986; Ratnatunga et al. 1989; Reid & Majewski 1993; Chen 1997a,b) has generated considerable interest. Models can parameterize all stellar populations and allow us to calculate the expected star counts explicitly.
We have constructed a Galactic structure and kinematic model (Chen 1997a,b), which includes a thin disk, a thick disk, and a halo. The model can predict the magnitudes, positions, colours, proper motions, radial velocities, metallicities according to the selection criteria used in the observation. A detailed description, including kinematical parameters (proper motions, radial velocity, space velocity), can be found in Chen (1997b). In the following lines we give a short description of the main structure parameters.
The method used in our Galaxy model is the numerical integration of the fundamental equation of stellar statistics, for the j-th subsystem;
| (1) |
Where is the number of stars of a given colour index at a given apparent magnitude; () is the luminosity function and (), the density law. In order to predict star counts in a given direction, a luminosity function and density distribution for each population or sub-population in the model is required. The stellar density laws used for the thin and thick disk are exponential. For the population II spheroid stars, the density law is adopted following de Vaucouleurs (1977). We adopt the luminosity function for the thin and thick disk stars given by Wielen et al. (1983). The halo luminosity function is assumed to be similar in shape to that of the disk for 4, but matching a globular cluster function at brighter magnitudes (Reid, 1993a). We adopt a CMD given by Bahcall et al. (1987) from the Yale Parallax catalog for thin and thick disk stars. For halo stars, the colour-magnitude diagram for both the main-sequence and evolved (red giant and horizontal-branch) stars is based on the table given by Bergbush & Vandenberg (1992).
The thin and thick disk giants were included separately in the model. According to Bahcall & Soneira (1981), we take the fraction of stars, , on the main sequence (MS) in the plane of the disk to be:
, 3.7
, 3.7
We have allowed for observational uncertainties by adding Gaussian errors to the magnitude and to the colour of each ’star’ generated. CO94 have obtained errors of 0.02, 0.05, and 0.07 mag at =15.5, 17.5 and 19.5 mag respectively, and at the same magnitude levels, they found dispersions in colour of 0.05, 0.11 and 0.14 mag, respectively. These results were incorporated in our Galaxy model software.
We should point out that these parameters in the model code are not the results of this investigation, but have been derived from previously published results (Bahcall & Soneira 1980; Robin & Crézé 1986; Reid & Majewski 1993; Chen 1997a; Chen 1997b).
2.2 Extinction in the line of sight
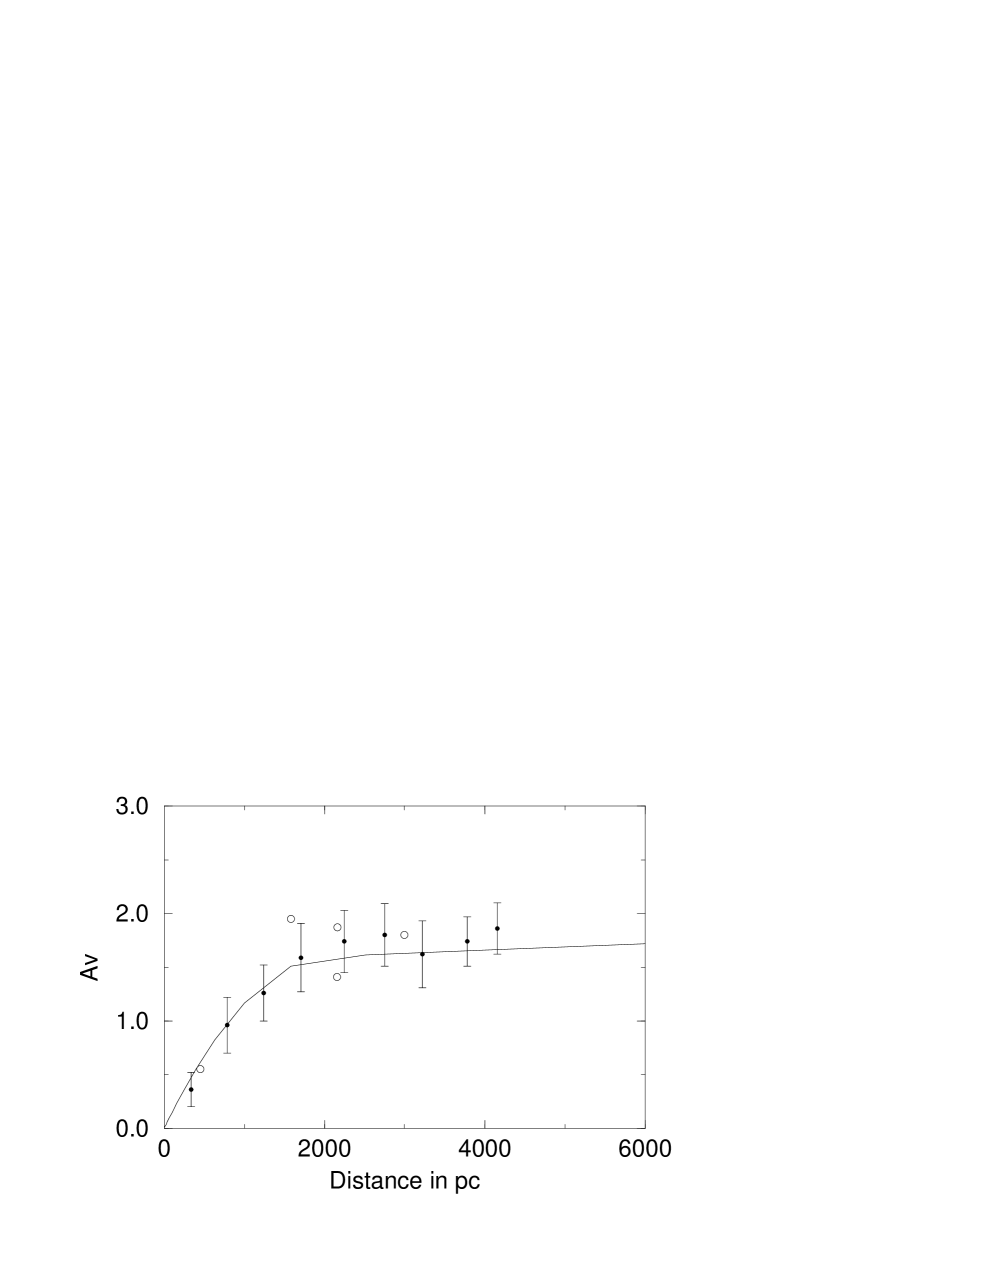
One of the important characteristics of galactic obscuration is that it is patchy, so, it is important to discuss the foreground obscuration in the region of NGC 4815 ( 2300 pc). Neckel & Klare (1980) have derived extinctions and distances for more than 11000 stars and investigated the spatial distribution of the interstellar extinction at 7o.6. Their results are shown in a series of diagrams. In Fig. 1, we plot their results (open circles) from the nearest field ( = 302o, = -3o) in the direction of NGC 4815. Using a large sample (about 17000 stars) with MK spectral types and photoelectric photometry, Arenou et al. (1992) constructed a tridimensional model of the galactic interstellar extinction. In Fig. 1, we show the results (solid line) derived by Arenou et al. (1992).
Recently, we have used Lund Catalogue of Open Cluster Data (Lyng\aa 1987) to derive an analytic expression of the interstellar extinction (Chen et al. 1997b). In Fig. 1, we have overplotted the average extinction in the galactic plane (filled circles). We can see that extinction laws derived from different methods are fairly consistent. Moreover, Bertelli et al. (1995) derived the extinction in the line of sight in the field near the cluster Lyng\aa 7 ( = 328o, = -2o.8), not far from the field of our investigation. They found an extinction of = 1.5 mag at 2000 pc, and = 2 mag at 4000 pc, which is also consistent with the results shown in Fig. 1.
In Fig. 2, we show the observed CMD for all the stars in a field of view of 12’.3 x 12’.3 from CO94. We can recognize the MS and the giant branch. Many field stars seem to contaminate the CMD, especially a red sequence parallel to the MS.
In Fig. 3, we show the simulated colour-magnitude diagram from the Galaxy model with the Arenou et al. (1992) extinction law. This predicted diagram provides us with the distribution of field stars in this direction. In following discussion, we adopt the extinction law derived by Arenou et al. (1992) in our Galaxy model.


3 Identification of NGC 4815 members
Many authors have used colour-magnitude
and colour-colour
diagrams to separate open cluster members and field stars.
When kinematic data are available, it is commonly accepted that the
membership probabilities obtained from the analysis of
proper motions or radial velocities are more reliable. The
parametric models proposed by
Vasilevskis et al. (1958) and Sanders (1971) assume that the
proper motion distributions of field stars and cluster members
can be modeled by a normal bivariate function. However, in several
cases the wings of the field star distribution are more extensively populated
than expected based on the predictions of a normal bivariate function
(Marschall & van Altena, 1987).
Cabrera-Caño & Alfaro (1990) have developed a non-parametric
approach to identify open cluster members by using proper motions
and positions as variables.
However, because their method assumes that the variables are independent,
it cannot be used with photometric data.
In this paper, we have developed a new
cluster member finding algorithm. This method, based on a non-parametric
approach, has been previously used to
identify moving group members in the solar neighborhood
(Chen et al. 1997a) and to isolate galactic thick disk stars from star count
survey
(Chen et al. 1992; Chen 1996a).
The viability of the method has been tested by a series of Monte Carlo
simulations. Results show that the method is powerful.
The detailed descriptions and numerical simulations of the method can be
found in
Chen (1996b) and Chen et al. (1997a).
3.1 The method
Let (→x1, →x2, →x3, … →xn) be a set of stars to be studied. Each star →xi is considered as one point in the four-dimensional space of position, magnitude and colour.
Let and be the number of stars in the observed and the ’simulated’ sample, respectively. The number of stars () comes from the Galaxy model and is considered as the contribution to the counts of the field stars in the direction of the open cluster. According to the Bayesian theory, the probability of a given star being an open cluster member can be derived as:
| (2) |
Where and are the a posteriori probability that an object →xi belongs to the cluster and field stars, respectively. (→xi) is the probability density function (hereafter pdf) from the observed sample, (→xi) is the class conditional pdf for field stars. The probability (c→xi) can be derived by calculating (→xi) and (→xif) at each observed star →xi.
The true (→xi) in each star can be estimated by a kernel estimator (→xi) of the density (Hand, 1982):
| (3) |
where →xi is the point at which the estimate is being made, is the number of stars in the observed sample, →xj is the observed sample set defined in d-dimensional space, (→xi -→xj)’ is the transpose of the vector (→xi -→xj) and is the variance-covariance matrix of the observed sample.
The optimal smoothing parameter derived by Silverman (1986) can be written as:
| (4) |
where is the average marginal variance, .
From the definition of the kernel estimator, we know that it is a sum of the multivariate normal density functions placed at the observations. The functions determine the shape while the smoothing parameter determines their width. Concerning the computation of the class conditional probability density function, , the procedure is the same as described above for , but we have to perform the summation over the simulated sample for the field stars.

Right panel: The CMD for the field stars. d) The stars with probability (c) 0.5, e) The stars with probability (c) 0.8, f) The stars with probability (c) 0.9


3.2 Separation of field stars from cluster members
The method described above has been used to study the membership of the open cluster NGC 4815 in the four-dimensional space of . CO94 investigated the degree of completeness for their observations, and found that the sample is almost complete to mag. In order to avoid incompleteness problems, we only analyze the stars with this limit, thus including 739 stars. The determination of those stars considered as cluster members has a probabilistic nature. In Fig. 4, we show the CMD for cluster members with probability (c) 0.5, 0.8, and 0.9, respectively. Isochrones (Alongi et al. 1993) of different metal abundance and age are overplotted.
In order to consider the influence of the observational errors ( and ) in our analysis, we have generated several sets of ’observed’ data by adding an increment (, and ) to the real values of each star. Each of these increments has been randomly chosen from a normal distribution of zero mean and standard deviation equal to the individual observational error. We found that the member probabilities are not significantly changed, indicating that the observational errors are not very important in the present analysis.
As mentioned previously, we have used the Arenou et al. (1992) extinction law in our Galaxy model. In order to consider the influence of the uncertainty due to the absorption in our analysis, we have checked our results by using the Arp (1965) reddening distribution: the absorption increases at about a rate of 1.0 mag kpc-1 for the first 2 kpc, and after 2 kpc, there is no further light absorption. This simple reddening law has been found to be in agreement with the observations along several galactic directions in the galactic plane (Arp, 1965; Paczynski et al. (1994), Ng & Bertelli, 1996; Arp & Cuffey, 1962). In Fig. 5, we show the results from the Arp reddening distribution. In Fig. 6. we show the (c) from the Arenou model (P1) against the (c) from the Arp reddening distribution (P2). ¿From Fig. 6, we can see that, for large P1 and P2 ( 0.8), the difference between P1 and P2 is small, but P1 is systematically larger than P2; for small P1 and P2 ( 0.5), the difference between P1 and P2 becomes larger. For example, with (c) 80%, we found 378 stars with the Arenou et al. (1992) extinction model, and 314 stars with the Arp reddening distribution. Therefore, we can say that the uncertainty due to the absorption in our analysis does not change too much the likely open cluster members (P(c) 80%). However, we should point out that, to derive more reliable membership probabilities, one should have a good knowledge about the extinction law in the direction of the cluster.
To our knowledge, the only investigation in the literature of the cluster membership for NGC 4815 is that of CO94. They separate cluster stars from field stars by using a radius of arcmin. In Fig. 7, we show the CMD for the cluster members by the criterion of CO94 for stars with V 17 mag. It can be seen that the use of only position to determine the cluster membership leads to a significant contamination by field stars ( 16 and 1.5). In a standard cluster analysis, identifying cluster members is a process of attrition - first selecting by position (or proper motion), then removing photometric non-members, then spectroscopic non-members and so forth. Our method, combining position and into a single step, enlarges the statistical ”distance” between the field stars and cluster members, thus reducing the contamination due to the field. Moreover, our method, using a probability classification, can provide an unbiased estimation of the intrinsic distribution of the cluster stars.
Another database for NGC 4815 in the literature is that from Kjeldsen & Frandsen (1991), who obtained CCD observations. In Fig. 8, we show the colour-magnitude diagram for their observations. As pointed out by Kjeldsen & Frandsen (1991), we can see that the CM diagram contains many non-members. In any case a MS with a turn-off is still clearly visible. We found that the isochrone of = 0.008 for an age of 500 Myr can basically explain the observations of Kjeldsen & Frandsen (1991), which is consistent with our result from CO94 sample.
4 The spatial distribution and luminosity function of NGC 4815
In this section, the cluster member probability discussed above is used to investigate the spatial distribution and luminosity function of NGC 4815. Both CO94 and this investigation have shown that NGC 4815 has an age of about 500 - 600 Myr, which is similar to the age of the Hyades cluster (625 50 Myr) derived by Lebreton et al. (1997) from Hipparcos observations. It is very interesting to compare our results with that of the Hyades cluster, which has been widely studied and whose properties are well understood.
4.1 Luminosity function
It is very important to study the cluster luminosity function because it can provide information about both the initial mass function and the cluster dynamical evolution. Cluster membership probabilities were used to determine the luminosity functions for the cluster. The luminosity function () was obtained as:
| (5) |
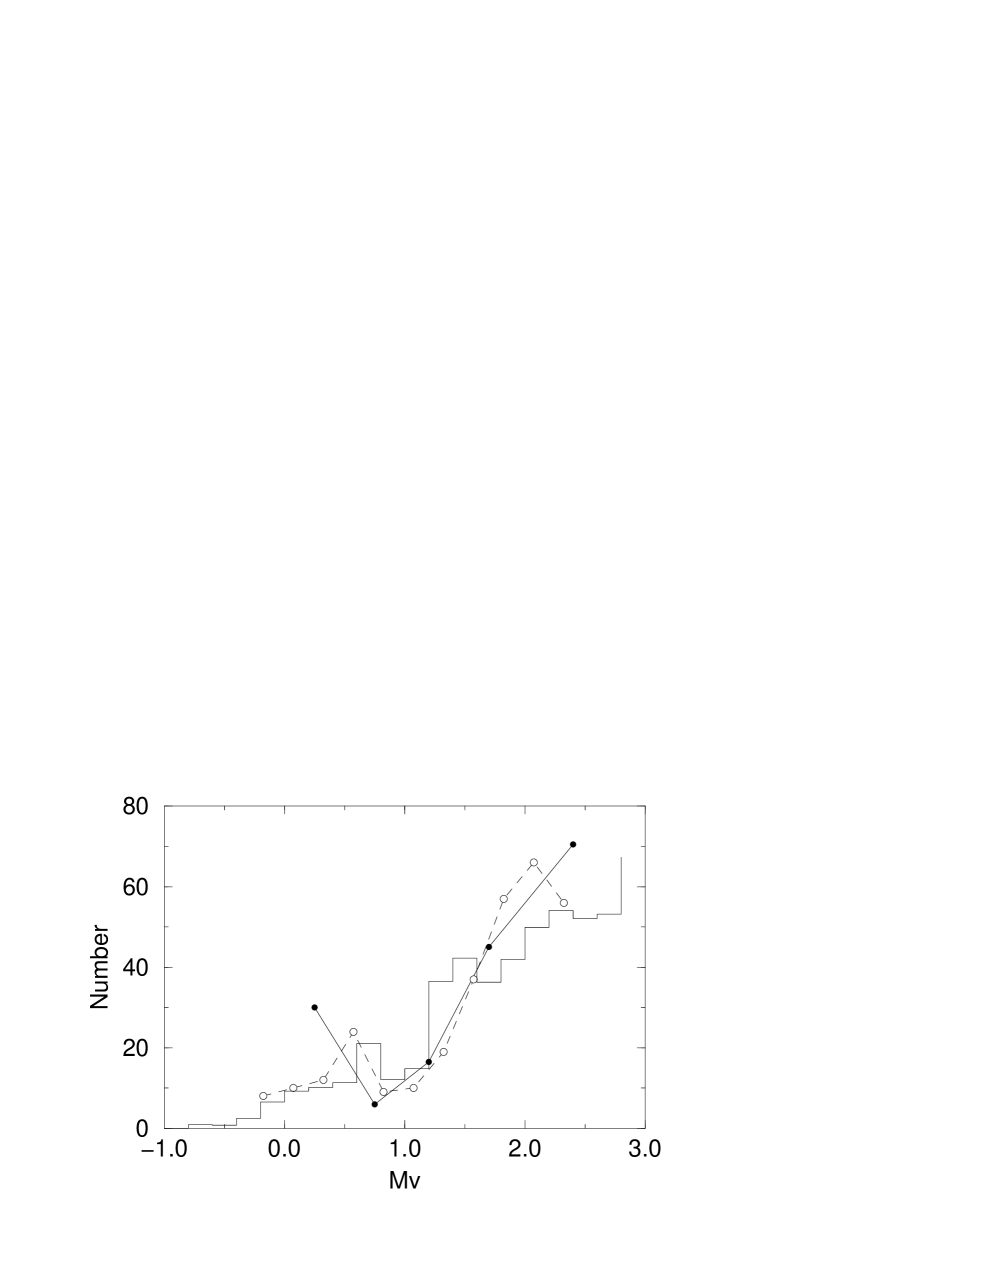
Where P(c) is the membership probability of star , is the bin size. Table 1 and Fig. 9 show the resulting luminosity function for NGC 4815.
Our results show that the luminosity function increases at = 14.0 mag ( = -0.2) around the MS turnoff, with a prominent drop at = 15 mag (=0.8) that corresponds to the MS gap. The presence of a gap in the distribution of stars near the MS turnoff region is a common feature of old (M67, Montgomery et al 1993) and intermediate age (NGC 7789, Roger et al. 1994) open clusters. The gap is considered as a real feature corresponding to the evolutionary behaviour of stars at the end of their core H-burning stage when they undergo the overall contraction phase (Carraro et al. 1994). This gap can also be seen in the CMD for all observed stars as well (see Fig. 2). However the luminosity function derived by CO94 did not show this feature, probably due to the presence of many field stars that were mis-classified as cluster members. In Fig. 9 we have overplotted the luminosity function of the Hyades clusters from Reid (1993b) and NGC 7789 from Roger et al. (1994).
| 13.3 | -0.9 | 0.9 |
| 13.5 | -0.7 | 0.8 |
| 13.7 | -0.5 | 2.5 |
| 13.9 | -0.3 | 6.5 |
| 14.1 | -0.1 | 9.2 |
| 14.3 | 0.1 | 10.1 |
| 14.5 | 0.3 | 11.3 |
| 14.7 | 0.5 | 21.1 |
| 14.9 | 0.7 | 12.1 |
| 15.1 | 0.9 | 14.8 |
| 15.3 | 1.1 | 36.5 |
| 15.5 | 1.3 | 42.3 |
| 15.7 | 1.5 | 36.3 |
| 15.9 | 1.7 | 42.0 |
| 16.1 | 1.9 | 49.9 |
| 16.3 | 2.1 | 54.1 |
| 16.5 | 2.3 | 52.1 |
| 16.7 | 2.5 | 53.2 |
| 16.9 | 2.7 | 67.3 |
Given the luminosity function derived from our data, we can apply mass-luminosity relations to derive an estimate of the total mass of the NGC 4815. We have used the relation
| (6) |
| (7) |
derived from Andersen’s data (1991). ¿From masses (, in solar mass) and membership probabilities, the observed mass in the cluster can be determined from P(c). To the limit of the photometry, we find a mass of the cluster of 912 solar masses. In Fig. 10, we show the derived mass function () for the NGC 4815. By using a least-squares fit, we found that the mass function has a slope of -2.2 0.3 for 1.5 2.3 in the plane of ( (), (). Francic (1989) has derived the slope for the composite mass function for six clusters with a mean age of 400 Myr, he found d /d () = -1.97 0.17 for 1.1 2.5. His result is in agreement with our result in this paper, considering the error bars. Our result is also in good agreement with the value determined by Scalo (1986) for the field stars (-2.0 0.18 for 0.8 18).
4.2 The spatial distribution of cluster members
We have taken annuli with a width of 0.3 arcmin centered on the cluster center and have counted the numbers of stars ( = (c) falling within each annulus. Fig. 11 shows the radial density distribution for the cluster NGC 4815, where the error bars were calculated assuming that the number of stars in a bin is governed by Poisson statistics.
It was shown by Van den Bergh & Sher (1960) that the projected surface distribution of stars for an open cluster can be represented by , where is the scale length for the projected surface density of cluster members. We have used this exponentially decreasing function of the distance from the cluster center to fit our results, and found the scale length to be = 1.67 0.06 arcmin. Since the distance to NGC 4815 is known, we can transform the angular scalelength to a linear distance. Assuming that the cluster is symmetric, we can calculate the average volume density of stars within the cluster. For the inner region of the cluster ( 1.67 arcmin), we derive an average density of 47.5 stars/pc3 and a mean separation of 0.171 pc. If we calculate the density at the edge of the cluster, taken to be at a diatance of 4.0 arcmin (see Fig. 11), we find an average density of 7.9 stars/pc3 with a mean separation of 0.312 pc.
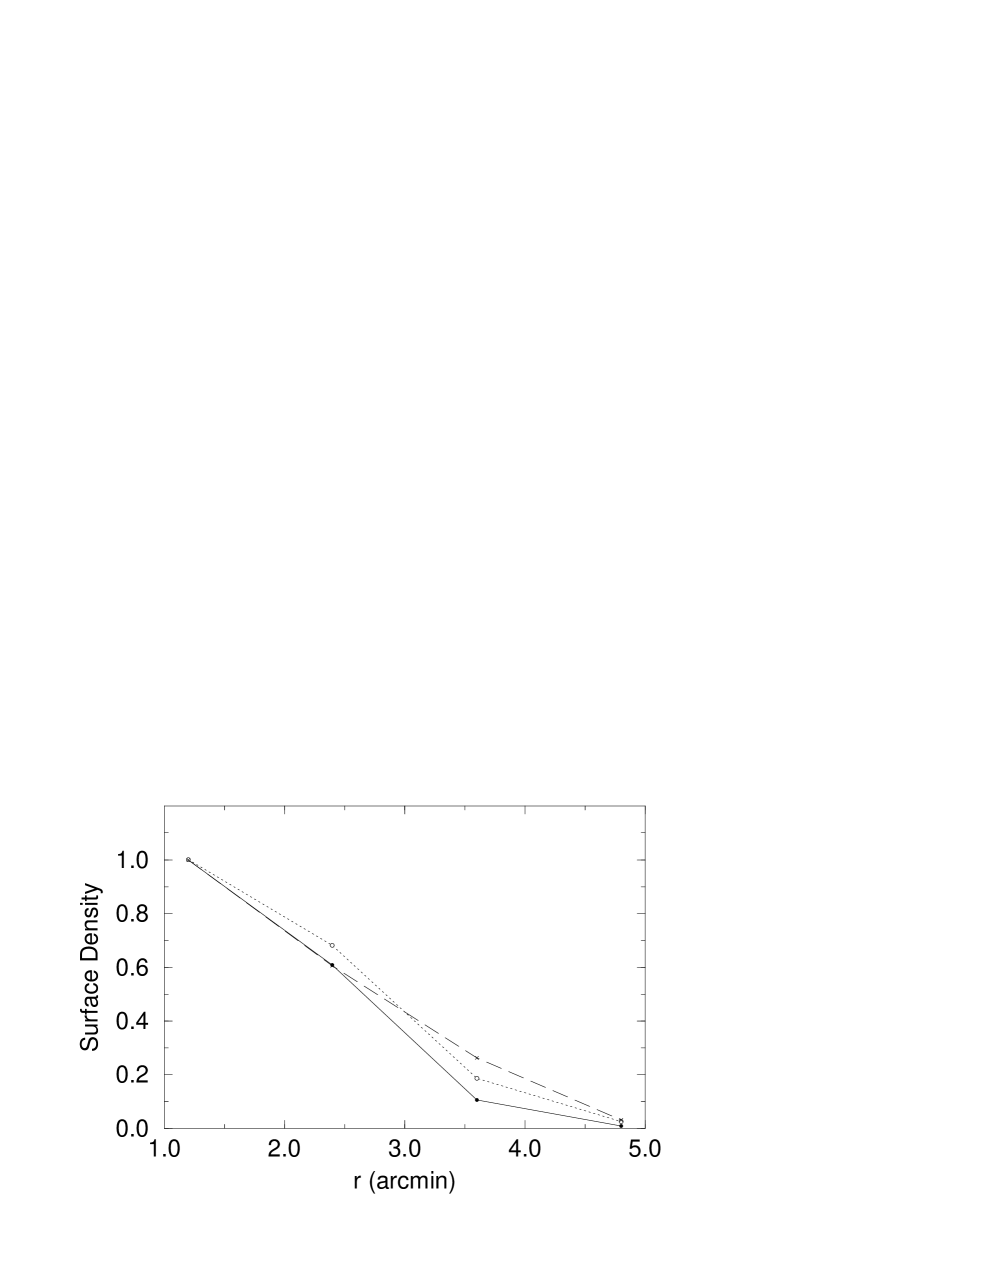
Reid (1992) has studied the Hyades cluster members and found that the brighter stars are more centrally concentrated (mass segregation). In order to look for similar evidences in NGC 4815, we have divided our cluster members into three magnitude ranges, 15 14; 16 15; 17 16. In Fig. 12 we plot the surface density distributions for these three magnitude ranges, all distributions have been normalized to the surface density at = 1.2 arcmin. From Fig. 12, we can see that the brighter stars are slightly more centrally concentrated, as one would expect from mass segregation. However, because the sample used here is limited with 17 mag, the observational evidence is limited. Deeper samples are needed to confirm this result.
5 Conclusions
We have developed a new algorithm, which uses both positional and photometric data simultaneously to search for open cluster members. The algorithm can be extended to use all possible variables, including proper motions, radial velocity and multi-color photometry automatically. When the contamination of field stars is not very serious, then simple methods can be used to identify cluster members (radial distance from the centre; position in the colour-magnitude diagram; etc); if field star contamination is significant, then one requires a more sophisticated technique. The method developed in this work, which uses all variables simultaneously to search for open cluster members, gives better results. This is particularly true when cluster stars lie beyond the observed sample that is used, where the contamination of field stars is difficult to estimate.
The algorithm has been used to isolate open cluster members of NGC 4815 from the field stars. We have compared our results with those of CO94. A clean and well defined colour-magnitude diagram (CMD) for the cluster has been obtained from our new algorithm. After determining the cluster member probability, for the first time we have investigated the spatial distribution of the cluster NGC 4815 and its luminosity function. To summarize, we find that:
-
1.
NGC 4815 is a cluster of the Hyades generation, with an age of about 500 - 600 Myr.
-
2.
the projected surface distribution of stars is well-represented by an exponentially decreasing function with a scale length of 1.67 0.06 arcmin.
-
3.
there is evidence for mass segregation.
-
4.
the luminosity function for NGC 4815 is similar to that of Hyades cluster, and shows a gap at = 15 mag.
-
5.
to the limit of the photometry, the observed mass is of about 900 solar masses for NGC 4815
-
6.
the mass function has a slope of -2.2 0.3 for 1.5 2.3 in the plane of ( (), ()).
These observational results are important, and can be used to constrain models of stellar evolution (Carraro et al. 1994). Other contaminated open clusters are going to be analyzed in the future.
Acknowledgements.
This research was started when one of us (BC) was invited to visit Beijing Astronomical Observatory (BAO) by the National Natural Science Foundation of China. We thank Drs. S. Ortolani, F. Figueras and L.C. Deng for helpful comments. BC acknowledges financial support from the Ministerio de Educatión y Ciencia. This work has been supported by CICYT under contract PB95-0185.References
- [1] Alongi M., Bertelli G., Bressan A., et al., 1993, A&AS 97, 851
- [2] Andersen J., 1991, Astronomy & Astrophysics Review, 3, 91
- [3] Arenou F., Grenon M., Gómez A., 1992, A&A 258, 104
- [4] Arp H., 1965, ApJ 141, 43
- [5] Arp H., Cuffey J., 1962, ApJ 136, 51
- [6] Bahcall J.N., Soneira R.M., 1980, ApJS 47, 357
- [7] Bahcall J.N., Soneira R.M., 1981, ApJ 246, 122
- [8] Bahcall J.N., Casertano S., Ratnatunga K.U., 1987, ApJ 320, 515
- [9] Bergbush P.A., Vandenberg D.A., 1992, ApJS 81, 163
- [10] Bertelli G., Bressan A., Chiosi C., Ng Y.K., Ortolani S., 1995, A&A 301, 381
- [11] Cabrera-Caño J., Alfaro, E.J., 1990, A&A 235, 94
- [12] Carraro G., Ortolani S., 1994, A&AS 106, 573 (CO94)
- [13] Carraro G., Patat F., 1995, MNRAS 276, 563
- [14] Carraro G., Chiosi C., Bressan A., Bertelli G., 1994, A&AS 103, 375
- [15] Chen B., 1996a, A&A 306, 733
- [16] Chen B., 1996b, A&AS 118, 181
- [17] Chen B., 1997a, AJ 113, 311
- [18] Chen B., 1997b, ApJ 491, 181
- [19] Chen B., Crézé M., Robin A.C., Bienaymé O., 1992, Annual Conference on Astronomical Data Analysis Software and Systems (ADASS) . Boston, USA, 489
- [20] Chen B., Asiain R., Figueras F., Torra J., 1997a, A&A 318, 29
- [21] Chen B., Vergely J.L., Valette B., Carraro G., 1997b, A&A in preparation
- [22] de Vaucouleurs, G., 1977, AJ 82, 456
- [23] Francic S., 1989, AJ, 98,888
- [24] Gilmore G., 1984, MNRAS 207, 223
- [25] Hand D.J., Discrimination and classification, John Wiley & Sons Ltd. 1981
- [26] Kjeldsen H., Frandsen S., 1991, A&AS 87, 119
- [27] Lebreton Y., Gómez A.E., Mermilliod J.C., Perryman M.A.C., 1997, in Hipparcos Venice’97 symposium, ESA SP-402, in press
- [28] Lyng\aa G., 1987, ”Catalogue of Open Cluster Data”, th edition, distributed by Centre de Données Stellaires, Strasbourg, France
- [29] Marschall L.A., van Altena W.L., 1987, AJ 94, 71
- [30] Moffat A.F.J., Vogt N., 1973, A&AS 10 135
- [31] Montgomery K.A., Marshall L.A., Janes K.A., 1993, AJ 106, 181
- [32] Neckel Th., Klare G., 1980, A&AS 42, 251
- [33] Ng Y.K., Bertelli G., 1996, A&A 315, 116
- [34] Paczynski B., Stanek K.Z., Udalski A., Szymanski M., Kaluzny J., Kubiak M., Mateo M., 1994, AJ 107, 2060
- [35] Palous J., Ruprecht J., Dluzhnevskaia O.B., Piskunov T., 1977, A&A 61, 27
- [36] Phelps R.L., Janes K.A., Montgomery K.A., 1994, AJ 107, 1079
- [37] Pritchet C., 1983, AJ 88, 1476
- [38] Ratnatunga K.U., Bahcall J.N., Casertano S., 1989, ApJ 339, 106
- [39] Reid I.N., 1992, MNRAS 257, 257
- [40] Reid I.N., 1993a, Galaxy Evolution: The Milky Way perspective, ASP Conference series, vol. 49, p. 37
- [41] Reid N., 1993b, MNRAS 265, 785
- [42] Reid N., Majewski S.R., 1993, ApJ 409, 635
- [43] Robin A.C., Crézé M., 1986, A&A 157, 71
- [44] Roger C.M., Paez E., Castellani V., Straniero O., 1994, A&A 290, 62
- [45] Sanders W.L., 1971, A&A 14, 226
- [46] Sandage A.R., 1988, ed. A.G.D. Philip, Calibrating Stellar Ages (L. Davis Press, Schenectedy) p. 37
- [47] Silverman, B.W.,1986, Density estimation for statistics and data analysis, J.W. Arrowsmith Ltd, Bristol
- [48] Vasilevskis S., Klemola A., Preston G., 1958, AJ 63, 387
- [49] Van den Bergh S., Sher D., 1960, Publ. David Dunlap Obs., 2, 203
- [50] Wielen R., Jahreiss H., Kruger R., 1983, in The Nearby Stars and the Luminosity Function, IAU. coll. 76, p. 163