Radio continuum and H i observations of supernova remnnant G296.8–00.3
Abstract
We present Australia Telescope Compact Array (ATCA) observations of the supernova remnant (SNR) G296.8–00.3. A 1.3-GHz continuum image shows the remnant to have a complex multi-shelled appearance, with an unusual rectangular strip running through its centre. H i absorption yields a kinematic distance to the remnant of kpc, from which we estimate an age in the range yr. The ATCA’s continuum mode allows a measurement of the Faraday rotation across the band, from which we derive a mean rotation measure towards the SNR of 430 rad m-2. We consider possible explanations for the morphology of G296.8–00.3, and conclude that it either has a biannular structure, as might be produced through interaction with an asymmetric progenitor wind, or that its appearance is caused by the effects of the surrounding interstellar medium.
We argue that the adjacent pulsar J1157–6224 is at a similar distance as the SNR, but that a physical association is highly unlikely. The pulsar is the only detectable source in the field in circular polarization, suggesting a method for finding pulsars during aperture synthesis.
keywords:
circumstellar matter — pulsars: individual (J1157–6224) — radio lines: ISM — shock waves — supernova remnants: individual (G296.8–00.3) — techniques: polarimetric1 Introduction
The expanding shock front produced by a supernova (SN) explosion is best delineated in the radio continuum, where we observe the synchrotron emission from ultra-relativistic electrons at or near the expanding shock. Few supernova remnants (SNRs) appear circular and undistorted, but whether this distortion is a result of the distribution of the ejecta driving the shock front, the mass-loss history of the progenitor, the structure of the surrounding interstellar medium (ISM) or some complex combination of all of these, is a difficult question to answer. Of the 215 known SNRs in the Galaxy [1996], many have now been observed at sub-arcmin resolution at radio frequencies (e.g. Whiteoak & Green 1996). However, without knowledge of their physical properties interpretation of their appearance is difficult.
Although detected in early radio surveys of the Galactic Plane [1968, 1969], G296.8–00.3 was first identified as a supernova remnant by Large & Vaughan [1972] on the basis of its spectral index and rough shell-like morphology. These authors claimed an association with the pulsar J1157–6224 (B1154–62), 13 arcmin from the remnant’s centre, which has since been considered unlikely on the basis of the pulsar’s large timing age of yr [1995c, 1996]. A recent higher resolution image (43 49 arcsec) of this SNR has been made at 843 MHz by Whiteoak & Green [1996], showing a complicated multi-ringed structure, brightest to the north-west.
In X-rays, Hwang & Markert [1994] report a 4- detection of SNR G296.8–00.3 with ROSAT PSPC. They ascribe the weakness of the X-ray emission to significant absorption along the line of sight, and consequently estimate a distance of kpc. There is no detectable infrared emission associated with the SNR [1989, 1992], and examination of the Digitized Sky Survey and of the corresponding ESO R field shows no optical counterpart.
As part of a programme to determine the basic properties of southern SNRs with unusual features, we present in this paper 1.3-GHz continuum and H i absorption observations towards SNR G296.8–00.3. We describe our observations and analysis in Section 2 and present our results in Section 3. In Section 4 we derive physical properties for the SNR and discuss possible causes for the remnant’s unusual morphology. We also consider the possibility of an association between SNR G296.8–00.3 and PSR J1157–6224.
2 Observations and data reduction
Observations were made with the Australia Telescope Compact Array (ATCA; Frater, Brooks & Whiteoak 1992), a synthesis telescope near Narrabri, New South Wales. The ATCA consists of five 22-m-diameter antennae located on a 3-km east-west track, with a fixed sixth antenna located 3 km further west. A pointing centre RA (J2000) , Dec (J2000) was observed with three different array configurations, as shown in Table 1. For the compact configurations used here, correlations involving the sixth antenna were not used. Continuum and H i line observations were made simultaneously; the continuum data consisted of 32 channels centred at 1.344 GHz with a total bandwidth of 128 MHz, and the line data comprised 1024 channels centred at 1.420 GHz, with a total bandwidth of 4 MHz (a channel separation of 0.83 km s-1). All four Stokes parameters were recorded in continuum, while only total-intensity data were recorded in the H i line. Amplitudes were calibrated using the revised scale of Reynolds [1994], assuming a flux density for PKS B1934–638 of 15.0 and 14.9 Jy, at 1.344 and 1.420 GHz respectively (1 Jy W m-2 Hz-1). Phases were calibrated using PKS B1549–790, which was observed for approximately 3 min for each hour of observation.
| Date | Array | Maximum | Time on |
|---|---|---|---|
| Configuration | Baseline (m) | Source (h) | |
| 1996 Jan 19 | 0.75C | 750 | 12 |
| 1996 Feb 02 | 0.75B | 765 | 11 |
| 1996 Feb 24 | 1.5C | 1485 | 14 |
Reduction and analysis were carried out using the Miriad [1995] and Karma [1996] packages. Data were edited and calibrated using standard techniques [1997]. The calibrator PKS B1549–790 (S Jy) was confused by the source PKS B1547–795 (S Jy), 27 arcmin distant. Thus a point-source model for the calibrator was not appropriate, and antenna gains were determined by comparing the measured visibilities to those corresponding to a model including both sources, in effect carrying out a self-calibration of the calibrator field.
2.1 Continuum data
A total-intensity continuum image of a 65-arcmin square region was formed using multi-frequency synthesis [1994], uniform weighting and a cell size of 5 arcsec. The image was then deconvolved using a maximum entropy algorithm [1978] with 500 iterations. To improve estimates of the antenna gains, three iterations of amplitude and phase self-calibration were applied, with a solution interval of 5 min. The resulting model was smoothed with a Gaussian restoring beam, and the final image then corrected for the mean primary beam response of the ATCA antennae.
Images were also formed in Stokes Q, U and V. To minimise the effects of bandwidth depolarization, 13 Q and U images were made, each using a bandwidth of 8 MHz, covering the central 104 MHz of the band. Stokes Q, U and V images were then deconvolved using the CLEAN algorithm [1980], then restored and primary-beam corrected as for Stokes I above. For each pair of Stokes Q and U images, a linear polarization image, L, was formed and corrected for non-Gaussian noise statistics [1986]. A mean of the 13 L planes was then formed. This image was then clipped at pixels where polarized emission fell below the 5- level, and also where the total intensity was less than 5 .
2.2 Line data
Continuum emission was subtracted from the line data in the plane using the Miriad task UVLIN [1990, 1994], and spectra then smoothed to a velocity resolution of 3.3 km s-1. Data at projected spacings shorter than 1 k were discarded to filter out broad-scale structure, and line images were then formed in velocity planes ranging from –200 to +200 km s-1 (LSR). The peak emission was faint, with no obvious sidelobes, and it was consequently unnecessary to deconvolve the resulting images.
The H i cube was then weighted by the continuum image. Absorption spectra against continuum sources were produced by integrating over the corresponding region of the cube, and then renormalising appropriately to give units of fractional absorption.
The rms noise, , in each spectrum was estimated using the flux in line-free channels. The brightness temperature of Galactic H i in this direction ( K; Caswell et al. 1975) increases the thermal noise in channels containing line emission by a factor of (cf. Dickey 1997). In the spectra presented we thus show a threshold corresponding to 6 as an indication of the believability of features.
3 Results
3.1 Total Intensity
3.1.1 SNR G296.8–00.3
Total-intensity images of SNR G296.8–00.3 in Fig 1 show a complicated structure similar to that seen with lower resolution at 843 MHz [1996]. The SNR consists of multiple loops of emission, brightest in the north-west, where there is a sharp outer boundary. While the western edge is particularly well defined, the eastern perimeter is fainter and more diffuse.
Running through the centre of the remnant is a peculiar, slightly curved strip of emission, beginning beyond the remnant’s northern boundary and extending up, or close, to its southern perimeter. This structure shows no limb-brightening, and has an essentially uniform appearance across its extent except for a possible fading to the south. Although appearing rather artificial, this feature is also seen in the 843-MHz image made with the Molonglo Observatory Synthesis Telescope (MOST; Whiteoak & Green 1996). Although both are synthesis telescopes, the ATCA and the MOST produce quite different artifacts [1991] and we conclude that this feature corresponds to genuine emission.
Derived parameters for the SNR are given in Table 2. The flux density for the remnant and its uncertainty were determined by integrating the emission within multiple polygons enclosing the remnant. A background correction was made and the rms noise in the image measured by similarly integrating over nearby source-free regions.
| Resolution | , PA 14∘ |
|---|---|
| rms noise in image | 170 (Stokes I) |
| (Jy beam-1) | 40 (Stokes V) |
| Geometric centre (, ; J2000) | –62°36′ |
| Geometric centre (, ) | 29687 –0035 |
| Diameter (arcmin) | |
| Flux density at 1.3 GHz (Jy) | |
| Spectral index |
We compute a spectral index for SNR G296.8–00.3 using the total flux density measurements shown in Table 3. Fitting a power law of the form to the data, we obtain a spectral index , consistent with earlier determinations [1972, 1975].
3.1.2 Other sources in the field
An image of the entire field is shown in Fig 2. The properties of four sources of note are summarised in Table 4.
Source 1 can be identified with the 400-ms pulsar J1157–6224 [1969, 1993]. We measure an integrated flux density for the pulsar of mJy, agreeing with previous measurements [1996].
| Source | Position | Spectral indexa | Other name | |||
|---|---|---|---|---|---|---|
| Equatorial (J2000) | Galactic | (Jy) | (, ) | |||
| 1 | 11h57m15s –62°24′50″ | 29670 –0020 | 0.01 | –2.6 | PSR J1157–6224 | |
| 2 | 11h57m20s –62°43′50″ | 29678 –0051 | 0.08 | –0.5 | ||
| 3 | 11h59m32s –62°07′19″ | 29690 –0014 | 0.62 | –0.9 | PMN J1159–6207 | |
| 4 | 12h01m21s –62°36′44″ | 29721 –0030 | 0.11 | –0.6 | ||
a Calculated between 1.344 GHz (this paper) and 843 MHz (A.J. Green et al., in preparation).
3.2 Polarization
3.2.1 PSR J1157–6224
As a test of the polarimetric quality of our data, we first consider PSR J1157–6224, whose polarization properties we can compare with existing data.
PSR J1157–6224 is significantly linearly polarized: we measure a linear polarization L mJy ( per cent), agreeing well with previous measurements [1978, 1980, 1997].
The ATCA generates instrumental linear polarization proportional to the strength of a source in total intensity. This response is negligible at the phase centre, but becomes significant towards the edges of the field. The primary-beam corrected linear polarization for the pulsar caused by this effect is of the order of 0.2 per cent of the total intensity and makes a minor contribution to the value obtained.
The multi-frequency capability of the ATCA allows us to measure the variation in position angle, , of the pulsar’s linearly polarized emission across the observing bandwidth, as shown in Fig 3. This can be attributed to Faraday rotation, and we can hence derive a rotation measure for the pulsar. Fitting a curve with functional form to the data gives a rotation measure RM rad m-2. Within the uncertainties, this agrees with the published value of rad m-2 [1993].

PSR J1157–6224 is left-hand circularly polarized with a flux density mJy ( per cent of the total). This is again consistent with earlier work.
In summary, we conclude that the observed polarization properties of PSR J1157–6224 agree well with previous measurements.
3.2.2 SNR G296.8–00.3
No circular polarization is detected from SNR G296.8–00.3. An image of the linear polarization from the remnant is shown in Fig 4. We estimate a lower limit on the linearly polarized flux density from the remnant of mJy, a fractional polarization of 0.5 per cent (instrumental polarization contributes less than 0.1 per cent). Polarization from the SNR occurs in a few discrete cells, predominantly near the north-eastern edge of the SNR (note that region ‘A’ is not coincident with the compact knot in this region of the SNR). Within a cell there appears to be some correlation in position angle but adjacent cells have quite different orientations. There is no correlation between total and polarized intensity over the SNR. In fact the brightest regions of the SNR, namely the north-west, south-west and south edges, have no significant polarized emission.

In Fig 5 we show the position angle as a function of frequency for four regions of significant linear polarization. As for PSR J1157–6224, a change in position angle of the electric field vectors is seen across the band. Averaging over regions of sufficiently strong polarization, we obtain a mean RM for the remnant of 430 rad m-2, with a scatter of 40 rad m-2.

In theory, one can use the rotation measure to determine the intrinsic position angle of the polarized radiation, . However, the accuracy, , of this measurement is limited by the uncertainty in RM, (RM). Typical values of (RM) across the SNR are 20–30 rad m-2, corresponding to . Thus we cannot determine intrinsic position angles, effectively because of the narrow bandwidth across which we have made our measurements.
3.2.3 Other sources
After correcting for instrumental polarization, sources 2, 3 and 4 are 0.2, 2.7 and 1.4 per cent linearly polarized respectively. No circular polarization is detected from any of these sources.
3.3 H i line
In the following discussion we establish upper and lower limits on the systemic velocity of SNR G296.8–00.3 by measuring the H i velocities of absorbing clouds along the line of sight and combining these with an appropriate model for Galactic rotation to derive a kinematic distance to the remnant (see Burton 1988 for a review). We compare absorption against the remnant to adjacent emission and absorption spectra; the former is obtained from nearby regions devoid of continuum emission, while the latter is seen towards sources 2 and 4.
We define the lower limit on the systemic velocity, , to be that corresponding to the most distant absorption feature seen against the SNR, and the upper limit, , to be the nearest strong emission feature in the region not seen in absorption (e.g. Frail & Weisberg 1990). We adopt an uncertainty of km s-1 in and , representative of the random motion of H i clouds [1982, 1984]; uncertainties associated with estimating velocities from our spectra are somewhat smaller than this. When translating velocities into distances, we adopt standard IAU parameters [1986] for the solar orbital velocity ( km s-1) and the distance to the Galactic Centre ( kpc).
The lack of short spacings in our ATCA observations means that it is difficult to produce an emission spectrum from these data. However, we can compare ATCA absorption spectra to the emission spectrum seen towards PSR J1157–6224 [1996], only 7 arcmin from the brightest part of the SNR. This spectrum is shown in Fig 6, together with the single-dish absorption towards the pulsar and the rotation curve in this direction. The emission spectrum contains strong ( K) features at –35, –5, +15, +30 and +50 km s-1. Similar emission profiles are seen in the direction of the nearby H ii regions G298.2–00.3 and G298.9–00.4 [1972] and in the H i survey of Kerr et al. [1986].

3.3.1 Point sources
Absorption was measured against the nearby sources 2 and 4, with spectra shown in Fig 7. The absorption spectrum obtained towards source 3 was noisy and not considered useful.


The most negative velocity absorption feature seen in the spectrum of source 2 is at –35 km s-1, agreeing well with the measured tangent velocity in this direction [1986, 1995]. Significant absorption is also seen at –5, +15 and +30 km s-1. A weak feature at +100 km s-1 is of low significance.
Source 4 shows similar structure to source 2 at negative velocities. At positive velocities, strong absorption is seen at +15 km s-1, and a forest of weaker features is visible at +30, +40, +50, +65 and +110 km s-1. Although each feature individually is of marginal significance, together they suggest true absorption rather than random fluctuations.
3.3.2 SNR G296.8–00.3
Spectra of reasonable signal-to-noise were seen against the two regions of the SNR indicated in Fig 2: the bright rim along the SNR’s north-west edge, and a nearby knot in the interior. These spectra are shown in Fig 7.
Against the rim of the SNR, absorption seen at negative velocities corresponds to emission seen towards the pulsar and absorption towards sources 2 and 4. At positive velocities, clear absorption is seen at +15 km s-1 and a weaker feature at +35 km s-1. Beyond this the spectrum is consistent with noise. Absorption towards the knot at negative velocities is similar to that towards the rim. Strong absorption is also seen at +15 km s-1but not beyond this point.
The weak feature seen against the rim at +35 km s-1 matches the +30-km s-1 feature clearly seen towards source 2 only approximately. While this difference in velocity is within the uncertainties associated with H i, emission towards the pulsar, much closer to the rim than source 2, also shows a feature peaking at +30 km s-1. This seems to indicate a genuine discrepancy in velocity between the +35-km s-1 feature towards the SNR and +30-km s-1 absorption towards source 2. Furthermore, while the two SNR spectra are otherwise similar the +35-km s-1 feature is not seen against the knot, despite its proximity to the rim. One could argue that the knot is an unrelated foreground source but we think it more likely that the +35-km s-1 feature represents fluctuations in emission rather than true absorption, and assign lower and upper limits to the remnant of km s-1and km s-1 respectively. Given an uncertainty of km s-1, we can assign an overall systemic velocity to the SNR of km s-1.
4 Discussion
4.1 SNR G296.8–00.3
4.1.1 Physical Parameters
Adopting the best fitting model for Galactic rotation of Fich, Blitz & Stark [1989], we use the velocity determined for the SNR in Section 3.3.2 to derive a kinematic distance of kpc, putting it on the far side of the Carina arm. This is consistent with Hwang & Markert’s [1994] estimate based on the lack of X-ray emission. A distance of 9.7 kpc has also been estimated from the relation [1983]. However, given the large uncertainties in this method [1984], this agreement is certainly fortuitous.
Using the brightest regions (‘ring 1’ – see Fig 8) to define a single SNR shell, we find a radius for G296.8–00.3 of pc. An upper limit on the remnant’s age can consequently be obtained by assuming that it has expanded into the ambient ISM. For an ambient density cm-3, the mass swept up by the SNR is . Typical values of then imply that the ejecta have swept up many times their own mass and that the remnant is no longer freely expanding. If we assume that the remnant is in the adiabatic (Sedov–Taylor) phase, we can derive an age yr, where is the kinetic energy of the explosion in units of erg. Frail, Goss & Whiteoak [1994] suggest typical values and , implying that yr.
4.1.2 Polarization
The rotation measure of 430 rad m-2 derived for the SNR in Section 3.2.2 differs from the value of rad m-2 measured by Dickel & Milne [1976] over the north-east part of the remnant. Given that we obtain polarization data for PSR J1157–6224 consistent with earlier measurements, we have confidence in our results. In any correction for Faraday rotation, there is always an ambiguity of (). The discrepancy in rotation measures can be accounted for if Dickel & Milne’s result (obtained using data at 2.7 and 5 GHz) is out by a half-turn, causing them to underestimate the rotation measure by 360 rad m-2. It is unlikely that there is any further ambiguity in the data: at the 8-MHz frequency resolution of the ATCA observations, a further half-turn would increase the RM by rad m-2.
Although the theoretical fractional polarization of synchrotron radiation is 70 per cent, this SNR is quite typical in having a much lower value, indicating that the remnant has been depolarized. We can immediately rule out bandwidth depolarization as a possible cause since, by imaging the polarized emission in several frequency planes before combining, we have reduced Faraday rotation across each channel to .
The cell structure of the polarized emission, with significant changes in position angle between adjacent regions, suggests that the SNR has been beam depolarized, i.e. that large changes in position angle are occurring on scales smaller than the resolution element. This could be a result of differential Faraday rotation in the ISM, or may correspond to intrinsic structure in the SNR’s magnetic field. The former possibility is certainly reasonable, given that it requires fluctuations in RM within a beam of only rad m-2, comparable to the variation in RM seen across the source. However, to determine conclusively which mechanism applies will require observations at higher frequencies, where effects caused by Faraday rotation are minimal.
Using the Galactic electron density distribution of Taylor & Cordes [1993], we compute an electron column density along the line of sight to the SNR of 260–330 pc cm-3. Assuming that Faraday rotation internal to the SNR makes only a small contribution to the total rotation measure, we compute an averaged line-of-sight interstellar magnetic field of G, directed towards us.
4.1.3 Morphology
The morphology of SNR G296.8–00.3 is not that seen in a typical shell SNR, and we suggest three possible explanations to account for its complicated and multi-shelled appearance. First, the SNR could be two separate objects. Second, it may have a double-ringed morphology corresponding to an underlying biannular symmetry in the progenitor system, as proposed by Manchester [1987]. Finally, G296.8–00.3 may owe its appearance to the surrounding ISM. We now consider these various possibilities.
Given that the lifetime of a supernova progenitor exceeds the observable lifetime of a SNR by 2–3 orders of magnitude, it is highly unlikely that we are seeing two SNRs from the same stellar assocation in temporal co-existence. It is possible that we are seeing two SNRs lying at different distances but along the same line of sight, but we think that this too is unlikely as it would require the centres of the only two SNRs in the field to virtually coincide. Further circumstantial evidence against G296.8–00.3’s being multiple SNRs is that H i absorption from the rim and the knot give consistent systemic velocities, and that the rotation measure is roughly uniform across the SNR. Thus the possibility of multiple SNRs cannot be ruled out by our data, but is unlikely.
It is now well-established that the slow wind from the red supergiant (RSG) phase of massive stars can possess axial symmetry (Blondin, Lundqvist & Chevalier 1996 and references therein). Manchester [1987] proposed that expansion of a SNR into such a medium can produce a biannular, or double-ringed morphology, similar to models proposed for planetary nebulae [1985, 1987]. Theory [1992, 1996] and observations [1997] both support the argument that this axisymmetric RSG wind can indeed affect the shape and morphology of a remnant expanding through it. Typical parameters for the RSG phase are a wind speed km s-1, a mass loss rate M☉ yr-1 and a life-time yr [1994]. This generates a potentially asymmetric medium around a supernova of radius 5 pc. Assuming such an environment for SNR G296.8–00.3, we find that the remnant, with a radius of 17 pc, has expanded well beyond this region and into the main-sequence wind of the progenitor. In the spherically symmetric case, this wind is predominantly hot, isobaric and consequently isotropic [1977], and we expect a SNR propagating through it to rapidly become spherical [1982]. For such a SNR to retain the brightness distribution induced in it by the RSG wind requires a mechanism by which shock acceleration preferentially occurs in the biannular emitting regions [1987]. A more likely explanation is the presence of asymmetry in the main sequence wind: for example, the effect of rotation in the progenitor can concentrate such a wind along the equatorial plane [1993, 1994]. To summarise, SNR G296.8–00.3 is well beyond the size at which biannular structure could be imprinted upon it by asymmetric mass loss in a RSG progenitor wind. If its appearance is caused by the structure of circumstellar material, then we require either the SNR to have somehow retained a biannular morphology while expanding into an isotropic medium, or the progenitor’s main-sequence wind to have possessed axial symmetry.
Manchester [1987] also suggests that a biannular SNR could be formed by the preferential distribution of ejecta along the polar axis. However, evidence suggests that asymmetric ejecta do not produce an unusually shaped remnant [1982, 1996, 1997].
A further means of producing biannular structure is through jets from a central pulsar or binary system, which then hit the surface of the expanding remnant [1987]. Our radio observations of SNR G296.8–00.3 show no evidence for a centrally located point source either in total or polarized intensity, nor for outflows from such a source. The X–ray observations also show no central emitting region which might correspond to a central star or nebula. Apart from J1157–6224, no pulsar has been detected in or near this remnant [1985, 1996]. We conclude that there is no evidence for a central source or related outflows in SNR G296.8–00.3.
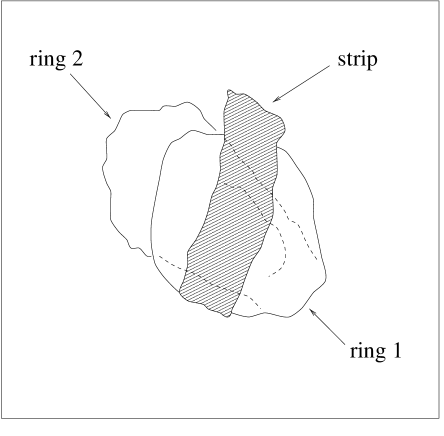
We now consider the possibility that the SNR is interacting with the ambient medium. In order to propose a simple model of the SNR’s appearance, we denote the main features in the SNR as follows, illustrated schematically in cartoon form in Fig 8:
-
1.
a bright, sharp-edged, and almost complete ring of emission in the south-west (‘ring 1’). In the absence of other structure, this component would appear as a typical shell SNR;
-
2.
a rectangular strip of emisssion running north-south through the centre of the SNR. This strip is not a typical SNR feature – it is almost linear, is uniform in brightness over its extent, with projected dimensions of pc north-south and pc east-west (at a distance of 10 kpc);
-
3.
a faint, ragged partial ring (‘ring 2’), extending beyond ring 1 to the north-east and possibly connecting with filaments in the south.
Ring 1 seems compatible with a SNR expanding into a homogeneous medium. We suggest that the strip corresponds to a tunnel or tube of significantly lower density. This is of appropriate dimensions to be an old SNR or stellar-wind bubble, its elongated appearance caused by tension in external [1992, 1998] or internal [1974, 1989] magnetic field lines. On encountering such a region, an expanding shock will re-energise it, rapidly propagating both across the tube and up and down its length. As it does so, electrons in the walls are shock-accelerated and emit synchrotron radiation [1987], giving a filled, linear structure as observed here.
Ring 2 is fainter than ring 1, extends beyond the latter’s boundary, and has a more poorly defined outer edge. This suggests that it represents a region of break-out into an adjacent cavity, perhaps created by another massive star. In such a case the shock will rapidly expand to take on the dimensions of the region, creating the multiple shell appearance observed [1986]
It has been argued that the morphologies of SNRs G166.0+04.3 (VRO 42.05.01) and G350.0–02.0 both result from a supernova shock re-energising a tube or tunnel and then propagating on to the other side to form a second shell [1987, 1998]. In both these SNRs, the three components are all approximately in the plane of the sky. We suggest that SNR G296.8–00.3 may represent a similar situation, but in this case where the explosion site, the low-density tunnel and the second shell all lie roughly along the line of sight.
4.2 PSR J1157–6224
4.2.1 Physical Properties
The similarity in the rotation measures of the SNR and the pulsar suggests that they are at roughly the same distance. The poor signal-to-noise in the absorption spectrum shown in Fig 6 suggests that while the Johnston et al. [1996] lower limit on the kinematic distance of 4 kpc (inferred from absorption out to the tangent point) is valid, their upper limit of 9 kpc, based on lack of absorption at positive velocities, can be questioned. Indeed an early H i absorption spectrum towards the pulsar suggested absorption out to +30 km s-1 [1976]. Putting the pulsar at a similar distance to the SNR gives agreement with the dispersion measure distance derived from the model of Taylor & Cordes [1993]. Thus we propose a distance for the pulsar of 10 kpc.
4.2.2 Polarization
A Stokes V image of the entire field is shown in Fig 9. Because the ATCA has linear feeds, the instrumental response in Stokes V is negligible. Apart from the pulsar, the image is devoid of emission, with a noise (40 Jy beam-1) commensurate with that expected from the radiometer equation alone.
The signal-to-noise of the pulsar in Stokes V (30 ) is comparable to that in total intensity, yet the circularly polarized signal-to-noise of all other sources in the field is zero. Indeed pulsars are generally 10 per cent circularly polarized (e.g. Qiao et al. 1995), while other sources tend not to emit in circular polarization. We therefore suggest that examination of Stokes V images may be a fruitful method of finding new pulsars, particularly those which are too weak, too dispersed, too scattered or have a period too short or too long to be found by traditional searches for pulsed emission.
4.3 Other Sources
Absorption against source 2 (Fig 7) is not seen at +50 km s-1, where emission is seen in Fig 6. However, at this distance absorbing clouds are of small angular scale and may not lie along this line of sight. This source has no counterpart in IRAS 60-m emission, which, combined with its intermediate spectral index and low linear and circular polarization, is consistent with its being a background radio galaxy. Source 4’s H i absorption suggests that it too is extragalactic, consistent, as for source 2, with its spectral, infrared and polarization properties. While no absorption was obtainable against source 3, the available evidence is also consistent with an extragalactic origin.
4.4 An association between SNR G296.8–00.3 and PSR J1157–6224?
An association between SNR G296.8–00.3 and PSR J1157–6224 was originally proposed by Large & Vaughan [1972], primarily based on the spatial coincidence of the two objects. This association has subsequently been regarded as unlikely on the basis of the pulsar’s large timing age yr [1995c, 1996], clearly incompatible with the age for the SNR derived above. However, the timing age of a pulsar is only an upper limit on the true age, since it assumes that the initial period of the pulsar was much smaller than the present value. If a pulsar is born spinning slowly [1981, 1989, 1990], it can be much younger than . Given the evidence presented above that the distances of the SNR and the pulsar are compatible, we now reconsider the likelihood of an association.
If the pulsar is as young as yr, its position well outside the remnant argues strongly against a physical association. The pulsar is removed from the remnant’s centre by approximately double the SNR radius. Such a large displacement is statistically improbable for an association of this age [1995a]. The implied projected velocity is km s-1, a speed similar to that claimed by Caraveo [1993] in order to associate PSR J1614–5047 with G332.4+00.1, but well in excess of typical pulsar velocities [1994, 1994]. We note, however, that the implied proper motion of 80 mas yr-1 cannot be ruled out; comparison of timing positions derived by Newton, Manchester & Cooke [1981] and Siegmen et al. [1993] gives an upper limit on the proper motion of 150 mas yr-1.
An alternative is that the remnant is much older than the age calculated above. If we suppose that the remnant has an age of yr, then the pulsar’s inferred projected velocity ( km s-1) becomes quite reasonable, as does its position [1995b]. However, this requires that , an usually high value (cf. Frail et al. 1994). The high pulsar velocity and ambient density required for an association would be expected to generate a wind nebula or bow shock trailing out behind the pulsar (e.g. Frail & Scharringhausen 1997). No such structure is visible around the pulsar in our radio image, and comparison of the integrated flux density (Table 4) with the pulsed flux [1996] puts an upper limit on emission from any unresolved nebula of mJy. Furthermore, the pulsar would still have to be born spinning slowly: for a braking index [1977], yr requires an initial period ms (compared with a current period of 400 ms).
Thus, we conclude that, apart from an agreement in distance, there is no evidence in favour of a physical relationship between SNR G296.8–00.3 and PSR J1157–6224. Most likely their spatial proximity is by chance and the pulsar is a much older object.
5 Conclusion
We have presented 1.3-GHz continuum and H i observations of SNR G296.8–00.3. These data (resolution 20 arcsec) represent the highest resolution at which this SNR has been observed. The remnant is weakly polarized at a lower limit of 0.5 per cent. We attribute this to beam depolarization, possibly a result of differential Faraday rotation in the ISM. The ATCA’s capacity to measure many channels across the continuum band allows a measurement to be made of the change in polarization position angle as a function of frequency. We consequently derive a rotation measure towards the SNR of rad m-2. This disagrees with the earlier results of Dickel & Milne [1976], and we argue that these authors incorrectly accounted for an ambiguity in the rotation.
H i absorption towards the SNR gives lower and upper limits on its systemic velocity of +15 and +30 km s-1 respectively, corresponding to a distance pc. We consequently estimate an age for the remnant of yr, and a mean interstellar magnetic field along the line of sight of G.
SNR G296.8–00.3 seems consistent with its being the remnant of a single explosion. Two explanations for its morphology seem possible. One is that the remnant has a biannular appearance induced by axial symmetry in the progenitor wind. However, the SNR is much larger than the RSG wind of a SN progenitor, and it must either be able to ‘remember’ its environment from an earlier stage of evolution, or be propagating through a main-sequence wind which is also axisymmetric. The other possibility is that the SNR’s complex appearance results from the inhomogeneous ISM into which it is expanding. In this context, an unusual linear feature running north-south through the remnant may represent a low-density tunnel which has been re-energised by encounter with the SN shock, while a partial ring of emission to the north-east may indicate a break-out into an adjacent bubble. A detailed H i emission study of the region, using a combination of compact ATCA configurations and single-dish data, may give further insight into the remnant and its environment.
We also detect the pulsar PSR J1157–6224, 13 arcmin from the remnant’s centre, and find its measured properties to agree with those found in previous observations. On the basis of its H i absorption, rotation measure and dispersion measure, we argue that the pulsar is at a distance of 10 kpc, compatible with the distance to the SNR. However, the pulsar’s large timing age and large displacement from the remnant’s centre make a physical association highly unlikely.
The pulsar is 12 per cent circularly polarized and its detection through such emission is straightforward. Other sources in the field show no circular polarization and the nature of the ATCA means that instrumental effects in Stokes V are minimal. This suggests that detection through Stokes V is a useful method for finding new pulsars.
Acknowledgments
We thank Jim Caswell, John Dickey, Vince McIntyre and Brad Wallace for helpful discussions, and Bärbel Koribalski for supplying H i data on PSR J1157–6224. Bob Sault, Richard Gooch and Neil Killeen assisted with data reduction. BMG acknowledges the support of an Australian Postgraduate Award. The Australia Telescope is funded by the Commonwealth of Australia for operation as a National Facility managed by CSIRO. This research has made use of the NASA Astrophysics Data System and the CDS SIMBAD database.
References
- [1976] Ables J. G., Manchester R. N., 1976, AA, 50, 177
- [1989] Arendt R. G., 1989, ApJS, 70, 181
- [1987] Balick B., 1987, AJ, 94, 671
- [1984] Belfort P., Crovisier J., 1984, AA, 136, 368
- [1982] Bisnovatyi-Kogan G. S., Blinnikov S. I., 1982, SvA, 26, 530
- [1993] Bjorkman J. E., Cassinelli J. P., 1993, ApJ, 409, 429
- [1996] Blondin J. M., Lundqvist P., Chevalier R. A., 1996, ApJ, 472, 257
- [1986] Braun R., Strom R. G., 1986, AA, 164, 193
- [1988] Burton W. B., 1988, in Verschuur G. L., Kellerman K., eds, Galactic and Extragalactic Radio Astronomy, 2nd ed. Springer-Verlag, New York, p. 295
- [1993] Caraveo P. A., 1993, ApJ, 415, L111
- [1983] Caswell J. L., Barnes P. J., 1983, ApJ, 271, L55
- [1975] Caswell J. L., Clark D. H., Crawford D. F., 1975, Aust. J. Phys. Astr. Supp., 37, 39
- [1975] Caswell J. L., Murray J. D., Roger R. S., Cole D. J., Cooke D. J., 1975, AA, 45, 239
- [1989] Chevalier R. A., Liang E. P., 1989, ApJ, 344, 332
- [1980] Clark B. G., 1980, AA, 89, 377
- [1974] Cox D. P., Smith B. W., 1974, ApJ, 189, L105
- [1976] Dickel J. R., Milne D. K., 1976, Aust. J. Phys., 29, 435
- [1997] Dickey J. M., 1997, ApJ, 488, 258
- [1989] Emmering R. T., Chevalier R. A., 1989, ApJ, 345, 931
- [1989] Fich M., Blitz L., Stark A. A., 1989, ApJ, 342, 272
- [1997] Frail D. A., Scharringhausen B. R., 1997, ApJ, 480, 364
- [1990] Frail D. A., Weisberg J. M., 1990, AJ, 100, 743
- [1994] Frail D. A., Goss W. M., Whiteoak J. B. Z., 1994, ApJ, 437, 781
- [1992] Frater R. H., Brooks J. W., Whiteoak J. B., 1992, J. Electr. Electron. Eng. Aust., 12, 103
- [1995a] Gaensler B. M., Johnston S., 1995a, Publ. Astron. Soc. Aust., 12, 76
- [1995b] Gaensler B. M., Johnston S., 1995b, MNRAS, 275, L73
- [1995c] Gaensler B. M., Johnston S., 1995c, MNRAS, 277, 1243
- [1998] Gaensler B. M., 1998, ApJ, 493, in press (1998 Feb 01) [http://xxx.lanl.gov/abs/astro-ph/9707149]
- [1997] Gaensler B. M., Manchester R. N., Staveley-Smith L., Tzioumis A. K., Reynolds J. E., Kesteven M. J., 1997, ApJ, 479, 845
- [1996] Gooch R., 1996, in Jacoby G. H., Barnes J., eds, Astronomical Data Analysis Software and Systems V. ASP Conference Series, Volume 101, San Francisco, p. 80
- [1972] Goss W. M., Radhakrishnan V., Brooks J. W., Murray J. D., 1972, ApJS, 24, 123
- [1984] Green D. A., 1984, MNRAS, 209, 449
- [1996] Green D. A., 1996, A Catalogue of Galactic Supernova Remnants (1996 August Version). Mullard Radio Astronomy Observatory, Cambridge, (http://www.mrao.cam.ac.uk/surveys/snrs/)
- [1978] Gull S. F., Daniell G. J., 1978, Nat, 272, 686
- [1968] Hill E. R., 1968, Aust. J. Phys., 21, 735
- [1994] Hwang U., Markert T. H., 1994, ApJ, 431, 819
- [1992] Igumenshchev I. V., Tutokov A. V., Shustov B. M., 1992, SvA, 36, 241
- [1996] Johnston S., Koribalski B. S., Weisberg J., Wilson W., 1996, MNRAS, 279, 661
- [1985] Kahn F. D., West K. A., 1985, MNRAS, 212, 837
- [1996] Kaspi V. M., Manchester R. N., Johnston S., Lyne A. G., D’Amico N., 1996, AJ, 111, 2028
- [1986] Kerr F. J., Lynden-Bell D., 1986, MNRAS, 221, 1023
- [1986] Kerr F. J., Bowers P. F., Jackson P. D., Kerr M., 1986, A&AS, 66, 373
- [1986] Killeen N. E. B., Bicknell G. V., Ekers R. D., 1986, ApJ, 302, 306
- [1989] Landecker T. L., Pineault S., Routledge D., Vaneldik J. F., 1989, MNRAS, 237, 277
- [1972] Large M. I., Vaughan A. E., 1972, Nature Phys. Sci., 236, 117
- [1969] Large M. I., Vaughan A. E., Wielebinski R., 1969, Astrophys. Lett., 3, 123
- [1994] Lyne A. G., Lorimer D. R., 1994, Nat, 369, 127
- [1995] Malhotra S., 1995, ApJ, 448, 138
- [1977] Manchester R. N., Taylor J. H., 1977, Pulsars. Freeman, San Francisco
- [1987] Manchester R. N., 1987, AA, 171, 205
- [1985] Manchester R. N., D’Amico N., Tuohy I. R., 1985, MNRAS, 212, 975
- [1980] Manchester R. N., Hamilton P. A., McCulloch P. M., 1980, MNRAS, 192, 153
- [1978] McCulloch P. M., Hamilton P. A., Manchester R. N., Ables J. G., 1978, MNRAS, 183, 645
- [1990] Narayan R., Ostriker J. P., 1990, ApJ, 352, 222
- [1981] Newton L. M., Manchester R. N., Cooke D. J., 1981, MNRAS, 194, 841
- [1994] Owocki S. P., Cranmer S. R., Blondin J. M., 1994, ApJ, 424, 887
- [1987] Pineault S., Landecker T. L., Routledge D., 1987, ApJ, 315, 580
- [1995] Qiao G. J., Manchester R. N., Lyne A. G., Gould D. M., 1995, MNRAS, 274, 572
- [1994] Reynolds J. E., 1994, ATNF Technical Document Series, 39.3040
- [1991] Robertson J. G., 1991, Aust. J. Phys., 44, 729
- [1992] Saken J. M., Fesen R. A., Shull J. M., 1992, ApJS, 81, 715
- [1997] Sault R. J., Killeen N. E. B., 1997, The Miriad User’s Guide. Australia Telescope National Facility, Sydney, (http://www.atnf.csiro.au/Software/Analysis/miriad/)
- [1994] Sault R. J., Wieringa M. H., 1994, A&AS, 108, 585
- [1994] Sault R. J., 1994, A&AS, 108, 55
- [1995] Sault R. J., Teuben P. J., Wright M. C. H., 1995, in Shaw R., Payne H., Hayes J., eds, Astronomical Data Analysis Software and Systems IV. ASP Conference Series, Volume 77, San Francisco, p. 433
- [1982] Shaver P. A., Radhakrishnan V., Anantharamaiah K. R., Retallack D. S., Wamsteker W., Danks A. C., 1982, AA, 106, 105
- [1993] Siegman B. C., Manchester R. N., Durdin J. M., 1993, MNRAS, 262, 449
- [1994] Smith L. J., 1994, in Clegg R. E. S., Meikle W. P. S., Stevens I. R., eds, Circumstellar Media in the Late Stages of Stellar Evolution. Cambridge University Press, p. 64
- [1992] Stone J. M., Norman M. L., 1992, ApJ, 389, 297
- [1993] Taylor J. H., Cordes J. M., 1993, ApJ, 411, 674
- [1993] Taylor J. H., Manchester R. N., Lyne A. G., 1993, ApJS, 88, 529
- [1990] Tenorio-Tagle G., Bodenheimer P., Franco J., Różyczka M., 1990, MNRAS, 244, 563
- [1969] Thomas B. M., Day G. A., 1969, Aust. J. Phys. Astr. Supp., 11, 3
- [1990] van Langevelde H. J., Cotton W. D., 1990, AA, 239, L5
- [1997] van Ommen T. D., D’Alesssandro F. D., Hamilton P. A., McCulloch P. M., 1997, MNRAS, 287, 307
- [1981] Vivekanand M., Narayan R., 1981, JA&A, 2, 315
- [1977] Weaver R., McCray R., Castor J., Shapiro P., Moore R., 1977, ApJ, 218, 377
- [1996] Whiteoak J. B. Z., Green A. J., 1996, A&AS, 118, 329