Radio study of X-ray clusters of galaxies I:
A3528 — a pre-merging cluster in the core
of the Shapley Supercluster
Abstract
As part of an extensive radio–IR–optical–X-ray study of ROSAT clusters of galaxies in the Hydra region we have observed the bimodal Abell cluster A3528, located in the core of the Shapley Supercluster (), with the Molonglo Observatory Synthesis Telescope at 843 MHz and the Australia Telescope Compact Array at 1.4 and 2.4 GHz. This is part I in a series of papers which look at the relationship between the radio and X-ray emission in samples of ROSAT selected clusters.
The radio source characteristics — tailed morphologies and steep spectra — are consistent with the effects of a dense intra-cluster medium and the pre-merging environment of A3528. In particular, we present evidence that the minor member of the radio loud dumbbell galaxy located at the centre of the northern component of A3528 is on a plunging orbit. We speculate that this orbit may have been induced by the tidal interactions between the merging components of A3528. In addition, the radio source associated with the dominant member of the dumbbell galaxy exhibits many of the characteristics of Compact Steep Spectrum sources. We argue that the radio emission from this source was triggered yr ago by tidal interactions between the two members of the dumbbell galaxy, strengthening the argument that CSS sources are young.
Re-analysis of archive pointed PSPC data using multi-resolution filtering suggests the presence of an AGN and/or a cooling flow in the southern component of A3528.
keywords:
galaxies: clustering – galaxies: clusters: individual: A3528 – galaxies: active – galaxies: interactions – cosmology: observations – large-scale structure of the Universe – radio continuum: galaxies – X-rays: general1 Introduction
The ACO (Abell, Corwin & Olowin 1989) cluster A3528 (Klemola 21) is located in the core of the richest and most dynamically active region in the nearby universe, the Shapley Supercluster (Shapley 1930; Zucca et al. 1993; Einasto et al. 1994; Quintana et al. 1995). This region may be a significant contributor to the peculiar motion of the local group with respect to the cosmic microwave background (Scaramella et al. 1989; Raychaudhury 1989); it also contains the highest known fraction of bimodal X-ray clusters (Lahav et al. 1989; Einasto et al. 1994). A3528 is bimodal (separation 1.2 Mpc; Raychaudhury et al. 1991) with components to the north and south, hereafter referred to as A3528N and A3528S, designated as RXJ 12 54.4 29 01 and RXJ 12 54.6 29 13 in the ROSAT All Sky Survey (RASS). The cluster parameters are given in Table 1.
| Parameter | Value | Ref. |
| CentreACO | RA(J2000)12 54.3 Dec(J2000)29 01 | 1 |
| AT | R | 1 |
| BM | II | 1 |
| R | 1 | 1 |
| D | 4 | 1 |
| 13.6: 14.6 15.9 | 1 | |
| C | 70 | 1 |
| km s-1 | 2 | |
| ( km s-1) | ||
| km s-1 | 2 | |
| ( km s-1) | ||
| MV | M☉ | 2 |
| ( M☉) | ||
| 3 |
CentreACO: optical cluster centre from ACO in J2000 equatorial coordinates (RA, Dec) and galactic coordinates (, ); AT: Abell Type; BM: Bautz-Morgan class; R: richness class; D: distance class; : weighted mean total magnitude estimate for the first, third and tenth ranked cluster members uncorrected for Galactic extinction; C: background-corrected count of cluster members in the magnitude range to ; : mean recession velocity; : velocity dispersion; and MV: virial mass, calculated from 30(39) galaxies within radius 2(3) Mpc from CentreACO; : characteristic Schechter (1976) magnitude. References: Abell, Corwin & Olowin 1989; Quintana et al. 1995; and Raychaudhury et al. 1991.
A3528, along with other clusters in the Shapley region, is included in a statistically complete, flux-limited sample of 42 ROSAT clusters located in a contiguous area covering deg2 in the Hydra region. These clusters have been the subject of an extensive study at radio–IR–optical–X-ray wavelengths (Pierre et al. 1994a). One of our objectives is to assess the extent to which bias may enter estimates of cluster masses and luminosity functions derived from X-ray surveys. This has important implications for studies of large scale structure formation in the universe.
X-ray selected samples of clusters, unlike optical, are not strongly affected by Galactic confusion or obscuration, and they are less susceptible to projection effects. However, they may still be biased in at least two potentially significant ways.
Firstly, the diffuse thermal bremsstrahlung emission from the hot intra-cluster medium (ICM) may be contaminated by X-ray emission from individual galaxies (Worrall & Birkinshaw 1994; Brinkmann & Siebert 1994; Worrall et al. 1994; Worrall, Birkinshaw & Cameron 1995; Feretti et al. 1995; Edge & Röttgering 1995). This may take the form of an integrated contribution from discrete galactic sources such as X-ray binaries, a very young stellar population, SNe and SNRs, super-Eddington sources and stellar coronal emission. These sources provide a mixture of thermal, black-body and power law emission. There may also be a diffuse thermal X-ray component in some E and S0 galaxies; however, it is unclear if such halos exist in clusters and in any case the contribution is likely to be less than L erg s-1. Pointlike non-thermal (synchrotron) emission from active galactic nuclei (AGN) (or possibly inverse Compton X-ray emission from the interaction of relativistic electrons with cosmic microwave background photons) can cover a huge range of X-ray luminosities, however, and may dominate the cluster emission. This hypothesis can be investigated in individual cases through the shape and spectrum of the X-ray emission provided the resolution is adequate. Another method is to use sensitive radio observations to identify the presence of an AGN component. Preliminary work using the Molonglo Observatory Synthesis Telescope and RASS data (Pierre, Hunstead & Unewisse 1994b) shows a high rate of X-ray–radio coincidences at which appear to fall into two distinct classes:
-
1.
bright, generally unresolved X-ray sources, centred on the cD galaxy which is itself a luminous radio source, and
-
2.
clusters having an extended and irregular X-ray morphology, with weak radio emission from the cD.
Case (i) probably corresponds to significant AGN contribution to the X-ray flux, but higher resolution X-ray images are required to be conclusive.
A second source of bias may occur when the assumptions inherent in the calculation of the total cluster potential from the X-ray emission are violated. For instance, in the case of a -model fit to the extended emission (King, 1962; Cavaliere & Fusco-Femiano 1976, 1981; Jones & Forman 1984) it is assumed that the gas is isothermal and in hydrostatic equilibrium, which may not be the case if:
-
1.
the cluster is in the process of merging, with resultant shock heating of the ICM, or
-
2.
there are local potential wells harbouring gas at different temperatures, eg. merging subclusters.
Both cases are linked intimately to the dynamical evolution of clusters. Substructure in the X-ray brightness distribution, and in the spatial and velocity distributions of galaxies, are signatures of clusters which are not virialised and are undergoing mergers. The existence of various types of extended and distorted radio sources in X-ray luminous clusters, notably the so-called tailed sources, is also strongly correlated with dynamic activity in clusters (eg. A2256, Röttgering et al. 1994). This is because their special characteristics (spectra and morphology) are believed to be the result of strong interaction with the cluster environment.
Radio observations therefore hold promise as a means of revealing clusters for which the gravitational potential based on X-ray data may be affected by AGN contamination or non-hydrostatic/non-isothermal conditions. Ultimately, it is hoped that our statistically complete sample of clusters, which is chosen independently of their radio properties, will clarify the relationship between cluster X-ray and radio emission.
The X-ray–optical analysis of the 40 brightest clusters in our sample has been completed (Pierre et al. 1994c) and the Shapley region in particular has been studied extensively at optical and X-ray wavelengths (Vettolani et al. 1990; Day et al. 1991; Fabian 1991; Raychaudhury et al. 1991; Nobuyoshi & Suto 1993; Bardelli et al. 1994; Metcalfe, Godwin & Peach 1994; Quintana et al. 1995). The southerly declinations () of 27 of the clusters from this sample, including A3528, are well suited to radio observations with the Molonglo Observatory Synthesis Telescope (MOST: Mills 1981; Robertson 1991) and the Australia Telescope Compact Array (ATCA; Frater & Brooks 1992).
Schindler (1996) undertook an optical–X-ray–radio analysis of A3528 using the VLA and a pointed ROSAT PSPC (Trumper 1992) observation that happened to include A3528. From the X-ray analysis it was concluded that A3528N and A3528S are probably in the early stages of merging. However, due to the limited resolution of the VLA observations and off-axis PSPC observation, it was not possible to relate the X-ray and radio emission in much detail. At higher resolution with the ATCA, we identify new structure in the radio sources projected within the diffuse X-ray emission. These new data are combined with a re-analysis of the PSPC image to build a more comprehensive multi-wavelength picture relating the radio emission in A3528 to the pre-merging cluster environment.
We describe the radio observations and data reduction in section 2. In section 3 we present our radio source lists and images, discuss morphologies of the detected sources, and compare them with previous observations.
In section 4 we discuss and relate the optical, X-ray and radio characteristics of A3528. We look at the spatial and velocity distribution of the luminous mass and make radio-optical identifications. A re-analysis of the X-ray data allows us to identify possible excess emission from A3528S. We then discuss the radio sources in A3528, differentiating between those associated with brightest cluster members (BCMs) and non-BCMs, and explore their relationship with the pre-merging cluster environment of A3528. Our conclusions are summarized in section 5.
Throughout the paper we assume km s-1 Mpc-1 and ; at the distance of A3528, corresponds to kpc.
2 Observations and Data Reduction
2.1 Observations
The field of A3528 was observed with the MOST at 843 MHz and the ATCA at 1.4 and 2.4 GHz. Details of the observations are summarized in Table 2.
| (1) | (2) | (3) | (4) | (5) | (6) | (7) | (8) | (9) | |
|---|---|---|---|---|---|---|---|---|---|
| Tel. | Obs. Date | BW | RA Dec. | T | Peak | Restoring beam | |||
| (GHz) | (MHz) | (J2000) | (hr) | (Jy/bm) | (mJy/bm) | () | (°) | ||
| MOST | 1993 Mar 19 | 0.843 | 3 | 12 54 18.1 29 01 16 | 12 | 1.66 | 2.3 | 88.7 43.0 | 0.00 |
| ATCA | 1994 Mar 15 | 1.380 | 128 | 12 54 23.8 29 01 20 | 2 | 0.289 | 0.56 | 11.8 6.2 | 0.31 |
| ATCA | 1994 Mar 15 | 2.378 | 128 | 12 54 23.8 29 01 20 | 2 | 0.050 | 0.39 | 6.2 4.2 | 0.15 |
(1) telescope; (2) date of observation; (3) central observing frequency; (4) bandwidth; (5) field centre equatorial coordinates; (6) integration time; (7) peak flux density per beam (8) rms noise per beam; (9) beam parameters: major axis FWHM minor axis FWHM, major axis position angle.
The MOST field of view was an ellipse of size . We subsequently restricted our study to the inscribed square region of approximately uniform signal-to-noise ratio.
Follow-up observations with the ATCA at 1.4 and 2.4 GHz used the 6C array configuration (interferometer spacings 153 m–6 km) in ‘snapshot’ mode (Burgess & Hunstead 1995), time-shared with five other targets in a 1-hour cycle. Total on-source integration time was 2 hours. Two orthogonal linear polarizations were recorded. The observations were centred on A3528N so primary beam attenuation has lowered the sensitivity for A3528S, especially at 2.4 GHz where the primary beam is FWHM. The primary ATCA flux density calibrator, PKS B1934638, was observed at the start of the run and the secondary gain and phase calibrator B1320446 was observed every 30 mins.
We chose a correlator configuration with MHz channels, corresponding to a total bandwidth of 128 MHz. Such a wide BW allows us to improve uv-coverage through multi-frequency synthesis, although the coverage, especially at the shorter baselines, is still poor and extended emission on scales at 1.4 GHz will not be well recorded.
2.2 Data reduction
The MOST data were reduced using custom software (Cram & Ye 1995). The ATCA snapshot observations were reduced predominantly in aips using the techniques of Burgess & Hunstead (1995). However, miriad (Sault, Teuben & Wright 1995) was used specifically to calibrate the visibility data because of the special polarization characteristics of the ATCA.
The images from both the MOST and the ATCA were analysed using aips. All images were first corrected for primary beam response. Source lists were then generated for each radio image. Elliptical gaussians were fitted, as described by Condon (1997), to all unresolved and slightly resolved (less than two beamwidths in size) sources in the radio images. The task VSAD (W. Cotton, priv comm), written for the NRAO VLA Sky Survey (NVSS), was used to give source positions and peak and integrated flux densities. Parameter errors were calculated using formulae similar to those used for the NVSS (Condon et al. 1996).
In cases where the emission was well resolved we used instead the task TVSTAT to sum inside an irregular polygon, tightly defined around the source, and obtain the integrated flux density. An estimate of the background was made from a second measurement using a larger concentric polygon but excluding any other sources. In these cases the largest angular size and position angle were measured directly from the image. The position corresponds to the location of the peak in the emission. There was no obvious way of accurately and objectively estimating the errors in these parameters and so none are given.
Source lists at each frequency were then correlated. As the field of view at each frequency is different we do not provide a catalogued entry at some frequencies. For every catalogued source the quoted position is measured from the highest frequency image in which the source was detected, taking morphology into account.
Spectral indices (where and is the integrated flux density at frequency ) were calculated for sources detected at two or more frequencies. It is important to note, however, that no attempt was made to match the uv coverage of the observations and, therefore, values for extended sources should only be regarded as indicative.
3 Radio Results
Table 3 lists all the detected radio sources with peak flux densities down to ; non-detections were assigned a 5 upper limit. Table 4 lists parameters for all of the sources which could be deconvolved and/or identified with cluster galaxies (See Sec. 4.1.2). As the cluster radio sources are at known distances this allows us to derive physical quantities such as the integrated spectral power. The largest projected linear size was also determined for those cluster sources that could be deconvolved.
| (1) | (2) | (3) | (4) | (5) | (6) | (7) | (8) | (9) | (10) | (11) | (12) | (13) | (14) |
| RA | RA | Dec | Dec | ||||||||||
| (h m s) | (s) | (° ′ ″) | () | (′) | (Mpc) | (′) | (Mpc) | (GHz) | (mJy/bm) | (mJy) | |||
| 1 | 12 51 59.13 | 0.11 | 28 35 45.1 | 1.5 | 40.7 | 3.47 | 51.8 | 4.41 | 0.8 | 60(3) | 75(3) | ||
| 2 | 12 52 04.69 | 0.03 | 29 28 15.7 | 0.4 | 40.6 | 3.46 | 37.0 | 3.15 | 0.8 | 268(9) | 307(9) | ||
| 3 | 12 52 06.52 | 0.09 | 29 21 05 | 9 | 36.0 | 3.06 | 34.4 | 2.93 | 0.8 | 20(2) | 20(2) | ||
| 4 | 12 52 11.5 | 0.2 | 29 16 32 | 3 | 32.7 | 2.79 | 32.7 | 2.78 | 0.8 | 23(2) | 23(2) | ||
| 5 | 12 52 17.95 | 0.14 | 28 53 21 | 3 | 28.7 | 2.44 | 37.2 | 3.17 | 0.8 | 37(2) | 42(2) | ||
| 6 | 12 52 33.43 | 0.03 | 29 08 07.2 | 0.6 | 25.1 | 2.14 | 28.3 | 2.41 | 0.8 | 177(6) | 186(6) | ||
| 7 | 12 52 48.27 | 0.11 | 29 17 04 | 7 | 26.2 | 2.23 | 24.7 | 2.11 | 0.8 | 17.5(1.5) | 17.5(1.5) | ||
| 8 | 12 52 56.8 | 0.2 | 29 28 08 | 7 | 32.9 | 2.80 | 26.9 | 2.29 | 0.8 | 19(2) | 19(2) | ||
| 9 | 12 53 05.5 | 0.4 | 29 02 52 | 6 | 17.2 | 1.47 | 23.4 | 1.99 | 0.8 | 16(2) | 16(2) | ||
| 1.4 | 5 | 5 | |||||||||||
| 10 | 12 53 10.68 | 0.03 | 28 53 28.9 | 0.5 | 17.8 | 1.52 | 28.1 | 2.40 | 1.6 | 0.8 | 59(3) | 65(3) | |
| 1.4 | 2 | 21.1(1.2) | 30(3) | ||||||||||
| 11 | 12 53 18.11 | 0.04 | 28 50 23 | 2 | 18.1 | 1.54 | 29.4 | 2.51 | 0.8 | 12 | 12 | ||
| 1.4 | 4.1(0.7) | 4.1(0.7) | |||||||||||
| 12 | 12 53 19.53 | 0.02 | 28 59 54.5 | 0.3 | 14.1 | 1.20 | 22.4 | 1.91 | 1.2 | 0.8 | 104(4) | 116(4) | |
| 1.4 | 60(2) | 65(2) | |||||||||||
| 13 | 12 53 28.71 | 0.13 | 29 21 22 | 2 | 23.4 | 1.99 | 17.5 | 1.49 | 0.8 | 44(2) | 50(2) | ||
| 14 | 12 54 01.73 | 0.03 | 28 58 15.3 | 1.1 | 5.7 | 0.49 | 17.6 | 1.50 | 0.8 | 12 | 12 | ||
| 1.4 | 3.7(0.4) | 3.7(0.4) | |||||||||||
| 15 | 12 54 02.91 | 0.05 | 29 27 23.4 | 1.1 | 26.5 | 2.25 | 16.0 | 1.36 | 0.8 | 99(4) | 109(4) | ||
| (B)16 | 12 54 20.88 | 29 04 22.7 | 3.1 | 0.27 | 10.2 | 0.87 | 1.0 | 0.8 | 1 | 360 | 519 | ||
| 1.4 | 1 | 28 | 240 | ||||||||||
| 2.4 | 1 | 12 | 188 | ||||||||||
| (A1)17 | 12 54 22.25 | 29 00 45.7 | 0.7 | 0.06 | 13.5 | 1.15 | 0.7 | 0.8 | 3 | 530(30) | 590(30) | ||
| 1.4 | 1 | 104 | 211 | ||||||||||
| 2.4 | 1 | 49 | 143 | ||||||||||
| (A2)18 | 12 54 23.01 | 29 01 02.7 | 0.3 | 0.03 | 13.2 | 1.12 | 0.7 | 0.8 | 3 | 530(30) | 590(30) | ||
| 1.4 | 1 | 34 | 97 | ||||||||||
| 2.4 | 1 | 18 | 65 | ||||||||||
| (E)19 | 12 54 40.6 | 0.2 | 29 01 44 | 4 | 3.7 | 0.31 | 11.9 | 1.02 | 0.8 | 21(2) | 21(2) | ||
| 1.4 | 3 | 3 | |||||||||||
| 2.4 | 2 | 2 | |||||||||||
| (C)20 | 12 54 41.04 | 29 13 41.0 | 12.9 | 1.10 | 0.1 | 0.01 | 1.1 | 0.8 | 1620(50) | 1970(50) | |||
| 1.4 | 1 | 281 | 848 | ||||||||||
| 2.4 | 1 | 46 | 477 | ||||||||||
| (D)21 | 12 54 52.47 | 29 16 19.0 | 16.2 | 1.38 | 3.7 | 0.32 | 0.8 | 106(4) | 124(4) | ||||
| 22 | 12 55 14.2 | 0.4 | 29 08 29 | 9 | 13.1 | 1.12 | 9.0 | 0.76 | 0.8 | 12(2) | 12(2) | ||
| 1.4 | 4 | 4 | |||||||||||
| 23 | 12 55 20.9 | 0.7 | 29 19 50 | 10 | 22.3 | 1.90 | 10.7 | 0.91 | 0.8 | 12(3) | 12(3) | ||
| 24 | 12 55 35.37 | 0.13 | 29 23 44 | 6 | 27.3 | 2.33 | 15.6 | 1.33 | 0.8 | 22(2) | 22(2) | ||
| 25 | 12 55 37.81 | 0.03 | 28 55 58.9 | 0.4 | 17.0 | 1.45 | 21.6 | 1.84 | 2.0 | 0.8 | 56(2) | 57(2) | |
| 1.4 | 17.8(1.1) | 21.6(1.1) | |||||||||||
| 26 | 12 55 44.85 | 0.07 | 29 19 58 | 4 | 25.7 | 2.19 | 15.4 | 1.31 | 0.8 | 33(2) | 36(2) | ||
| 27 | 12 55 58.5 | 0.3 | 29 16 16 | 4 | 25.5 | 2.17 | 17.2 | 1.46 | 0.8 | 22(2) | 22(2) | ||
| 28 | 12 56 04.45 | 0.13 | 28 40 46 | 2 | 30.1 | 2.56 | 37.6 | 3.21 | 0.8 | 46(3) | 57(3) | ||
| 29 | 12 56 16.83 | 0.04 | 28 51 43.3 | 0.5 | 26.5 | 2.26 | 30.4 | 2.59 | 0.8 | 204(8) | 250(8) | ||
| 30 | 12 56 26.48 | 29 11 15.9 | 28.6 | 2.43 | 23.2 | 1.98 | 0.8 | 1 | 31 | 65 | |||
| 31 | 12 56 38.74 | 0.10 | 29 26 49 | 2 | 39.0 | 3.32 | 28.9 | 2.46 | 0.8 | 46(2) | 48(2) | ||
Notes to Table 3: Parameter errors for the sources fitted with elliptical gaussians (RA, Dec, and quantities in brackets) were based on formulae similar to those used for the NVSS (see text). A1 and A2 are blended at 0.8 GHz, so the numbers in columns 13 and 14 are repeated. D was too weak and too far down the primary beam for reliable measurements at 1.4 and 2.4 GHz. (1) catalogue ID in order of RA; (2–5) equatorial coordinates, epoch J2000; (6) & (7) projected offset from the centre of A3528N; (8) & (9) projected offset from the centre of A3528S; (10) spectral index defined by where S is the integrated flux density at frequency ; (11) observing frequency; (12) flag: TVSTAT used to calculate the peak and integrated flux, deconvolution possible (see table 4), sources blended; (13) peak radio flux density (per beam); (14) integrated radio flux.
| (1) | (2) | (3) | (4) | (5) | (6) |
|---|---|---|---|---|---|
| log | |||||
| (GHz) | (W Hz-1) | (″) | (kpc) | () | |
| (B)21 | 0.8 | 24.8 | 242 | 348 | 0.6 |
| 1.4 | 24.5 | 115 | 166 | 180 | |
| 2.4 | 24.4 | 88 | 126 | 171 | |
| (A) | 0.8 | 24.9 | 218 | 309 | 179 |
| (A1)22 | 1.4 | 24.4 | 33 | 47 | 20 |
| 2.4 | 24.3 | 21 | 30 | 33 | |
| (A2)23 | 1.4 | 23.9 | 40 | 57 | 53 |
| 2.4 | 23.9 | 39 | 56 | 67 | |
| (E)27 | 0.8 | 23.4 | |||
| 1.4 | 22.6 | ||||
| 2.4 | 22.4 | ||||
| (C)28 | 0.8 | 25.5 | |||
| 1.4 | 25.1 | 60 | 91 | 130 | |
| 2.4 | 24.8 | 55 | 83 | 115 | |
| (D)29 | 0.8 | 24.2 | |||
| 1.4 | 23.3 | 27 | 38 | 71 | |
| 2.4 | 23.4 | 19 | 28 | 125 | |
Notes to Table 4: Parameter errors for the sources fitted with elliptical gaussians (quantities in brackets) were based on formulae similar to those used for the NVSS (see text). A1 and A2 are blended at 0.8 GHz, so the numbers in columns 3–6 are repeated. D was too weak and too far down the primary beam for reliable measurements at 1.4 and 2.4 GHz. (1) catalogue ID from table 3; (2) observation frequency; (3) log10 of the integrated spectral power; (4) and (5) largest angular size and corresponding physical size; (6) projected position angle.
3.1 MOST
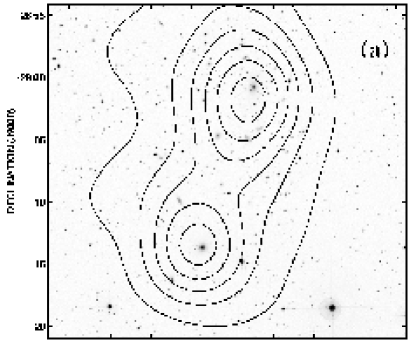
Fig. 1 shows MOST 0.843 GHz contours overlaid against a background of the DSS (NASA/STScI Digitized Sky Survey: B band, 1.7″ pixels; Morrison, 1995).
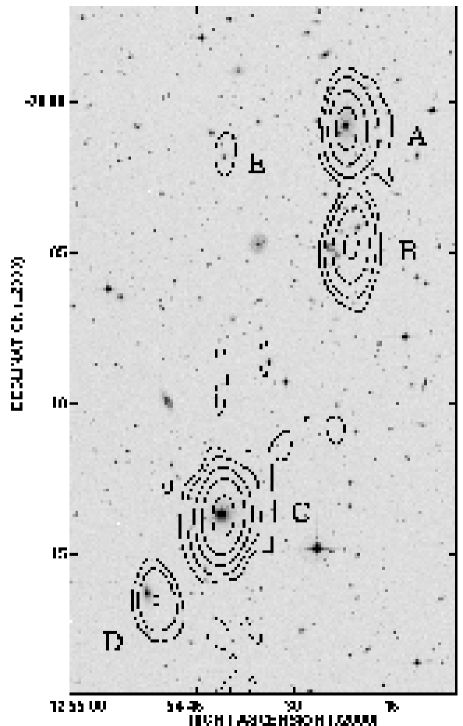
In A3528N there is a strong radio source A coincident with the BCM. MOST detects an additional source B of comparable strength to the south and a weak source E to the East. In A3528S we also find a strong radio source C coincident with the BCM and a second weaker source D to the south-east. Optical identifications will be discussed in detail later (see Sec. 4.1.2).
All except the weak source E are significantly resolved. A appears to be quite asymmetric, the emission being more extended towards the west, while C has a significant amount of diffuse emission.
3.2 ATCA
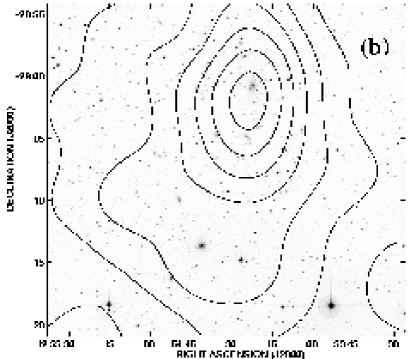
Figs. 2–5 show ATCA contours at 1.4 and 2.4 GHz for the extended radio sources detected within the projected boundary of X-ray emission, overlaid against a background of the DSS-II (R band, 1″pixels; Lasker 1994).
The ATCA observations give structural information on scales and allow us to assign morphological classifications. We find an exceptional number and variety of tailed sources. In particular, it is now clear that A is actually two separate sources, A1 and A2 in Fig. 2, each identified with one of the nuclei of this putative dumbbell galaxy. E was not detected at either 1.4 or 2.4 GHz while D was too weak and too far down the primary beam at 2.4 GHz to obtain a reliable image.
3.2.1 A1 Fig. (2)
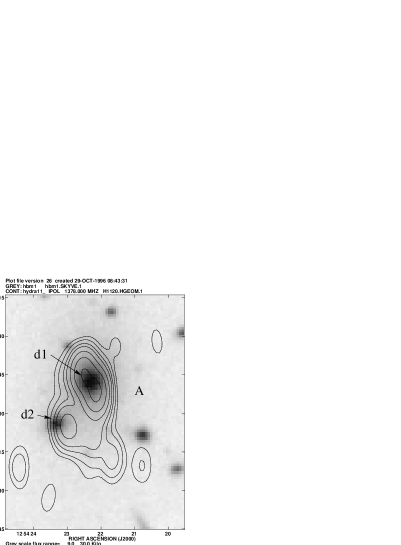
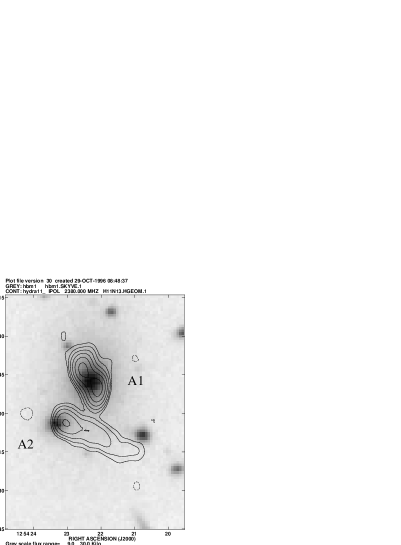
A1 is a symmetric double source but has a spectral power at 1.4 GHz which is below the FR I/II break (Fanaroff & Riley 1974) in rich clusters (Burns et al. 1994a). Its projected linear extent of kpc is well below the typical size (150–300 kpc) for an edge brightened double (Miley 1980).
3.2.2 A2 Fig. (2)
A2 has clear head-tail (HT) morphology in the 2.4 GHz image. Gaussian slice fits were made transverse to the ridge line of the tail at regular intervals. The tail is slightly resolved (transversely) at 2.4 GHz and the results are consistent (within the measurement errors) with a straight tail which is constant in width (8″ FWHM).
3.2.3 B Fig. (3)

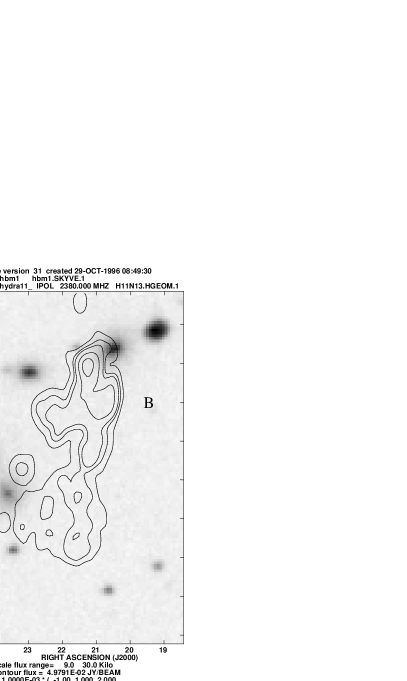
The morphology of B is reminiscent of the cm observation of the prototypical narrow-angled tailed (NAT) source 3C 83.1B/NGC 1265 in the Perseus cluster (O’Dea & Owen 1986). B also has a similar linear extent but appears to more asymmetric and lacks a clear core component. The differences may be due to a combination of projection effects and the poorer linear resolution of our observations.
3.2.4 C Fig. (4)

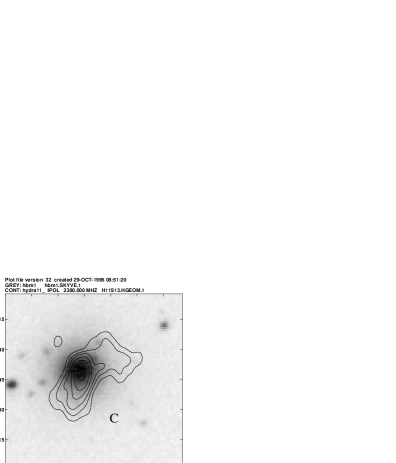
C is a classic example of an FR I (edge darkened) wide-angled tailed (WAT) source similar in the bending sequence to B (Jones & McAdam 1992). Its radio power is just below the FR I/FR II break which is typical of WATs (O’Donoghue et al. 1990). It has a relatively small extent ( 50 kpc) although the size is less well defined than A1.
3.2.5 D Fig. (5)
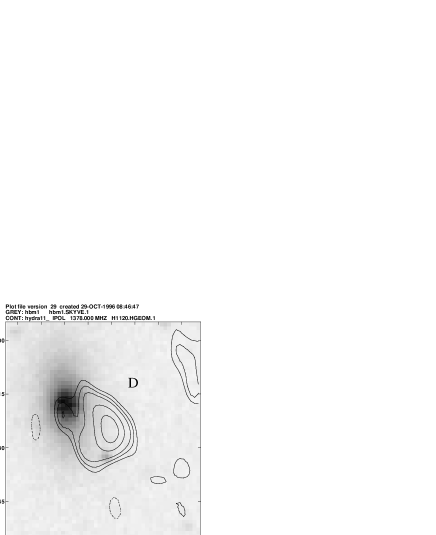
The morphology of D is not clear from the 1.4 GHz. We appear to resolve a core and stronger emission to the W. This unusual morphology may be due to the chance superposition of unrelated sources, but is more likely the result of missing extended flux. The 2.4 GHz image is not shown.
3.3 Comparison with previous radio observations
Previous radio observations of A3528 available in the literature are summarized in Table 5.
| (1) | (2) | (3) | (4) | (5) |
| N | Name | Ref. | ||
| (mJy) | (GHz) | |||
| 12 | PMN J12532859 | 2 | 77.6 | 4.85 |
| 14 | GdP94 1 | 5 | 0.5 | 5.0 |
| (B)16 | GdP94 2 | 5 | 69.7 | 5.0 |
| NVSS | 327 | 1.4 | ||
| Sch96 NR | 6 | 249 | 1.4 | |
| 850 | 0.327 | |||
| 16, 17 & 18 | PKS B1251287 | 3,2 | 300 | 2.7 |
| (A)17 & 18 | GdP94 5 | 5 | 119.5 | 5.0 |
| NVSS | 394 | 1.4 | ||
| Sch96 NC | 6 | 334 | 1.400 | |
| MRC1251287 | 4 | 940 | 0.408 | |
| 1116 | 0.327 | |||
| (E)19 | GdP94 4 | 5 | 2.3 | 5.0 |
| NVSS | 11 | 1.4 | ||
| (C)20 | Slee94 1a/b | 1 | 183.2 | 4.9 |
| PKS B1251289 | 3 | 480 | 2.7 | |
| NVSS | 1090 | 1.4 | ||
| Sch96 SC | 6 | 864 | 1.4 | |
| 5780 | 0.327 | |||
| (D)21 | Slee94 2 | 1 | 18.1 | 4.9 |
| NVSS | 91 | 1.4 | ||
| Sch96 SR | 6 | 34 | 1.4 | |
| 220 | 0.327 |
(1) Catalogue ID from Table 3. Multiple IDs are given if the sources were blended; (2) name as given in NED; (3) references: 1Slee, Roy & Savage 1994, 2Griffith et al. 1994, 3Bolton et al. 1979, 4Robertson & Roach 1990, 5Gregorini et al. 1994, and 6Schindler 1996; (4) integrated flux density; note that the Sch96 measurement of 29 does not include the tail component which is 180 mJy; (5) observing frequency.
Slee, Siegman & Perley (1989) imaged C and D with the VLA at 5.0 GHz and their images show the same structure as our ATCA images. They do not, however, provide any published results for A or B. The Parkes catalogue (Bolton et al. 1979) classifies C as an edge darkened FR I double but the resolution was not sufficient to separate A and B. Gregorini et al. (1994) imaged A with the VLA at 5.0 GHz as part of a wider sample of radio-loud dumbbell galaxies, but did not separate the two individual sources A1 and A2. Finally, Schindler (1996) observed this cluster using the VLA in its CnB configuration at both 1.4 and 0.327 GHz. The 0.327 GHz observations indicate that D has a long tail extending to the W. Our 843 MHz MOST image shows only a small extension in the direction of the tail suggesting that the tail has a very steep spectrum. Schindler’s observations at 1.4 GHz have lower resolution than the ATCA images shown in Figs. 2–5.
In addition, this cluster has been observed at 1.4 GHz as part of the NRAO VLA Sky Survey (NVSS). These images have a sensitivity and beam size (45″FWHM) similar to the MOST but with better N-S resolution. The NVSS image shows E quite clearly. D shows a vestigial tail while C shows an extension to the south. In fact all four main sources are clearly extended. We measured the flux densities of sources A–E using TVSTAT, and a comparison of the NVSS results with our ATCA measurements and those of Schindler (1996) in Table 5 confirms that we are missing extended flux.
In Fig. 6 we have combined our integrated flux density measurements with those in Table 5 and plotted the radio spectra of A–C. Power laws were fitted to determine the spectral indices, using the NVSS data in preference to other data at 1.4 GHz. Most of the other VLA and ATCA measurements will underestimate the true flux density. While A is a blend of two sources, A1 and A2, the overall spectral index is dominated by the spectral index of A1 whose integrated flux density is times higher than A2. The spectral indices of A1 and A2 quoted in Table 3 were determined using only the 1.4 and 2.4 GHz ATCA images. The sources are clearly separated in the 2.4 GHz image. In the 1.4 GHz image there is some blending at the lowest levels but most of the emission is clearly separated. To estimate the uncertainty due to blending we summed over different polygonal regions around the two sources. The resultant integrated flux densities where never more than 10% from the quoted values, corresponding to an error of for the spectral index. Both A1 and A2 have a steep spectrum ().
The spectrum of B appears to be curved and this may be an indication of spectral aging in this source. Using the NVSS data point and the low frequency data (327 and 843 MHz) we found that D has a steep overall spectral index (including the tail) of . E has an even steeper index of between 0.8 and 1.4 GHz.


4 Discussion
4.1 Optical emission
4.1.1 Cluster luminous mass distribution
In order to determine the distribution of luminous mass in A3528 we have generated galaxy surface density plots, both with and without luminosity weighting. These are shown in Fig. 7.
Galaxy positions and magnitudes for a field in diameter and centred midway between A3528N and A3528S were extracted from the COSMOS database (Drinkwater, Barnes & Ellison 1995). Spectroscopic surveys of the Shapley region (Bardelli et al. 1994) indicate that galaxies with are unlikely to be physical members and so we set our upper limit at . The apparent magnitudes were converted to a linear flux scale, which is equivalent to a luminosity scale if all galaxies are assumed to be at the same distance. We then used miriad to generate point sources at the locations of the galaxies with amplitudes proportional to the galaxy luminosity. Clearly there is a possibility of contamination by foreground and background galaxies. While colour information would help to distinguish cluster members (Squires et al. 1996), for a cluster as rich as A3528 contamination should not be a serious problem (N. Kaiser, private communication). The COSMOS galaxies were grouped into bins before being smoothed with a gaussian filter ( FWHM) but better results could have been obtained by using an adaptive kernel smoothing process which has the advantage of higher resolution in regions with large numbers of counts and higher smoothing in low count regions.
Fig. 7 clearly shows the optically rich A3528N. Whereas Raychaudhury et al. (1991) found no secondary peak in the isopleths coincident with the X-ray peak of A3528S, the use of a fainter optical cutoff and luminosity weighting does show the relatively poor group A3528S. Optical spectroscopy appears to indicate that A3528N and A3528S are not simply close in projection but are physically close as well. Quintana et al. (1995) plot the velocity distribution for 39 galaxies out to 3 Mpc from the centre of A3528N which encompasses A3528S as well. Distinct velocity components due to A3528N and A3528S are seen. While the two components do not overlap, they are only separated by km s-1.
4.1.2 Radio-Optical Identifications
We carried out a search for identifications for the radio sources in Table 3 with COSMOS objects which were consistent with being cluster members. The results are given in Table 6.
| (1) | (2) | (3) | (4) | (5) | (6) | (7) |
|---|---|---|---|---|---|---|
| N | RA Dec | z | a | b | PA | |
| (J2000) | (mag) | (″) | (″) | (°) | ||
| (B)16 | 12 54 20.35 29 04 08.5 | 16.9 | 0.05431 | 12.1 | 10.4 | 130 |
| (A1)17 | 12 54 22.09 29 00 48.7 | 0.05792 | ||||
| (A2)18 | 12 54 23.31 29 01 04.7 | 0.05441 | ||||
| (E)19 | 12 54 40.71 29 01 48.3 | 17.3 | 0.05271 | 11.9 | 8.4 | 135 |
| (C)20 | 12 54 41.05 29 13 39.2 | 14.3 | 0.05741 | 37.8 | 30.1 | 114 |
| (D)21 | 12 54 52.40 29 16 16.2 | 15.8 | 24.2 | 13.6 | 179 |
Notes to Table 6: B is identified with galaxy g1 (see Fig. 3). Since COSMOS has difficulty in deconvolving partially blended objects we relied on the literature for the optical positions of d1 and d2 (see Fig. 2). (1) catalogue ID from Table 3; (2) COSMOS position with PPM correction (Drinkwater et al. 1995); (3) COSMOS apparent magnitude (accurate to about 0.5 mag.); (4) redshift: 1Quintana et al. 1995, 2Postman & Lauer 1995; (5) semi-major axis; (6) semi-minor axis; (7) major axis position angle E of N.
In the case of the extended sources A–D, identifications were made from an examination of the radio-optical overlays in Figs. 1–5. We have already noted (Sec. 3.2) that A1 and A2 are identified with the two members, d1 and d2, of the putative dumbbell galaxy (and BCM of A3528N) included in a study undertaken by Gregorini et al. (1992, 1994). A1 is centred directly on the dominant component d1 and, in projection at least, the radio emission does not appear to extend beyond the optical halo. There is a small but significant positional offset between d2 and the peak of the radio emission of A2, in the direction of the radio tail. d1 has a line of sight peculiar velocity relative to the mean velocity of A3528N of km s-1 (Postman & Lauer 1995). The velocity of d2 with respect to d1 is consistent with being zero ( km s-1). On the other hand the radio morphology suggests d2 has a substantial transverse velocity with respect to d1 and the cluster.
In the case of B the 1.4 GHz image does not distinguish clearly between the two potential galaxy identifications, g1 and g2 in Fig. 3. The redshift of g1 confirms it as a cluster member, while the apparent magnitude of the brighter galaxy g2 is consistent with it being a cluster member. Based on the 2.4 GHz image we conclude that B is most likely associated with g1. However, we do not observe a clear radio core, so it is still possible that B is associated with g2 and the radio emission has become completely detached from the host galaxy; a similar configuration is seen in the source J13243138 in A3556 (Venturi et al. 1997). Better radio data are needed to test this hypothesis.
C is identified with the brightest galaxy in A3528S, a confirmed cluster member. The eastern knot of D is coincident with the core of another galaxy with an apparent magnitude consistent with it being a member of A3528S. E was the only unresolved or slightly resolved source identified with a cluster galaxy.
4.2 X-ray emission
Raychaudhury et al. (1991) published an EINSTEIN IPC image of A3528, showing clearly its bimodal structure. Schindler (1996) published results from a pointed ROSAT PSPC (11.8 ks) observation that included A3528 and fitted isothermal -models to A3258N and A3258S. Schindler determined values of 0.66 and 0.49 and values of 2.0 and 1.3 arcmin for A3528N and A3528S respectively; however, it should be noted these estimates are not based on deconvolved images (Schindler, priv. comm.). These models yielded luminosities in the 0.1–2.4 keV band of erg s-1 and erg s-1 for A3528N and A3528S respectively. So while A3528S is optically less rich, it is slightly more X-ray luminous. This may be due to a higher fraction of gas to total mass in A3528S, excess emission from a cooling flow, or a significant contribution to the X-ray emission from the AGN host for radio source C. Unfortunately, in this obervation A3528 was some from the centre of the detector and partly obscured by the support structure for the entrance window. To investigate how this affects the determination of the cluster morphology, we have retrieved the data from the ROSAT archive and overlaid the X-ray contours (raw counts) on the corresponding exposure map.
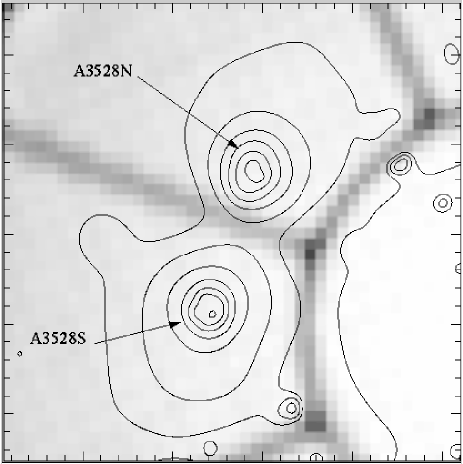
The archival PSPC image, shown in Fig. 8, was filtered using a multi-resolution wavelet analysis (Starck & Pierre. 1997), designed to suppress photon noise and restore structures on different scales, as well as to enhance extended emission (a simple gaussian filter was used by Schindler 1996). At an off-axis distance of , the PSF FWHM is at 1 keV. We have tuned the filter to fully exploit this limited spatial resolution, and the lowest contours — except those close to the obscured regions — are at least 3.7.
On the other hand, it is extremely difficult in practice to produce an exposure-corrected image with this technique since our analysis is based on individual photon statistics, whereas the exposure map is averaged over time. The sharp shadowed boundaries present in these observations would produce singularities. In particular, the region between the two clumps is severely affected by a reduction in exposure (a factor of for the interface region and for the nodes of the support). This means that contours across the support should be about twice as high as shown in the figure, and the outermost contours are unreliable. Despite this, our re-analysis of the data suggests the presence of a pointlike source in the southernmost maximum. A S-N cut through each peak is displayed in Fig. 9 and these show significant differences in shape.
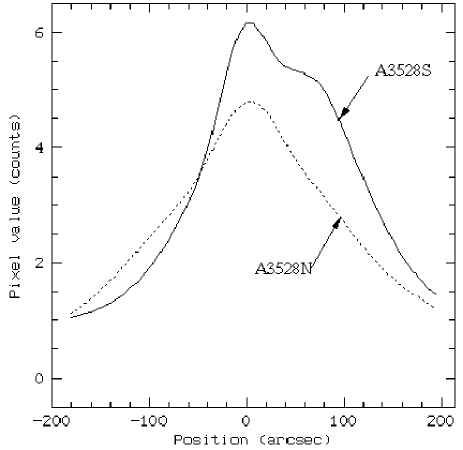
The peak of the southern profile is narrower above 5 counts and the scale of the feature is compatible with that of the PSF. This agrees with Schindler’s results, giving a much smaller core radius for the A3528S than for A3528N. Small values of and are suggestive of a cooling flow but the low S/N and poor resolution of the observations does not allow us to confirm its existence. The wavelet analysis also shows a NE-SW elongation of the highest contour in A3528N (see Fig. 8) which appears to align roughly with the major axis of A1; however, this interpretation must be considered with caution since local exposure variations have not been taken into account.
As to the optical counterparts of these X-ray features, we are unable to rely directly on the given satellite attitude solution (which often shows slight inaccuracies) since a few arcsec offset at the detector centre — as well as roll angle uncertainty — would result in much higher displacements at 30′off-axis distances. Indeed, we find a 20–30″offset between the two X-ray centroids and the expected values corresponding to the radio positions. Unfortunately, no point sources were present outside the cluster at both wavelengths to provide independent astrometry. Close correspondence between the separation of the X-ray (828″) and radio centroids (813″) — a difference of 15″, small compared with the X-ray PSF — makes it likely that the X-ray maxima are associated with the BCMs of A3528N and A3528S and their associated radio sources, A and C respectively. Furthermore, the excess component of X-ray emission in A3528S, whether it is due to the AGN or a cooling flow, is most likely to be coincident with the radio-loud BCM.
4.3 Dynamical state of A3528
Clusters which are in the process of merging may give biased estimates of the gas and total cluster mass, particularly if we extrapolate beyond the observed X-ray emission. N-body/hydrodynamical simulations of hierarchical cluster evolution (Evrard 1990a,b; Schindler & Wambsganss 1993; Roettiger, Burns & Loken 1993, 1996) indicate that mergers contribute to turbulence which produces an inhomogeneous, multiphase gas distribution both by stirring the existing cluster gas adiabatically and by directly introducing cooler gas. The gas may also be shocked (Fabian & Daines 1991). Such conditions may also lead to major disruption of cooling flows (McGlynn & Fabian 1984) which in some cases may not be able to re-establish themselves (Burns et al. 1997). Observable characteristics of such clusters may include:
-
(1).
peaks in the X-ray not corresponding with BCMs or peaks in the galaxy density;
-
(2).
large X-ray core radii;
-
(3).
elongated X-ray distribution with major axis oriented perpendicular to the collision axis in the inner region
-
(4).
elongated X-ray distribution with major axis oriented along the collision axis on large scales;
-
(5).
temperature substructure;
-
(6).
likely compression heated gas, hotter than inferred from velocity dispersion of associated galaxy clumps;
-
(7).
an unusually high velocity dispersion and/or a large velocity difference between BCMs;
-
(8).
excess starburst activity due to the compression in the shock front.
Such conditions may partly explain discrepancies between the determination of the cluster potential from gravitational lensing (Miralda-Escudé & Babul 1995) and from spectroscopic and X-ray studies. It may also explain why some clusters (eg. Hydra I: Fitchett & Merritt 1988) do not fit well on the – relationship (Quintana and Melnick 1982). Other examples of clusters displaying all or most of the characteristics of an advanced merger are A754 (Henry and Briel 1995; Zabludoff & Zaritsky 1995) and the Jones & Forman (1984) nXD clusters Coma (Biviano et al. 1995), A2255 (Burns et al. 1995) and A2256 (Edge, Stewart & Fabian 1992; Röttgering et al. 1994).
A3528 fails to display many of the characteristics of a merger. For instance Raychaudhury et al. (1991) indicated likely cooling flows in both A3528N and A3528S; while Schindler (1996) was only able to specify upper limits of a Hubble time for the cooling time, it is likely to be much less than this (Sec LABEL:earo). Temperature substructure, however, is possibly the most sensitive probe of cluster-cluster merging (Roettiger et al. 1996). Indeed, Schindler (1996) found evidence for temperature substructure in A3528 and, based upon the results of N-body and hydrodynamic simulations, concluded that gas is being heated in the merging front between A3528N and A3528S prior to collision. While the evidence appears to favour a pre-merging scenario we cannot totally discount the possibility that A3528N and A3528S have already passed through each other.
4.4 Radio emission
There is now considerable evidence that tailed radio sources are associated with substructure and therefore mergers, in clusters (McHardy 1979; Valentijn 1979; Burns et al. 1994b; Doe et al. 1994; Venkatesan et al. 1994; Bliton et al. 1995; Gomez et al. 1997). Hydro simulations of jet propagation in merging clusters (Loken et al. 1995), as well as observations (Burns et al. 1994b), indicate that large-scale bulk flows and resulting shear discontinuities and shocks are likely to influence the morphology of extended radio sources. Tidal interactions between subclusters may also affect the peculiar velocities, and therefore the radio morphology, of galaxies through ram pressure effects.
A3528 has an exceptional number and variety of tailed radio sources. Is this due to the “cluster weather” generated by components which have already passed through each other, as has been proposed for Coma (Burns et al. 1994c), or, if A3528 is in a pre-merging state, is it the result of tidal interactions between the two subclusters beginning to affect the peculiar velocities of galaxies. In the following sections we attempt to identify the dominant physical mechanism shaping the morphology of each of the sources in A3528 and thereby determine if the morphologies are linked, either directly or indirectly, to the dynamical state of the cluster.
4.4.1 The BCM sources
The bright galaxies at the centres of A3528N and A3528S respectively are both moderately powerful radio sources, A1 and C. Their formation and evolution are likely governed by their location as their radio jets interact with or are impeded by the high ambient pressure of the ISM/ICM at the bottom of the cluster potential well (Rudnick & Owen 1977; Simon 1978; Burns, Gregory & Holman 1981; Ball, Burns & Loken 1993). It is also possible that a cooling flow may in turn fuel the radio core directly through mass accretion (Burns et al. 1981; Valentijn & Bijleveld 1983; Zhao, Burns & Owen 1989; Burns 1990; Ball et al. 1993).
The radio emission from C has a clear WAT morphology. The tails may have been bent by merger-related bulk motions, ram-pressure or buoyancy forces (Gisler & Miley 1979; Patnaik & Singh 1988; Worrall, Birkinshaw & Cameron 1995). In a premerging cluster, however, we would not expect to see bulk motions of the ICM nor large peculiar velocities of BCMs (Zabludoff et al. 1993). If the two components had already passed through each other we would expect any bulk motions to be directed along the merging axis. There is, however, a misalignment between the merging axis and the symmetry axis of C of 90°.
The radio emission from A1 appears, at least in projection, to be contained completely within the optical halo of the galaxy. Its small size and symmetric double structure may be due to recent triggering (Sec. 4.4.4) so there has not been sufficient time for the jets to push the working surface outside the ISM of the host galaxy.
4.4.2 Non-BCM sources
In addition to the two BCM sources A1 and C there are three extended radio sources associated with non-BCMs: A2, B and D.
Radio sources associated with non-BCMs tend to have more distorted morphologies (NAT and HT) than those associated with BCMs (O’Dea & Owen 1985). Indeed A2 and D are HTs and B is probably a NAT. Such tailed morphologies may result from an absence of, or at least a truncation of, the galaxy halos (Norman & Silk 1979) and higher peculiar velocities, which follows from equipartition arguments. The direction of the axis of symmetry should then reflect the trajectory of the galaxy. If a galaxy were to plunge through the core of a cluster then this mechanism should be particularly effective, due to the extreme conditions there (Takeda, Nulsen & Fabian 1984), and the jets may be bent back so much by ram-pressure that they can not longer be resolved by the observations and therefore appear to be a single tail. This is probably the case for A2.
The radio observations reveal, therefore, that d2 is not bound to d1 and that this is not a true dumbbell system. Galaxies are often seen close in projection to BCMs at the centres of clusters but with a significantly different redshift implying high peculiar velocities along the line of sight (Merrit 1985). In the case of d2, however, the peculiar velocity is inferred to be almost entirely in the plane of the sky.
Finally, the HT source D is diffuse and has a steep spectrum, consistent with D being an old and slowly moving source in a lower density environment. At 0.327 GHz (Schindler 1996) the ridge line of the tail appears slightly curved in the sense expected for a galaxy in orbit around A3528S.
4.4.3 Radio source morphology and the pre-merging environment of A3528
Are the tailed sources in A3528 linked in some way with the merging event? We find no direct evidence for the effects of bulk flows or shocks in the radio images, consistent with a pre-merging state for A3528. However, we have evidence of individual galaxies whose trajectories may have been disturbed by tidal interactions between A3528N and A3528S. In particular we have A2 which is physically close to the centre of A3528N and on a plunging orbit. Radial orbits are not expected near the centres of virialized clusters as numerical simulations (West, Dekel, & Oemler 1987) and theoretical arguments (Lynden-Bell 1967) indicate that orbits should circularise very quickly. We may therefore be witnessing the early passes of d2 through the centre of A3528N.
In the pre-merging scenario it is possible that d2 was originally near the periphery of either A3528N or A3528S and was therefore susceptible to being perturbed into a plunging orbit towards the centre of A3528N. A reasonable estimate of the time since d2 was near the periphery of A3528N is the sound crossing time of galaxies in clusters ( yrs) which is comparable with the merger timescale of the clusters (Schindler 1996).
4.4.4 Radio source triggering and CSS sources
If galaxy interactions are important in radio source triggering, we might expect to see an excess of radio sources in galaxy rich environments. An excess is indeed seen (Burns & Owen 1977; Burns et al. 1981; Robertson & Roach 1990; Brown & Burns 1991) but this can be explained through higher galaxy densities and the nature of the bivariate radio luminosity function (McHardy 1979; Venturi, Feretti & Giovannini 1989; Kim et al. 1994; Ledlow & Owen 1995).
There is evidence, however, that triggering of radio activity does involve environmental factors (Lilly & Prestage 1987; Hanisch 1984; Gavazzi & Jaffe 1986; Venturi, Giovannini & Feretti 1990). In particular Byrd and Valtonen (1990) have shown that gravitational interactions with other galaxies and/or the cluster potential cause nuclear inflows which can trigger or fuel an AGN. d1 and d2 may be an example of this as the tail of A2 is stubby in Fig.2, in contrast to B and D, and this leads us to speculate that the radio activity in A2 started abruptly as the galaxy d2 approached the centre of the cluster.
We also note an intriguing connection between A1 and the enigmatic class of Compact Steep Spectrum (CSS) sources (Fanti et al. 1990). A1 bears all the hallmarks of a CSS source: compact double structure, a linear size of kpc and a spectral index . Evidence is mounting that these characteristics are the result of youth, rather than confinement by a dense ISM, and our tentative interpretation of the A1/A2 complex is consistent with this picture. If we assume that A2 has a transverse velocity of 1000 km s-1 and that the radio emission was triggered in A1 and A2 at about the same time, then the 55 kpc tail length for A2 implies that radio activity started about years ago. This is remarkably consistent with typical lifetimes of yrs estimated for CSS sources (Fanti et al. 1995) and is very short compared with the typical lifetimes of the central engines in large radio sources of years. Higher resolution radio images are needed to test this interpretation.
4.5 Contamination of ICM X-ray emission
Strong correlations are seen between the radio and X-ray bands for radio-loud quasars and radio galaxies (Brinkmann, Siebert & Boller 1994; Brinkman et al. 1995; Baker, Hunstead & Brinkmann 1995) and there is mounting evidence for contamination of diffuse thermal X-ray emission from the ICM by non-thermal emission from AGN. However, while Edge & Röttgering (1995) found unresolved ROSAT PSPC sources associated with HT sources with power-law spectra similar to non-thermal emission from BL Lacs and Seyferts, in general the AGN contribution was a small component of the total X-ray flux from the surrounding clusters. Our X-ray analysis of A3528 has revealed a similarly small pointlike X-ray source which is probably coincident with C. In addition, the X-ray emission near the core of A3528N (highest contour) may be elongated in the same direction as the axis of the radio source A1. If this is confirmed with more sensitive, high resolution X-ray observations (eg. XMM) then it may signify interaction between the radio jet and the ISM/ICM. We think it unlikely due to inverse Compton scattering of CMB photons into the X-ray. This is because the predicted X-ray flux in the ROSAT PSPC band for this radio source, using the formulae in Harris & Grindlay (1979) and assuming the minimum energy magnetic field, is of the order of erg s-1 cm-2, which is three orders of magnitude less than the central surface brightness determined by Schindler (1996).
5 Conclusions
Using new higher resolution radio observations made with the ATCA and by re-analysing archived ROSAT PSPC data, we have been able to build a more detailed picture of the relationship between the radio emission and the pre-merging environment in A3528. In particular we find that:
-
(1).
There is an exceptional number and variety of tailed radio sources associated with galaxies in A3528: one WAT (C), one NAT (B) and two HTs (A2 and D). Ram pressure appears to be primarily responsible for the morphologies of A2 and D, while buoyancy and/or ram pressure may contribute to the morphology of B. We see no obvious indication that bulk motions and/or shocks in the ICM affect the morphology of any of the radio sources, and this is consistent with A3528 being a pre-merging cluster.
-
(2).
There are separate radio sources A1 and A2 associated with each component, d1 and d2 respectively, of the putative dumbbell galaxy at the centre of A3528N. We infer that the minor member of the dumbbell, d2, is on an plunging orbit, predominantly in the plane of the sky, and is not bound to the central galaxy d1. We speculate that this galaxy may have been perturbed into its present orbit by the tidal interaction between A3528N and A3528S.
-
(3).
On the basis of the characteristics of the radio emission from both d1 and d2, we also suggest that they were mutually triggered as d2 approached d1. The morphology of A1 suggests it may be related to CSS sources, supporting the growing view that the characteristics of these sources are due primarily to their youth. We infer an age for A1 of years which agrees well with previous estimates for typical ages of these objects.
-
(4).
An unresolved X-ray component near the centre of A3528S may be due either to the AGN powering C or a cooling flow onto the host galaxy. In either case the contribution to the total X-ray emission is small.
The higher sensitivity and improved spatial and spectral resolution of XMM would give a clearer indication of the state of the ICM in A3528 and determine whether the unresolved X-ray component near the centre of A3528S is likely due to a cooling flow or an AGN. Radio observations with higher sensitivity and spatial resolution might also reveal core emission and jet structure in B and elucidate the nature of source D. Nevertheless, in the context of our broader study, the present multi-wavelength observations have been very effective in evaluating the links between the radio and X-ray characteristics and the dynamical state of A3528.
Acknowledgments
We thank Taisheng Ye for assistance in the reduction of the ATCA data and John Reynolds for resolving an astrometric problem; Nick Kaiser for advice concerning the production of the galaxy density plots using COSMOS data; and Andrew Hopkins for supplying a source correlation program. The authors would especially like to thank the referee, Dr. Jack O. Burns, for his recommendations which lead to significant improvements in this paper.
This research has made use of the Australia Telescope Compact Array which is funded by the Commonwealth of Australia for operation as a National Facility managed by the CSIRO; the NASA/IPAC Extragalactic Database; the Astrophysical Data System; the COSMOS/UKST Southern Sky Catalogue supplied by the Anglo-Australian observatory; and the Digitized Sky Survey and 2nd Epoch Digitized Sky Survey.
ADR acknowledges support from an Australian Postgraduate Award, and from the ASA, the IAU, the Australian Nuclear Science and Technology Organisation, the Franco-Australian Science Agreement and the University of Sydney. RWH acknowledges support from the ARC.
References
- [Abell, Corwin & Olowin 1989] Abell G. O., Corwin H. G., Olowin O. P., 1989, ApJS, 70, 1
- [Baker, Hunstead & Brinkmann 1995] Baker J. C., Hunstead R. W., Brinkmann W., 1995, MNRAS, 277, 553
- [Ball, Burns & Loken 1993] Ball R., Burns J. O., Loken C., 1993, AJ, 105, 53
- [Bardelli et al. 1994] Bardelli S., Zucca E., Vettolani G., Zamorani G., Scaramella R., Collins C. A., Macgillivray H. T., 1994, MNRAS, 267, 665
- [Biviano et al. 1995] Biviano A., Durret F., Gerbal D., Le Fevre O., Lobo C., Mazure A., Slezak E., 1996, A&A, 311, 95
- [Bliton et al. 1995] Bliton M., Rizza E., Pinkney J., Burns J. O., 1995, BAAS, 187, #111.02
- [Bolton, Wright & Savage 1979] Bolton J. G., Wright A. E., Savage A., 1979, AuJPA, 46, 1
- [Brinkmann & Siebert 1994] Brinkmann W., Siebert J., 1994, A&A, 285, 812
- [Brinkmann, Siebert & Boller 1994] Brinkman W. J., Siebert J., Boller Th., 1994, A&A, 281, 355
- [Brinkmann et al. 1995] Brinkmann W., Siebert J., Reich W., Furst E., Reich P., Voges W., Trumper J., Wielebinski R., 1995, A&AS, 109, 147
- [Brown & Burns 1991] Brown D. L., Burns, J. O., 1991, AJ, 102, 1917
- [Burgess & Hunstead 1995] Burgess A. M., Hunstead R. W., 1995, PASAu, 12, 227
- [Burns 1990] Burns J. O., 1990, AJ, 99, 14
- [Burns & Owen 1977] Burns J. O., Owen F. N., 1977, ApJ, 217, 34
- [Burns, Gregory & Holman 1981] Burns J. O., Gregory S. A., Holman G. D., 1981, ApJ, 250, 450
- [Burns et al. 1994a] Burns J., Rhee K., Roettiger J., Pinkney J., and Loken C., Owen F., Voges W., 1994a, in B.V. Bicknell, M.A. Dopita, and P.J. Quinn, eds., The First Stromlo Symposium: The Physics of Active Galaxies, ASP Conference Series, 54, p. 325
- [Burns et al. 1994b] Burns J. O., Rhee G., Owen F. O., Pinkney J., 1994b, ApJ, 423, 94
- [Burns et al. 1994c] Burns J. O., Roettiger K., Ledlow M., Klypin A., 1994c, ApJ, 427, L87
- [Burns et al. 1995] Burns J. O., Roettiger K., Pinkney, J., Perley R. A., Owen F. N., Voges W., 1995, ApJ, 446, 583
- [Burns et al. 1997] Burns J. O., Roettiger K., Pinkney, J., Perley R. A., Owen F. N., Voges W., 1997, in Soker N., ed., Galactic and Cluster Cooling Flows, ASP Conference Series, San Francisco, Vol. 115, p. 21
- [Byrd and Valtonen 1990] Byrd G., Valtonen M., 1990, ApJ, 350, 89
- [Cavaliere & Fusco–Femiano 1976] Cavaliere A., Fusco–Femiano R., 1976, A&A, 49, 137
- [Cavaliere and Fusco–Femiano 1981] Cavaliere A., Fusco–Femiano R., 1981, A&A, 100, 194
- [Condon 1997] Condon J. J., 1997, PASP, 109, 166
- [Condon et al. 1996] Condon J. J., et al. 1996, in preparation
- [Cram & Ye 1995] Cram L., Ye T., 1995, AuJPh, 48, 113
- [Day et al. 1991] Day C. S. R., Fabian A. C., Edge A. C., Raychaudhury S., 1991, MNRAS, 252, 394
- [Doe et al. 1995] Doe S., Ledlow M., Burns J. O., White R. A., 1995, AJ, 110, 46
- [Drinkwater, Barnes & Ellison 1995] Drinkwater M. J., Barnes D. G., Ellison S. L., 1995, PASAu, 12, 248
- [Edge & Rottgering 1995] Edge A. C., Röttgering H., 1995, MNRAS, 277, 1580
- [Edge, Stewart & Fabian 1992] Edge A. C., Stewart G. C., Fabian A. C, 1992, MNRAS, 258, 177
- [Einasto et al. 1994] Einasto M., Einasto J., Tago E., Dalton G. B., Andernach H., 1994, MNRAS, 269, 301
- [Evrard 1990a] Evrard A. E., 1990a, in W. R. Oergerle, M. J. Fichett & L. Danly, eds, Clusters of Galaxies. Cambridge University Press, p. 257.
- [Evrard 1990b] Evrard A. E., 1990b, ApJ, 363, 349
- [Fabian 1991] Fabian A. C., 1991, MNRAS, 253, 29P
- [Fabian & Daines 1991] Fabian A. C., Daines S. J., 1991, MNRAS, 252, 17
- [Fanaroff & Riley 1974] Fanaroff B. L., Riley J. M., 1974, MNRAS, 167, 31P
- [Fanti et al. 1989] Fanti R., Fanti C., Schilizzi R., Spencer R., Redong N., Parma P., Van Breugei W., Venturi T., 1990, A&A, 231, 333
- [Fanti et al. 1995] Fanti R., Fanti C., Dallacasa D., Schilizzi R., Spencer R., Stanghellini C., 1995, A&A, 302, 317
- [Feretti et al. 1995] Feretti L., Fanti R., Parma P., Massaglia S., Trussoni E., Brinkmann W., 1995, A&A, 298, 699
- [Fitchett & Merritt 1988] Fitchett M., Merritt D., 1988, ApJ, 335, 18
- [Frater & Brooks 1992] Frater R. H., Brooks J., eds, 1992, Journal of Electrical and Electronics Engineering, Australia, Special Issue: The Australia Telescope, 12, 2, p. 103
- [Gavazzi & Jaffe 1986] Gavazzi G., Jaffe W., 1986, ApJ, 310, 53
- [Gisler & Miley 1979] Gisler G. R., Miley G. K., 1979, A&A, 76, 109
- [Gomez et al. 1997] Gomez P. L., Pinkney J., Burns J. O., Wang Q., Owen F. N., Voges W., 1997, ApJ, 474, 580
- [Gregorini et al. 1992] Gregorini L., Vettolani G., de Ruiter H. R., Parma P., 1992, A&AS 95, 1
- [Gregorini et al. 1994] Gregorini L., De Ruiter H. R., Parma P., Sadler E. M., Vettolani G., Ekers R. D., 1994, A&AS, 106, 1
- [Griffith et al. 1990] Griffith M., Langston G., Heflin M., Conner S., Lehar J., Burke B., 1990, ApJS, 74, 129
- [Hanisch 1984] Hanisch R. J., 1984, A&A, 133, 192
- [Harris & Grindlay 1979] Harris D. E., Grindlay J. E., 1979, MNRAS, 188, 25
- [Henry & Briel 1995] Henry J. P., Briel U. G., 1995, ApJ, 443L, 9
- [Jones & Forman 1984] Jones C., Forman W., 1984, AJ, 276, 38
- [Jones & Mcadam 1992] Jones P. A., Macadam W. B., 1992, ApJS, 80, 137
- [Kim et al. 1994] Kim, K. T., Kronberg P. P., Dewdney, P. E., Landecker T. L., 1994, A&A, 288, 122
- [King 1962] King, I. R., 1962, ApJ, 67, 471
- [Lahav et al. 1989] Lahav O., Fabian A. C., Edge A. C., Putney A., 1989, MNRAS, 238, 881
- [Lasker 1994] Lasker B. M., 1994, in MacGillivray et al. Eds., IAU Symp. 161, Astronomy for Wide-Field Imaging, Kluwer, Dordrecht, p. 87
- [Ledlow & Owen ] Ledlow M. J., Owen F. N., 1995, AJ, 109, 853
- [Lilly & Prestage 1987] Lilly S. J., Prestage R. M., 1987, MNRAS, 225, 531
- [Loken et al. ] Loken C., Röettiger K., Burns J. O., Norman, M., 1995, ApJ, 445, 80
- [Lynden-Bell 1967] Lynden-Bell D., 1967, MNRAS, 136, 101
- [McGlynn & Fabian 1984] McGlynn T. A., Fabian A. C., 1984, MNRAS, 208, 709
- [McHardy 1979] McHardy I.M., 1979, MNRAS, 188, 495
- [Merritt 1985] Merritt D., 1985, ApJ, 289, 18
- [Metcalfe, Godwin & Peach 1994] Metcalfe N., Godwin J. G., Peach J. V., 1994, MNRAS, 267, 431
- [Miley 1980] Miley G., 1980, Ann. Rev. Astron. Astrophys., 18, 165
- [Mills 1981] Mills B. Y., 1981, PASAu, 4, 156
- [Miralda-Escude & Babul 1995] Miralda-Escude J., Babul A., 1995, ApJ, 449, 18
- [Morrison 1995] Morrison, J. E., 1995, in Shaw, R. A. and Payne, H. E. and Haynes, J. J. E. Eds., ASP Conf. Ser. Astronomical Data Analysis Software and Systems IV, ASP, San Francisco, 77, p. 179
- [Nobuyoshi & Suto 1993] Nobuyoshi M., Suto Y., 1993, PASJ, 45, L13
- [Norman & Silk 1979] Norman C., Silk J., 1979, ApJ, 233, L1
- [O’dea & Owen 1985] O’Dea, C., Owen F. N., 1985, AJ, 90, 954
- [O’dea & Owen 1985] O’Dea, C., Owen F. N., 1986, ApJ, 301, 841
- [O’Donoghue et al. 1990] O’Donoghue, A.A., Owen, F.N., and Eilek, J.A., 1990, ApJS, 72, 75
- [Patnaik & Singh 1988] Patnaik A. R., Singh K. P., 1988, MNRAS, 234, 847
- [Pierre et al. 1994a] Pierre M., Hunstead R., Reid A., Robertson G., Mellier Y., Soucail G., Bohringer H., Ebeling H., Voges W., Cesarsky C., Oukbir J., Sauvageot J. L., Vigroux L., 1994a, The ESO Messenger, 78, 24
- [Pierre, Hunstead & Unewisse1994b] Pierre M., Hunstead R., Unewisse A, 1994b, in W. Seitter, Ed., NATO ASI, Cosmological aspects of X-ray clusters of galaxies, Kluwer Academic Publisher, p. 73
- [Pierre et al. 1994c] Pierre M., Böhringer H., Ebeling H., Voges W., Schuecker P., Cruddace R., Macgillivray H., 1994c, A&A, 290, 725
- [Postman & Lauer 1995] Postman M., Lauer T. R., 1995, ApJ, 440, 28
- [Quintana & Melnick 1982] Quintana H., and Melnick, J., 1982, AJ, 87 972
- [Quintana et al. 1995 1995] Quintana H., Ramirez A., Melnick J., Raychaudhury S., Slezak E., 1995, AJ, 110, 463
- [Raychaudhury 1989] Raychaudhury S., 1989, Nature, 342, 251
- [Raychaudhury et al. 1991] Raychaudhury S., Fabian A. C., Edge A. C., Jones C., Forman W., 1991, MNRAS, 248, 101
- [Robertson 1991] Robertson J. G., 1991, PASAu, 44, 729
- [Robertson & Roach 1990] Robertson J. G., Roach G. J., 1990, MNRAS, 247, 387
- [Roettiger, Burns & Loken 1993] Roettiger K., Burns J. O., Loken C., 1993, ApJL, 407, L53
- [Roettiger et al. 1996] Roettiger K., Burns J. O., Loken C., 1996, ApJ, 473, 651
- [Rottgering et al. 1994] Röttgering H., Snellen I., Miley G., de Jong J. P., Hanisch B., Perley R., 1994, ApJ, 436, 654
- [Rudnick & Owen 1977] Rudnick L., Owen, F. N., 1977, AJ, 82, 1
- [Sault, Teuben & Wright 1995] Sault R. J., Teuben P. J., Wright M. C. H., 1995, ADASS, 4, 433
- [Scaramella et al. 1989] Scaramella R., Baiesi–Pillastrini G., Chincarini G., Vettolani G., Zamorani G., 1989, Nature, 338, 562
- [Schechter 1976] Schechter P., 1976, ApJ, 203, 297
- [Schindler 1996] Schindler S., 1996, MNRAS, 280, 309
- [Schindler & Wambsganss 1996] Schindler S., Wambsganss J., 1996, A&A, 313, 113
- [Shapely 1930] Shapley H., 1930, Bull. Harv. Coll. Obs, 874, 9
- [Simon 1978] Simon A. J. B., 1978, MNRAS, 184, 537
- [Slee, Roy & Savage 1994] Slee O. B., Roy A. L., Savage A., 1994, Australian Journal of Physics, 47, 145
- [Slee, Siegman & Perley 1989] Slee O. B., Siegman B. C., Perley R. A., 1989, Australian Journal of Physics, 42, 633
- [Squires et al. 1996] Squires G., Kaiser N., Babul A., Fahlman G., Woods D., Neumann D. M., Böhringer H., 1996, ApJ, 461, 572
- [Starck & Pierre 1997] Starck J. L., Pierre M. M., 1997, A&AS, in press
- [Takeda, Nulsen & Fabian 1984] Takeda H., Nulsen P. E. J., Fabian A. C., 1984, MNRAS, 208, 261
- [Truemper 1992] Trumper J., 1992, QJRAS, 33, 165
- [Valentjn 1979] Valentijn E. A., 1979, A&A, 78, 367
- [Valentijn & Bijleveld 1983] Valentijn E. A., Bijleveld W., 1983, A&A, 125, 223
- [Venkatesan et al. ] Venkatesan T. C. A., Batuski D. J., Robert J., Burns J. O., 1994, ApJ, 436, 67
- [Venturi et al. 1997] Venturi T., Bardelli S., Morganti R., Hunstead R. W., 1977, MNRAS, 285, 898
- [Venturi, Feretti & Giovannini 1989] Venturi T., Feretti L., Giovannini G., 1989, A&A, 213, 49
- [Venturi, Giovannini & Feretti 1990] Venturi T., Giovannini G., Feretti L., 1990, AJ, 99, 1381
- [Vettolani et al. 1990] Vettolani G., Chincarini G., Scaramella R., Zamorani G., 1990, AJ, 99, 1709, 2158, 2159
- [West, DEKEL & OEMLER 1987] West M. J., Dekel A., Oemler A., 1987, ApJ, 316, 1
- [Worrall & Birkinshaw 1994] Worrall D. M., Birkinshaw M., 1994, ApJ, 427, 134
- [Worrall et al. 1994] Worrall D. M., Lawrence C. R., Pearson T. J., Readhead C. S., 1994, ApJ, 420, L17
- [Worrall, Birkinshaw & Cameron 1995] Worrall D. M., Birkinshaw M., Cameron R. A., 1995, ApJ, 449, 93
- [Zabludoff & Zaritsky 1995] Zabludoff A. I., Zaritsky D., 1995, ApJL, 447, 21
- [Zhao, Burns & Owen 1989] Zhao J., Burns J. O., Owen F. N., 1989, AJ, 98, 64
- [Zucca et al. 1993] Zucca E., Zamorani G., Scaramella R., Vettolani G., 1993, ApJ, 407, 470