STELLAR POPULATIONS AND VARIABLE STARS IN THE CORE OF THE GLOBULAR CLUSTER M5111Based on observations with the NASA/ESA Hubble Space Telescope, obtained at the Space Telescope Science Institute, which is operated by AURA, Inc., under NASA contract NAS5-26555
Abstract
We report the discovery of a variable blue straggler in the core of the globular cluster M5, based on a 12-hour long series of images obtained with the Planetary Camera aboard the Hubble Space Telescope. In addition, we present the light curves of 28 previously unknown or poorly studied large-amplitude variable stars (all but one are RR Lyrae) in the cluster core. A (V, U-I) color-magnitude diagram shows 24 blue stragglers within 2 core radii of the cluster center. The blue straggler population is significantly more centrally concentrated than the horizontal branch and red giant stars.
1 Introduction
Globular cluster cores are being imaged intensively with the Hubble Space Telescope, and continue to yield surprises. The realizations that blue stragglers are commonplace, red giants are depleted, and that horizontal branch populations may depend on core properties has spurred on observers in the past five years. As part of our program to study the distributions of blue stragglers and variable stars in globular cores, we have now imaged NGC 5904 = M5.
The globular cluster M5 harbors one of the richest collections of RR Lyrae stars in the Galaxy. It is also home to one of only two known dwarf novae in Galactic globular clusters. Until now, however, not a single blue straggler candidate has been identified in M5. Is this because none exist, or because blue stragglers reside only in the (until now unobservable) core of M5?
In section 2 we describe the observations and reductions; the CMD of the core of M5 is presented in section 3. The variable stars we find are described in section 4 while our results are summarized in section 5.
2 Observations and reductions
2.1 Search for variable stars
A series of twenty-two 600-second exposures of M5’s central (r) region, spanning 11.5 hours, was obtained on March 21, 1993 with the Planetary Camera (PC) aboard the Hubble Space Telescope (HST) before the repair mission. The F336W filter, similar to the Johnson U bandpass (Harris et al. al. 1991), was used for the observations. Standard calibration (bias and dark subtraction, flatfield correction) was performed with STScI software within IRAF/STSDAS.
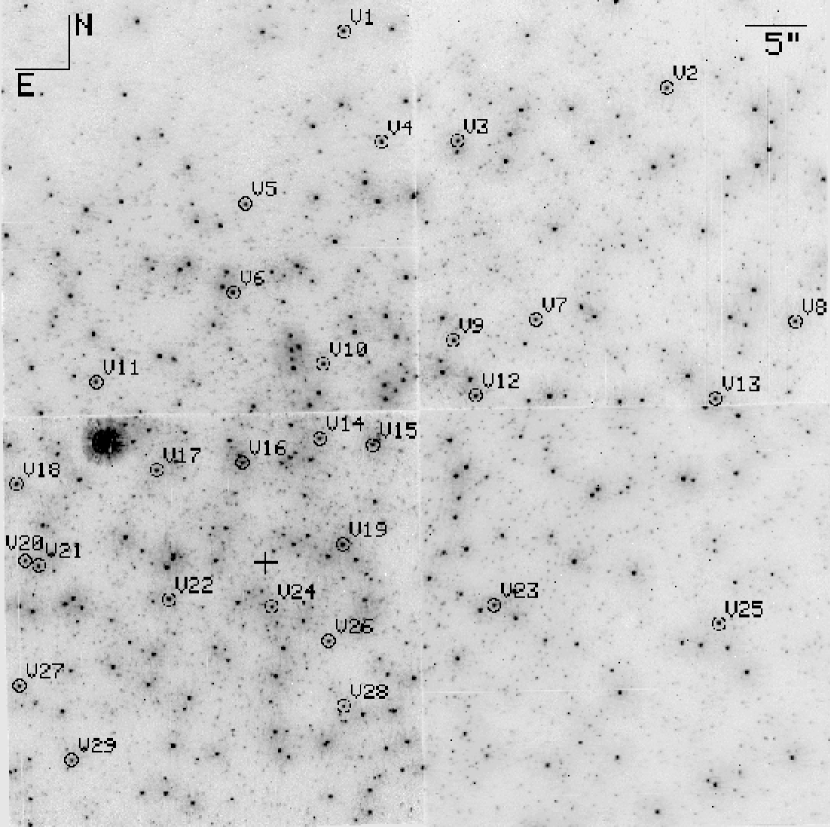
The detection of variable stars was performed as follows. First, the 22 individual images were combined with IRAF’s combine task (with the crreject option) to create a deep image. This image is shown in Figure 1. The individual images were remarkably well aligned with each other, so no shift was necessary. DAOPHOT’s Daofind algorithm (Stetson 1987) was then used to build a masterlist of 3144 stars visible in the deep image.
In order to eliminate the numerous cosmic rays, which are very difficult to remove on single frames, the 22 individual images were combined two by two (again with the combine task and the crreject option), with an overlap of 1 (image 1 + image 2, image 2 + image 3, …). Aperture photometry with an aperture radius of 4 pixels (0.17′′), and a sky annulus with inner and outer radii of 10 and 15 pixels was then performed on the 21 resulting images, using the masterlist of stars previously found. The standard deviation from the mean in the 21 frames was then computed for all stars; this resulted in the discovery (or re-discovery) of 29 variable stars, which will be discussed in section 4.
Note that since for any given star the conditions (PSF, flatfield, star location, aperture, background) are virtually identical from frame to frame (with the exception of faint stars near bright, large amplitude variables), the relative photometry from frame to frame is expected to be much more precise than the relative photometry among stars within the same frame (mostly because of PSF variations which induce position- dependent aperture corrections and overlapping PSFs in a crowded field). While the relative error from one star to the next within a single frame can be as large as 0.2 mag (if simple aperture photometry is used), even for bright stars, the typical standard deviation from the mean of the 21 frames for a given non-variable star is less than 0.05 mag at U=17.5, and reaches 0.1 mag at the cluster main sequence turnoff.
2.2 The color-magnitude diagram
In order to study the stellar populations in M5, a 70 second F555W (equivalent of Johnson V filter; Harris et al. 1991) and a 70 second F785LP (comparable to I) PC images were retrieved from the HST archives. Both images were obtained on December 27, 1991. Fortunately, the center of these frames is only 8′′ away from the center of our images (the total field of view of the 4 PC CCDs is 70′′), so most stars detected in our F336W images are also located in the archive frames; the area common to all three sets of images is arcmin2. Stellar photometry was performed in the most simple way on these frames: aperture photometry (with the same parameters as above) was performed on the deep, combined F336W frame using the masterlist. After proper shift and rotation of the coordinates, the same masterlist was used to obtain aperture photometry of the stars in the F555W and F785LP images. Although PSF-fitting techniques are known to improve the photometric accuracy (especially at the faint end of the luminosity function and near bright stars; see Guhathakurta et al. 1992 for a detailed discussion), simple core aperture photometry gives results which are reliable enough (typically mag above the turnoff) for our purpose. A total of 2153 stars have been included in the color-magnitude diagram discussed below.
Aperture corrections and photometric zero-points determined by Hunter et al. (1992) were used to calibrate the magnitudes and colors of the stars. Moreover, the absolute sensitivity of the CCDs is known to decrease slowly with time following each decontamination (Ritchie & MacKenty 1993); this effect was taken into account.
As a consistency check, the photometric calibration was compared with ground-based data. The average F555W and F336W magnitudes of the RR Lyrae stars are and , while Buonanno et al (1981) find and Richer & Fahlman (1987) obtained . The agreement is excellent.
3 Stellar Populations
The color-magnitude diagram for the 2153 stars located in the area common to the F336W (U), F555W (V) and F785LP (I) frames is shown in Figure 2. In this plot, variable stars (see next section) are identified with special symbols; seven of 29 variables found in the F336W frames are located outside the F555W and F785LP field of view, and are therefore not included in Figure 2. Photometry is fairly complete down to 0.5 magnitude below the turnoff. The large wavelength difference between the U and I filters compensates for the relatively poor photometric accuracy, and allows us to clearly define the stellar populations. Two characteristics of the CMD are worth noting: the significant blue straggler population and the morphology of the horizontal branch.
3.1 Blue Stragglers
The boundaries of the BS region of the CMD have often been arbitrarily defined, vary from author to author, and also depend on the filters used. As emphasized by Guhathakurta et al. (1994), the (V, U-I) CMD is well suited to define the blue straggler population. As a working definition, we decided to include in the BS region of the (V, U-I) CMD all stars significantly brighter (0.4 mag) than the turnoff and bluer than the average main sequence at the turnoff level; twenty-four stars are included in this region of the CMD (surrounded by dotted lines in Figure 2) and can be considered as blue stragglers. Such a significant blue straggler population in the core of M5 is in striking contrast to the outer regions of the cluster, where none have been found (Buonanno et al. 1981, for ; Richer & Fahlman 1987, for ). Recent CCD observations of the central regions of M5 (Brocato et al. (1995); Sandquist et al. (1996)) also reveal some blue stragglers. The two-dimensional distribution of red giants, horizontal branch stars and blue stragglers is shown in Figures 3a-c. It is obvious from these plots that the BS population is preferentially concentrated in the very core of the cluster. This is quantified in Figure 4a, which shows the cumulative distribution of the different stellar populations within the inner 50′′, and in Figure 4b, within one core radius (). A simple K-S test showed that there is a 99.5% probability that the blue stragglers in the core of M5 are more centrally concentrated than the horizontal branch stars, and a 97.5% probability that they are more centrally concentrated than the red giants.
This tendency for blue stragglers to be more centrally concentrated than other cluster members has been noted for most globular clusters observed to date (see Sarajedini (1993), Yanny et al. 1994 and references therein), and is consistent with the hypothesis that BS are more massive than main sequence stars.
The luminosity-inferred lifetime of the shortest-lived, most luminous blue straggler in the core of M5 is yrs, assuming it lies on the hydrogen-burning main sequence. This corresponds to the star with V = 16.0, and . The relaxation time in the core of M5 is yrs (Djorgovski 1993). Hence, all BS in the core of M5 are expected to be dynamically relaxed. Thus, the radial distribution of the BS is, indeed, a direct probe of their masses.
In order to compare the blue straggler population from cluster to cluster, Bolte, Hesser & Stetson (1993) have defined the specific frequency, , as the ratio of the number of blue stragglers to the total number of stars brighter than 2 magnitudes below the horizontal branch at the instability strip. In the case of the central region of M5 (area in common to the U, V and I HST/PC frames), where ,
This value is smaller than the specific frequencies found by Guhathakurta et al. (1994) for the core of M3 (0.09) or 47 Tuc (0.07). There is no known correlation between and any obvious cluster property.
3.2 Horizontal Branch Morphology
The second important feature to notice in the CMD is that the horizontal branch is clearly split into two sub-populations, with a significant gap (0.25 mag) in between, at . This gap is also clearly present in the CCD data of Brocato et al. (1995) and possibly of Reid (1996), but not in the high-quality data of Sandquist et al. (1996). The large wavelength coverage of the WFPC2 data probably increases the width of the gap. Hesser (1988) has pointed out that discontinuous horizontal branches with very blue tails are surprisingly common, including M15, NGC 288, NGC 1851, and at least 10 other clusters. He suggests that gaps may provide important constraints on mixing in earlier stages of stellar evolution. We see no evidence that the gap width changes between the inner and outer parts of the core.
4 Variable Stars
Figure 5 shows the standard deviation as a function of the average U magnitude for all the stars in the F336W frames. The usual problem with outliers in Figure 5 (due to mismatches in star lists) was almost completely avoided because (a) the same master list for all frames (see section 2.1), and (b) all images were perfectly aligned with each other. Visual inspection of the few remaining outliers immediately showed them to be mismatches and they were eliminated from our photometry. Stars with RMS magnitude of variability higher than 2 sigma above the mean curve were considered possible variables and were examined more closely. Most of them were faint stars located close to bright, large-amplitude variables. Twenty-eight stars stand out as bright, large-amplitude variables in Figure 5, as well as one fainter, low-amplitude variable star. Seven of these variable stars had never been identified previously, and two (HST-V20 and V21) were considered as a single star. All but one of the large-amplitude variables have light curves typical of RR Lyrae stars, whereas the low-amplitude variable is a blue straggler. Information on the variables, including cross-identification with previous papers, is presented in Table 1. We note that the cataclysmic variable V101 is North and West of the center of M5 and is therefore too distant to have been included in the field of view of the Planetary Camera ().
4.1 A Variable Blue Straggler
Of 24 blue stragglers identified in Figure 2, only one (HST-V28) shows evidence for variability above the noise level. Although only HST-V28 showed up above the 2-sigma variability level in Figure 5, we have examined the light curve of every blue straggler and compared them with those of nearby stars of similar magnitude in order to find possible variations undetected by our technique; no new variable showed up. But because the noise level is still relatively high between V=17 and V=18 (the 2 variability level varies from 0.06 to 0.12, corresponding to amplitudes 0.2 - 0.3 mag), we cannot exclude the possibility that some blue stragglers are actually small amplitude variables.
The color-magnitude diagram (Figure 2) shows that HST-V28 is the bluest, and one of the brightest blue stragglers in M5 (with ). Figure 6 shows its light curve, along with light curves of 3 nearby comparison stars of the same magnitude. HST-V28 is obviously variable, with an amplitude mag. Unfortunately, our data do not allow us to determine the period with any precision (or even to determine if the variations are periodic). Phase dispersion minimization algorithms favor a periodicity of the order of 15 hours (in which case this star could be an eclipsing binary), but cannot completely exclude periods shorter than 1.9 hours (typical for pulsating blue stragglers in clusters; Mateo 1993). Better photometric accuracy and temporal sampling are obviously necessary to determine the period and nature of HST-V28.
Guhathakurta et al. (1994) recently discovered 2 variables among the 28 blue stragglers in the core of M3. Both have photometric amplitudes mag and periods 6-12 hours. Guhathakurta et al. suggest that both stars are dwarf cepheids.
4.2 RR Lyrae Stars
Among the 97 genuine variables listed in Sawyer-Hogg’s (1973) catalogue, 93 are RR Lyrae. Recently, Kalda et al. (1987) and Kravtsov (1988, 1992) searched for new variables in the central, crowded region of the cluster and found 30 more. So far, the light curves of only two of these new variables have been published (Kravtsov 1992). A recent review of the M5 RR Lyrae population has been published by Reid (1996).
The U-band light curves of all RR Lyrae stars found in the HST images are shown in Figure 7. Tentative periods have been determined for the 9 type RRc stars with a phase dispersion minimization algorithm, and the results are presented in Table 1. The periods of RRab stars are too long to be determined from our observations alone.
4.3 HST-V1
Eclipsing binary stars are common in the periphery of M5’s core (Reid 1996, Yan & Reid 1996), but star HST-V1 is unique among the variables found in the core of M5. Although our observations do not cover an entire cycle (P), the light curve suggests that HST-V1 is a contact (or semi-detached) binary. The secondary minimum is very asymmetric, somewhat reminiscent of the near-contact binary V361 Lyrae (Kaluzny 1990). The strong asymmetry of the light curve of V361 Lyr, more pronounced at shorter wavelengths, is thought to be caused by the presence of a hot spot on the secondary star resulting from the high mass transfer rate from the primary star.
Unfortunately, HST-V1 lies outside the boundaries of the F555W and F785LP frames, so its color cannot be determined. But with an average magnitude of U=15.7, HST-V1 is more than two magnitudes brighter than the turnoff; if it is a cluster member, at least one of its components must be a giant.
5 Summary
The main results of our paper can be summarized as follows:
(1) The core of M5 contains a highly centrally concentrated population of blue stragglers, similar in size to that found in 47 Tuc (Paresce et al. 1991).
(2) Of 24 blue stragglers detected in the HST images, only one shows significant variability above the noise level. Since our data are not sensitive enough to detect variables of amplitude mag in the V=17-18 range, we cannot exclude the possibility that some blue stragglers may be variable below that level. A more sensitive search with the refurbished HST is highly desirable.
(3) We confirm the existence of a 0.2 mag gap in the color-magnitude distribution of the horizontal branch, first noted by Brocato et al. . The nature of this gap is still unknown.
(4) We have presented finding charts and light curves for 27 RR Lyrae variables and one probable contact binary. Among those variables, seven were previously unknown and 21 had no published light curve.
Acknowledgements.
Support for this work was provided by NASA through grant number GO-3872 from the Space Telescope Science Institute, which is operated by the Association of Universities for Research in Astronomy, Inc., under NASA contract NAS5-26555.References
- (1) Bolte, M., Hesser, J. E., & Stetson, P. B. 1993, ApJ, 408, L89
- (2) Brocato, E., Castellani, V., & Ripepi, V. 1995, AJ, 109, 1670
- (3) Buonanno, R., Corsi, C. E., & Fusi Pecci, F. 1981, MNRAS, 196, 435
- (4) Djorgovski, S. G. 1993, in Structure and Dynamics of Globular Clusters, ASP Conf. Ser., Vol. 50, S. G. Djorgovski and G. Meylan, eds., p. 373
- (5) Guhathakurta, P., Yanny, B., Schneider, D. P., & Bahcall, J. N. 1992, AJ, 104, 1790
- (6) Guhathakurta, P., Yanny, B., Bahcall, J. N., & Schneider, D. P. 1994, AJ, 108, 1786
- (7) Harris, H. C., Baum, W. A., Hunter, D. A., & Kreidl, T. J. 1991, AJ, 101, 677
- (8) Hesser, J. E. 1988, IAU Symposium No. 126, eds. J. E. Grindlay and A. G. Davis Philip, p. 65
- (9) Hunter, D. A., Faber, S. M., Light, R., & Shaya, E. 1992, in Wide Field/ Planetary camera Final Orbital/Science verification Report, ed. S. Faber (STScI, Baltimore), chap. 12
- (10) Kaluzny, J., 1990, AJ, 99, 1207
- (11) Kaluzny, J., & Shara, M. M. 1987, ApJ, 314, 585
- (12) Kravtsov, V. V., 1988, Astron. Tsirk., 1526, 6
- (13) Kravtsov, V. V., 1992a, Sov. Astron. Lett. 18(4), 246
- (14) Kravtsov, V. V., 1992b, Sov. Astron. Lett. 17(6), 455
- (15) Kadla, Z. I., Gerashchenko, A. N., Jablokova, N. V., & Irkaev, B. N., Astron. Tsirk., 1502, 7
- (16) Mateo, M. 1993, in Blue Stragglers, ed. R. A. Saffer (ASP Conf. Ser. 53), p. 74
- (17) Paresce, F., Meylan, G., Shara, M. M., Baxter, D., & Greenfield, P. 1991, Nature, 352, 297
- (18) Reid, N. 1996, MNRAS, 278, 367
- (19) Richer, H. B., & Fahlman, G. G. 1987, ApJ, 316, 189
- (20) Sarajedini, A. 1993, in Blue Stragglers, ASP Conf. Ser., vol. 53, ed. R. E. Saffer, p. 14
- (21) Sawyer-Hogg, H., 1973, D.D.O. Pub., Vol 3., No. 6
- (22) Yan, L. & Reid, I. N. 1996, MNRAS, 279, 751
- (23) Yanny, B., Guhathakurta, P., Schneider, D. P., & Bahcall, J. N 1994, ApJ, 435, L59
- (24)
![[Uncaptioned image]](/html/astro-ph/9711152/assets/x1.png)