Multicolour imaging of = 2 QSO hosts
Abstract
We present multicolour images of the hosts of three QSOs previously detected in -band by our group. The luminosities, colours and sizes of the hosts overlap with those of actively star-forming galaxies in the nearby Universe. Surface brightness radial profiles over the outer resolved areas roughly follow either a or an exponential law. These properties give support to the young host galaxy interpretation of the extended light around QSOs at high-redshift. The rest-frame UV and UV-optical colours are inconsistent with the hypothesis of a scattered halo of light from the active nucleus by a simple optically-thin scattering process produced by dust or hot electrons. If the UV light is indeed stellar, star formation rates of hundreds of solar masses per year are implied, an order of magnitude larger than in field galaxies at similar redshifts and above. This might indicate that the QSO phenomenon (at least the high-luminosity one) is preferentially acompanied by enhanced galactic activity at high-redshifts.
keywords:
galaxies: active – galaxies: photometry – galaxies: quasars: general1. Introduction
Recent deep-imaging studies have discovered a large population of young galaxies at redshifts , about 3% being at for (e.g. Steidel et al. 1996a). The galaxies have properties very similar to those of present day star-forming dwarf galaxies or H II galaxies, but with star formation rates SFRM⊙/yr they are not particularly luminous objects (Guzmán et al. 1997; Phillips et al. 1997). The field population of high- galaxies has been associated with early counterparts of disks (Wolfe et al. 1995), small spheroids of present-day galaxies (Steidel et al. 1996a) and/or with a collection of star-forming knots being merged into galaxies (Lowenthal et al. 1997). On the other hand, detailed studies of the intrinsic properties of nearby cluster ellipticals indicate that their stellar population was formed at (Bower, Lucey & Ellis 1992). One long standing view is that these were systems formed monolithically in an early burst of star formation (e.g. Larson 1974), and have been passively evolving since then. Thus, for a first rank elliptical we expect SFR. Several attempts to find the early counterparts of these galaxies in large areas of the sky have been conducted (see Pritchet 1994 for a review) but to date just a handful of candidates that still need spectroscopic confirmation have been found (e.g. Pahre et al. 1997). Where are these bright objects hiding? In galaxy formation models based on the hierarchical merging of dark matter halos the majority of large spheroids are formed at lower redshifts (Kauffmann, White & Guiderdoni 1993), so that the present-day large systems were previously broken-up into small fainter pieces of a yet not completely assembled whole. Although they are an attractive solution, it still needs to be demonstrated whether these models can reproduce the intrinsic properties of massive ellipticals, such as their large nuclear metal content, the thinness of the fundamental plane, the small scatter of the colour-luminosity relation, the large colour/metal gradients, etc. (but see Kauffmann & Charlot 1997 for first positive results on the colour-luminosity relation). There is also a good possibility that some large spheroids may have gone undetected as the host galaxies of bright QSOs. Two pieces of observational evidence support this hypothesis. First, a significant number of nearby bright QSOs are associated with luminous ellipticals (McLeod & Rieke 1995; Disney et al. 1996; Taylor et al. 1996). Secondly, many of the properties of high- QSOs are consistent with their association with the cores of early luminous spheroids. Among them, a) the high metal content of the Broad Line Region of high- QSOs (Hamman & Ferland 1993); b) the detection of large masses of dust in QSOs (Isaak et al. 1994); and c) the correspondence of the observed luminosity function of QSOs and ellipticals (Terlevich & Boyle 1993 , Haehnelt & Rees 1993) do suggest that QSO activity might be occurring in the central regions of young massive ellipticals.
All these points are reinforced by the recent discovery that about 5 to 20% of the luminosity of both radio-loud and radio-quiet QSOs at arises from extended structures of FWHM arcsec (Lehnert et al. 1992, Aretxaga, Boyle & Terlevich 1995, Hutchings 1995). Unraveling the nature of the extensions around QSOs at these redshifts is of major importance since they could be revealing the hidden signature of the elusive early large spheroid population.
In this paper we focus our attention on the multicolour properties of the hosts of three QSOs previously detected in -band by Aretxaga, Boyle & Terlevich (1995; hereinafter ABT95), in an attempt to characterize the emission mechanism. In section 2 we describe the dataset. In section 3 we describe the method of finding the hosts, and their analysis. In section 4 we discuss the nature of the hosts on the basis of their colours, luminosities, sizes and profiles. In section 5 we summarize our main conclusions.
2. Data set
The three QSOs studied here were previously detected to be extended in the -band imaging program of ABT95. They comprise the three extended objects in their four target list. The QSOs were originally selected from the Verón-Cetty and Verón (1994) catalogue with the only condition of belonging to a narrow redshift-luminosity band (, mag for H Km s-1 Mpc-1 and q), and lying close in projection ( arcsec) to stars of similar brightness in order to define a reliable point-spread-function (PSF). The QSOs, two radio-quiet and one radio-loud, can thus be said to be representative of the high-luminosity end of the QSO population at the epoch when QSOs were most abundant (e.g. Boyle et al. 1991).
Our observations (including those already published in ABT95) are summarized in Table 1, and detailed in sections 2.1 and 2.2.
| Name | Filter | Exposure | seeing† | Telescope | Detector | Date | ||
|---|---|---|---|---|---|---|---|---|
| (seconds) | (arcsec) | |||||||
| 1630.53749 | 2.037 | 10500 | 0.6 | WHT 4.2m | TEK1 | 1994 Aug | ||
| 4800 | 0.75 | WHT 4.2m | TEK5 | 1995 Sep | ||||
| 13320 | 1.0 | Calar Alto 3.5m | MAGIC | 1995 Aug | ||||
| PKS 2134008‡ | 1.936 | 5850 | 0.6 | WHT 4.2m | TEK1 | 1994 Aug | ||
| 4800 | 0.9 | WHT 4.2m | TEK5 | 1995 Sep | ||||
| 5220 | 1.1 | Calar Alto 3.5m | MAGIC | 1995 Aug | ||||
| Q 22440105 | 2.040 | 5400 | 0.7 | WHT 4.2m | TEK1 | 1994 Aug | ||
| 3600 | 0.9 | WHT 4.2m | TEK5 | 1995 Sep | ||||
| 3600 | 0.7 | WHT 4.2m | TEK5 | 1995 Sep | ||||
| 7670 | 1.0 | Calar Alto 3.5m | MAGIC | 1995 Aug |
∗ and from Véron–Cetty and Véron (1994).
† Stellar FWHM measured on co-added frame.
‡ radio-loud QSO
2.1. Optical Imaging
The principal optical observations in this study were performed at the f/11 Auxiliary Port of the 4.2m William Herschel Telescope (WHT111The William Herschel and the Issac Newton Telescopes are operated on the island of La Palma by the Royal Greenwich Observatory in the Spanish Observatorio del Roque de los Muchachos of the Instituto de Astrofísica de Canarias) in La Palma. The 1024x1024 pixel CCD TEK chips in this configuration give a spatial resolution of arcsec/pixel over an unvignetted arcmin diameter field. The CCD was read out in QUICK mode.
Harris -band images for all three QSOs were obtained in August 1994 under non-photometric conditions. The reduction and analysis of this data set was already discussed in ABT95, and does not differ from that performed in the present analysis. In 1995 September 3/4 we acquired Harris -band images of the three QSO fields, and a second set of -band observations for Q 22440105. The observations were also obtained under non-photometric conditions.
For each observation, the total integration time of each QSO was divided in 600s exposures to avoid saturation of the QSOs and stars. Individual frames were offset from one another by arcsec to allow discrimination of bad pixels.
The data were reduced with the IRAF222IRAF is distributed by the National Optical Astronomy Observatories, which are operated by the Association of Universities for Research in Astronomy, Inc., under cooperative agreement with the National Science Fundation software package. Each QSO frame was first bias subtracted and then flat-fielded using a sky flat-field. The sky-flat field was computed for each night from the median of the frames of all QSO fields, after bright stars, galaxies and QSOs had been masked from the data.
Photometric zero-points for the and band data on the fields around 1630.53749 and PKS 2134008 were obtained based on observations made with the 2.5m Issac Newton Telescope (INT⋆) during service time on 1996 September 19. Magnitudes were calculated through circular apertures which reached the asymptotic value of the circular aperture growth, typically about 3 to 4 arcsec in radius.
2.2. Near-infrared Imaging
The near-infrared imaging was conducted at the 3.5m telescope of the German-Spanish Astronomical Center on Calar Alto 333The German-Spanish Astronomical Center on Calar Alto is operated by the Max-Plack-Institute for Astronomy, Heidelberg, jointly with the Spanish National Comission for Astronomy with MAGIC, the 256x256 pixel NICMOS3 CCD array. The f/10 configuration in high-resolution mode gives a spatial resolution of 0.32 arcsec/pixel over a square 82x82 arcsec field. The chip was read out in the standard reset.read.read mode.
On 1995 August 5/6/7 we obtained images of the three QSO fields under photometric conditions The total integration times for the QSO fields were split into 2s units to avoid sky saturation, and stacked in 1 min frames. As with the optical imaging, individual frames were offset from one another by arcsec, making sure that both QSOs and nearby PSF stars were included in the field-of-view of the detector.
The data were reduced with the IRAF software package. Sky and dark-current were subtracted in each frame using the median of six unregistered frames of the same field obtained just before and after each observation, and scaled up to the mean value of source-free patches of the sky. The frames were then flat-fielded using a dark-current corrected exposure of the uniformly illuminated dome. Each QSO field was co-registered and co-added using the centroids of the brightest stars and QSOs. Flux calibration was performed through a set of standard stars from the list of Elias et al. (1982) throughout the nights. Integrated magnitudes for all the objects were obtained through circular aperture photometry that reached the asymptotic values of the circular aperture growth.
2.3. Near-infrared Spectroscopy
A 5 min integration spectrum of PKS 2134008 and a 10 min integration spectrum of Q 22440105 were also obtained for our program during service time with the CGS4 spectrograph at the 3.8m UK Infrared Telescope (UKIRT444The United Kingdom Infrared Telescope is operated by the Joint Astronomy Center on behalf of the UK Particle Physics and Astronomy Research Council) on Mauna Kea. The observations were acquired with spectral resolution R=550 and spectral coverage 1.45–2.05, in order to contain the rest-frame [O III]5007 Å to H region. The spectra were flux and wavelength calibrated at the observatory following their standard procedures.
3. Data analysis
3.1. Optical Imaging
3.1.1. PSF subtraction
The procedure used to fit and subtract the stellar PSF from the images was described in ABT95 in detail. Briefly, it involved the definition of a two-dimensional PSF from the brightest stellar companion to the QSO (marked in Fig. 1 of ABT95), and the subtraction of the 2D-profile from the QSO and nearby stars, following three recipes: (1) flux-scaled subtraction; (2) subtraction that yields zero flux in the center of the QSO; (3) subtraction that yields a smooth flat-top profile with no depression in the center. Criteria (2) and (3) were evaluated for each frame after smoothing the residuals of the subtraction with a Gaussian filter of pixel. This procedure provided stability to the solution found from frame to frame. The frames were then registered and co-added using the centroids of stars and QSOs in the original unsubtracted frames. Only non-smoothed frames were used in the co-addition.

Flux-scaled subtraction typically produces solutions with negative flux in the center, defined as the centroid of the original QSO position, surrounded by a ring of positive flux (see Fig. 1a). For the three QSOs the flux-scaled PSF subtraction is a solution that is inconsistent with QSOs and PSF stars having the same spatial profiles. The QSO residuals left after the QSOPSF subtraction depart from the subtraction error () by over in both and -band images, with the only exception being the -band image of Q 22440105 (). As a check, bright nearby PSF-subtracted stars leave residuals around (see also Figure 2 in ABT95 for a graphic comparison of stellar and QSO residuals in the -band frames).
Fig. 1b and 1c show typical radial profiles for the two other subtraction criteria. These will be regarded as a lower limit and a good approximation to the actual profile of the hosts.
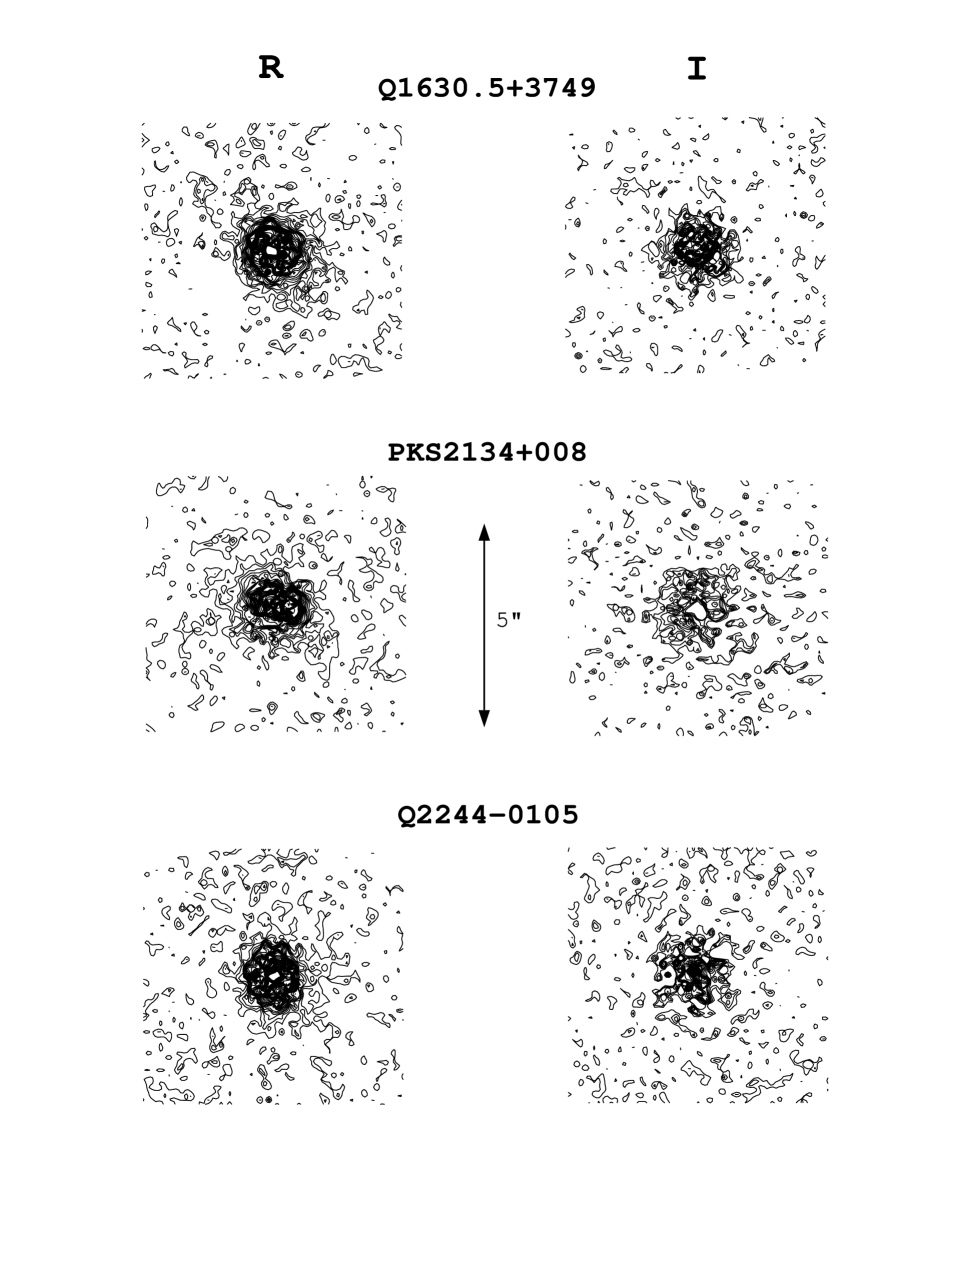
Fig. 2 shows contour plots of the central-zero-flux subtraction solutions. The putative hosts are roundish and show no obvious signs of disrupted morphologies for our limiting PSF-subtraction backgrounds ( to 25.5 mag, to 23.5 mag at per pixel, evaluated from the sky in the PSF-subtracted area around the QSOs).
3.1.2. Accuracy of PSF subtractions
To assess the accuracy of the PSF subtractions and estimate the errors on the derived properties of the hosts, we have constructed a set of simulated QSOs by superposing observed stellar PSFs on compact faint field galaxies and also on compact simulated galaxies (FWHM arcsec). The simulated galaxies were introduced in our images with the package ARTDAT of IRAF with the same Poissonian noise as that of the observations. Nuclear components using PSF models derived from field stars and containing 90, 95, 97, and 99 per cent of the total luminosity of the simulated QSOs were superposed on the galaxies, and the PSF subtraction was then attempted with the same PSF models. The results for two of these galaxies are shown in Fig. 3.
As one would assume intuitively, the simulations show that the larger the size and the larger the contribution of the host to the total luminosity of the QSO, the easier it is to recover its true luminosity, radius and profile. The simulations also show that flat-top subtractions tend to underestimate the total luminosity of the hosts. This effect is actually introduced by design through the smoothing performed in order to evaluate whether a flat regime had been attained. This shows that although flat-top PSF subtractions yield better estimates for the host properties than central-zero-flux subtractions, they are still conservative. The biggest departures from the true profiles (about a factor of 2) are expected in the inner stellar FWHM scale for the range of galaxy compactness explored. These discrepancies will be even greater for even more compact galaxies. As an example, from the circular aperture curves of growth of the most compact galaxies in our simulations (FWHM arcsec), we derive that the flux of the hosts can be measured within better than a factor of 2 if the host contribution is between 1 and 5 per cent of the total QSO luminosity, and increasingly better for larger luminosities and sizes. The effective radii of the hosts can be derived with relative errors between 20 and 10 per cent, for contributions of the galaxy between 3 and 5 per cent of the QSO luminosity.

3.1.3. Properties of the hosts
Integrated magnitudes, effective radii, and radial profiles of the flat-top PSF subtracted hosts were computed. The results are summarized in Table 2 and Fig. 4.

| Name | Filter | (QSO) | seeing | |||
| (mag) | (mag) | (mag) | (arcsec) | (arcsec) | ||
| 1630.53749 | 22.0 | 21.3 | 0.9 | 0.6 | ||
| 20.6 | 20.2 | 1.0 | 0.75 | |||
| PKS 2134008 | 20.8 | 20.2 | 0.95 | 0.6 | ||
| 19.7 | 19.4 | 1.2 | 0.9 | |||
| Q 22440105 | (QSO) | (QSO) | 0.8 | 0.7 | ||
| — | (QSO) | (QSO) | 1.0 | 0.7 |
† Flux calibration based on APM Northern Sky Catalogue.
| Name | Colour | colour(AGN) | colour(host)1 | colour(host)2 |
| (mag) | (mag) | (mag) | ||
| 1630.53749 | ||||
| — | ||||
| PKS 2134008 | ||||
| — | ||||
| Q 22440105 | — | — | — | |
| — |
The magnitudes of the QSO systems (i.e. nuclear host light) are calibrated using our own observations, except for the -band image of Q 22440105, which was calibrated using the crude zero-points of ABT95 based on the APM Northern Sky Catalogue (Irwin, Maddox & McMahon 1994). The difference between these zero-points and our calibration for the objects in the other two QSO fields is within the error bars of both measurements, but our new calibration is typically 0.4 mag fainter.
Flat-top PSF subtractions yield hosts that comprise between 5 and 12 per cent of the total luminosity of the QSOhost systems.
Table 3 contains the colours of the nuclei and host galaxies. The colours of 1630.53749 ( mag) and PKS 2134008 () are within the range of observed colours of QSOs at that redshift (Véron & Hawkins 1995). These colours are somewhat bluer than those derived for the hosts: mag and mag, respectively. However, the errors associated with the PSF subtraction are usually larger than the calibration errors, and could easily account for this discrepancy between QSO and host colours. In order to obtain a more reliable value of the colours of the hosts, we have integrated the total luminosity enclosed between two concentric circular apertures of radius 0.7 arcsec and 3 arcsec. The outer aperture reaches the plateau of the aperture growth curves, and the inner one neglects the part of the hosts more affected by subtraction errors (see Fig.3). For the host of 1630.53749 we find and for that of PKS 2134008 , redder by 0.24 and 0.51 mag, respectively, than the total light of the QSOs. The colours remain similar within rms fluctuations of 0.15 and 0.06 mag respectively when the inner aperture is set from 0.7 arcsec to 1 arcsec, indicating that the outermost regions of the hosts of PKS 2134008 and 1630.53749 are redder than their nuclei.
3.2. Infrared Imaging
A two-dimensional PSF subtraction technique similar to that described above for the optical images was also performed in the infrared frames. The only difference is that the individual frames were registered and co-added before performing the subtraction. The residuals left in the QSO positions were in all cases negligible.
Radial profile comparison of QSOs and PSF stars in the field show that the differences between them are indeed small, and located in the outermost regions, where the sky subtraction is critical. Fig. 5 shows the radial profiles normalized to the first computed ring at 0.32 arcsec for QSOs and stars. Only 1630.53749 has a marginal excess above the stellar profile at 2 to 4 arcsec from the center. The excess does not disappear even after allowance for shifts in the sky level.
The colours of the QSOs 1630.53749 ( mag), PKS 2134008 ( mag) and Q 22440105 ( mag) are similar to those measured in other QSOs at these redshifts (Hewett, priv. communication). If we assume that the excess present in 1630.53749 is real, the surface brightness colour over the 2–3 arcsec region is mag, redder by about 0.8 mag than the observed colour of the QSO.
The surface brightness limits for the -band images are between 22.1 and 21.8 mag/arcsec2 at per pixel. The limits for detections of point-like objects with a typical seeing-disk range between 20.8 and 21.1 mag. These limits are similar to those obtained in a previous -band imaging program of radio-quiet QSOs at that yielded non-detections (Lowenthal et al. 1995).
From the -band limits we can set the colours of the hosts of PKS 2134008 and Q 22440105 to be mag, consistent with those of the unresolved nuclear light.

4. Discussion: the nature of the hosts
The hosts we have detected have luminosities that contribute between 5 and 12% of the luminosity of the QSOs (nucleusextension) both in and -bands (2300 Å and 2800 Å rest-frame). If the marginal excess over the stellar profile of 1630.53749 is real, the -band (7600 Å rest-frame) luminosity of the host as derived from the measured colours would also contribute to the total -band QSO luminosity about 5%. Our measurements indicate large and luminous extended systems ( Kpc, to 22 mag). We will consider three alternative explanations for their nature: scattered light from the active nucleus, nebular continuum produced by the gas ionized by the active nucleus, and stellar light.
4.1. Scattering
The large structures detected in high-redshift radio-galaxies (e.g. Chambers et al. 1987) have been attributed to light scattered from the active nucleus by a powerful transverse radio-jet (e.g. Fabian 1989). Indeed, recent spectro-polarimetry of two radio-galaxies that exhibit ’alignment effects’ (optical structures oriented in the direction of the radio-jet) indicates that around 80% of the total UV continuum emission at rest-frame 2800 Å is non-stellar scattered light (Cimatti et al. 1997). Since radio-galaxies and radio-loud QSOs could be identical objects viewed from different angles (Barthel 1989), an important amount of scattered light may be present around radio-loud nuclei (see Fosbury 1997 for a detailed discussion).
The host of the core-dominated radio-loud QSO studied in this paper, PKS 2134008, has an colour that is 0.52 mag redder than the nucleus. This argues against the simple optically-thin scattering case, which would yield colours as blue as or bluer than the nucleus itself. The limits for this host ( mag) are not deep enough to probe the optically-thin scattering case value. Note that four of the six lobe-dominated radio-loud QSOs at studied by Lehnert et al. (1992) have hosts with colours redder than the nuclei. However the (or ) analysis discriminates poorly the origin of the light below the 4000 Å break, since scattered light would contribute predominantly in -band (rest frame 1400 Å) and stellar light would contribute predominantly in -band (rest-frame 7300 Å) (e.g. Fosbury 1997).
The host of our radio-quiet QSO with calibrated photometry, 1630.53749, exhibits the same general properties, with colours 0.25 and 0.8 mag redder than the nucleus in and , respectively. These colours are inconsistent with the optically-thin scattering case as an explanation for the UV hosts of our QSOs. An optically-thick medium should be invoked in order to produce colours redder than those of the scattered source, but then the geometry of the scatterers should not be symmetrical since we still see the blue colours of the nucleus itself. This could be an alternative mechanism for the origin of the extended light in our sample, although there is no evidence in general for asymmetric scattering in radio-quiet QSOs.
4.2. Nebular light
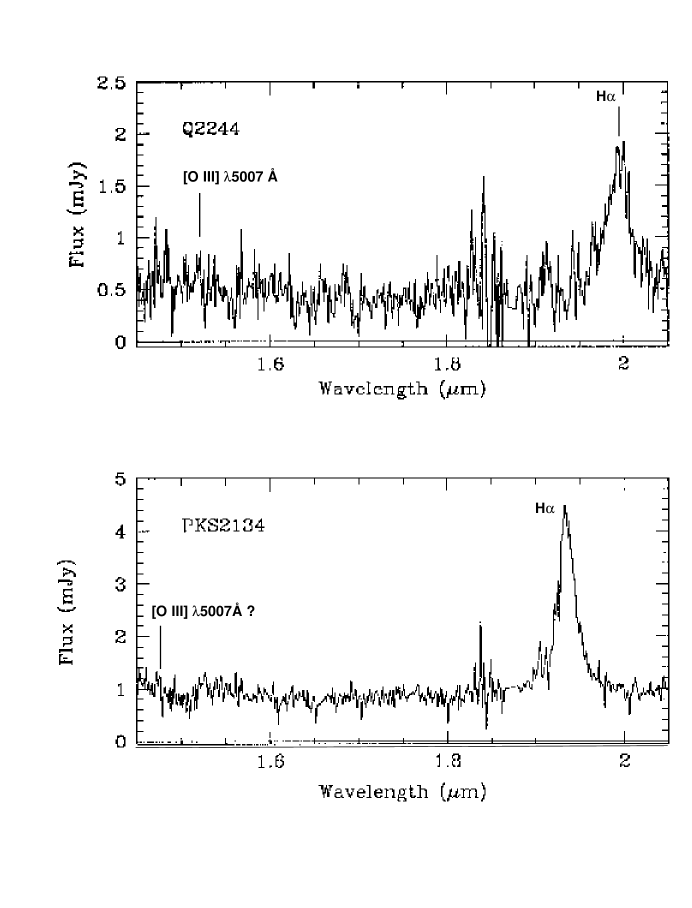
In ABT95 we argued that nebular continuum produced by an extended narrow line region around the active nucleus was unlikely to be the origin of the hosts we have detected, the reason being that the expected narrow emission lines should be very prominent in that case, with peak intensities of the Balmer lines more than 3 times larger than those of the broad lines. We have since then acquired near-IR spectra of two of the QSOs studied here (see Fig.6) which show prominent broad H lines, but no prominent narrow components. Note that even [O III]5007 Å, marked in the figure, is marginally detected at best
4.3. Stellar light
Stellar light remains still the most plausible interpretation for the extended light we have detected. The colours, sizes, luminosities and radial profiles are indeed in agreement with those expected from young stellar populations:
a) The colours of the hosts, mag for 1630.53749 and for PKS 2134008 and Q 22440105, are not consistent with the colours predicted from a simple passively evolved stellar population, usually assumed to be characteristic of elliptical galaxies. Bressan, Chiosi & Fagotto (1994), for instance, calculate that a passively-evolved stellar population for a elliptical galaxy be mag and slightly bluer for a mild amount of activity. Younger populations are necessary in order to account for the blue colours observed in our hosts. As an example, typical nearby H II galaxies set at would have colours as blue as , as derived from their characteristic flat spectral energy distributions (SED): , with .
b) and c) The luminosities and radii of our hosts lie along the luminosity–radius relationship of the local young H II galaxies (Telles, Melnick & Terlevich 1997). In Fig. 7 we converted the UV luminosities of the hosts (observed -band) to rest-frame -band using the SED of local H II galaxies. This is equivalent to converting the -band luminosities of the local sample of H II galaxies to rest-frame 2300 Å, and then comparing them with those of the hosts. Note that there is at least one local H II galaxy that is as big and luminous as our hosts.

d) The radial profiles of the -band hosts, derived from the flat-top solutions, fall approximately as -laws or exponential profiles for radii arcsec (Fig. 8). Profiles derived for radii smaller than the FWHM of the observations are usually unreliably recovered by flat-top subtractions, as shown by our numerical simulations of galaxyPSF (see section 3.1.2). Distinguishing between different morphologies is a hopeless task at these redshifts since the discrimination between disks and bulges is most efficiently carried out in the the inner part of the profiles, where our data are unreliable. The point we want to illustrate with Fig. 8 is that the morphology of the hosts is not definitely different from that of smooth local galaxies, at least in the outer regions.

5. Conclusions
We have shown that the hosts of high-luminosity radio-quiet and radio-loud QSOs are large and luminous, rivaling the most luminous nearby star forming galaxies. Colours, sizes, luminosities and radial profiles are compatible with the interpretation of the extended light as a young galaxy. If all the UV luminosity is coming from a stellar population, the implied star formation rates (in the continuous star formation case) are SFR M⊙/yr on scales of Kpc. These values are about an order of magnitude higher than those derived for field galaxies at similar redshifts found by Lyman Break searches in the Hubble Deep Field (Steidel et al. 1996b, Lowenthal et al. 1997). At , an unevolved galaxy with SED typical of a star-forming galaxy would appear to be about 3 mag fainter than the hosts we have detected. The density of high-luminosity QSOs ( mag) at redshifts between (Boyle et al. 1991) is about 10 Gpc-3. This means that the density of large luminous galaxies like the ones considered here should be about 8 Gpc-3 at , taking into account the non-detection case of ABT95 and the relative under-abundance of radio-loud QSOs, which form less than 10% of the QSO population.
While these results are intriguing, it is still possible that other sources such as nebular light and scattering may contribute to the observed extensions. However, the absence of prominent narrow emission lines in the spectra of these QSOs argues against a major contribution by the nebular continuum emitted by an extended narrow line region. The optically-thin scattering hypothesis is furthermore ruled out as a major mechanism by redder UV and UV-optical colours than those of the active nuclei. The optically-thick scattering case is still an open possibility, especially in radio-loud hosts, where a role for scattering has already been invoked. High spatial resolution spectroscopic observations of the extended light is probably the simplest and most direct way to assess the contribution of all those different mechanisms into the UV luminosities we have measured. This is an important project in order to reliably prove and measure the contribution of massive star-formation in QSO hosts.
The study of the hosts of less luminous QSOs, especially those which populate the break of the QSO luminosity function, is also of major importance, in order to assess the association of large luminous galaxies and the majority of QSOs at the QSO epoch.
Acknowledgments
We thank Eugene Churazov, Robert Fosbury and Simon White for useful discussions, and James Lowenthal for also providing comments on an early draft of this paper. We thank Tom Geballe and Sandy Leggett of the UKIRT service-time team for tenaciously tracing down the IR spectra in the archives after we lost them in a disk crash. This work was supported in part by the ‘Formation and Evolution of Galaxies’ network set up by the European Commission under contract ERB FMRX-CT96-086 of its TMR programme.
References
- [1] Aretxaga I., Boyle B.J., Terlevich R.J., 1995, MNRAS, 275,L27 (ABT95)
- [2] Barthel P.D. , 1989, ApJ, 336,606
- [3] Bower R.G., Lucey J. & Ellis R.S., 1992, MNRAS, 254, 601
- [4] Boyle B.J., Jones L. R., Shanks T., Marano, Zitelli V., Zamorani G., 1991, ‘The Space Distribution of Quasars’, ed. Crampton, ASP Conf. Ser., 21, p.191.
- [5] Bressan et al. 1994, ApJS, 94,63.
- [6] Chambers K., Miley G. & van Breugel W., 1987, Nat, 329, 604.
- [7] Cimatti A., Dey A., van Breugel W., Hurt T., Antonucci R., 1997, ApJ, 476,677
- [8] Disney M.J., Boyce P.J., Blades J.C. et al. 1996, Nat, 376, 150.
- [9] Elias J.H., Frogel J.A., Matthews K., Neugebauer G., 1982, AJ, 87,1029
- [10] Fabian A.C., 1989, MNRAS, 238, 41P.
- [11] Fosbury R. 1997. in ‘QSO Hosts’, ed. Clemens et al., ESO Conf Ser., in press.
- [12] Guzmán R., Gallego J., Koo D.C., Phillips A.C., Lowenthal J.D., Vogt N.P., Faber S.M., Illingworth G.D. 1997, ApJ, in press.
- [13] Haehnelt M.G. & Rees, M., 1993, MNRAS, 263,168.
- [14] Hamann F., Ferland G., 1993, ApJ, 418, 11
- [15] Hutchings J. 1995 AJ, 110, 994.
- [16] Irwin M.J., Maddox S., McMahon R.G., 1994, Spectrum, 2,14
- [17] Isaak K. G., McMahon, R.G., Hills, R.E., Withington, S. 1994, MNRAS,269, 28
- [18] Kauffman G.A.M., White S.D.M., Guiderdoni B., 1993, MNRAS, 264,201.
- [19] Kauffman G.A.M. & Charlot S., 1997, MNRAS, submitted
- [20] Landolt A.U., 1991, AJ, 104,340
- [21] Larson R.B. 1974, MNRAS, 166, 585
- [22] Lehnert M.D, Heckman T., Chambers K.C. & Miley G.K., 1992, ApJ, 393, 68.
- [23] Lowenthal J.D., Heckman T.M., Lehnert M.D. & Elias J.H., 1995, ApJ, 439, 588.
- [24] Lowenthal J.D., Koo D.C., Guzman R., Gallego J. Phillips A.C., Faber S.M., Vogt N.P., Illingworth G.D., Gronwall C., 1997, ApJ, 481,673
- [25] McLeod K.K. & Rieke G.H. 1995, ApJ, 454, L77.
- [26] Pahre M.A., Djorgovsi S.G., Bechtold J., Elson R. 1997, in ‘Young Galaxies and QSO absorvers’ eds. Viegas et al., ASP Conf. Ser.
- [27] Phillips A.C., Guzman R., Gallego J., Koo D.C., Lowenthal J.D., Vogt N.P., Faber S.M., Illinworth G.D. 1997, ApJ, in press.
- [28] Pritchet C.J. 1994, PASP, 106, 1052.
- [29] Steidel C.C. et al. 1996a, ApJ, 462, L17
- [30] Steidel C.C., Giavalisco M., Dickinson M., & Adelberger K.L., 1996b, ApJ, 112,352
- [31] Taylor G.L., Dublop J.S., Hughes D.H., Robson E.I. 1996, MNRAS, 283,930.
- [32] Telles E., Melnick J. & Terlevich R.J., 1997,MNRAS, in press
- [33] Terlevich R. & Boyle 1993, MNRAS, 262, 491
- [34] Véron-Cetty M.-P. & Véron P. 1994. A Catalogue of Quasars and Active Galactic Nuclei. ESO.
- [35] Véron P. & Hawkins M.R.S.1995. A&A 296, 665.
- [36] Wolfe et al. 1995, ApJ, 454, 698.