11 (11.06.1; 11.17.2; 11.17.4: BRI 1335-0415) 12 (12.03.3;12.05.1) 13 (13.19.1) 11institutetext: IRAM, 300 rue de la Piscine, F-38406 Saint Martin d’Hères Cedex 22institutetext: Institut d’Astrophysique de Paris, CNRS, 98bis Bd Arago, F-75014 Paris 33institutetext: Institute of Astronomy, Madingley Road, Cambridge CB3 0HA, U.K. 44institutetext: Institut d’Astrophysique Spatiale, Université Paris 11, F-91406 Orsay Cedex \offprintsS.Guilloteau; email:guillote@iram.fr
The second detection of CO at redshift larger than 4
Abstract
We report the detection with the IRAM interferometer at 3 mm of J=5-4 CO line in the radio quiet quasar BRI 1335-0415 at redshift of . After BR 1202-0725 at (Ohta et al 1996, Omont et al 1996a), this is the second detection of CO at . The integrated line intensity is Jy km s-1 with a linewidth of 42060 km s-1. The dust continuum emission has also been mapped at 1.35 mm. The 1.35 mm flux is found to be 5.61.1 mJy. The ratio of the CO to 1.35 mm continuum flux is slightly larger than for BR 1202-0725. Contrary to the case of BR 1202-0725, there is only marginal evidence of extension of the 1.35 mm continuum and 3mm CO emission. In the absence of gravitational lensing, for which there is no a priori evidence, and within the uncertainties of the CO to M(H2) conversion factors, the mass of molecular gas M(H2) could be M⊙.
keywords:
Galaxies: formation – quasars: emission lines – quasars: BRI 1335-0415 – Cosmology: observations – Cosmology: early universe – Radio lines: galaxies1 Introduction
The detection of CO and dust at millimeter wavelength in a few prominent objects at very large redshift opens the possibility to study the molecular gas of the primordial starbursts of galaxies. The initial detection of CO in FIRAS10214+4724 at (Brown and Vanden Bout 1992, Solomon et al 1992), followed by CO detections in H1413+117 (The Cloverleaf) at (Barvainis et al 1994), BR 1202-0725 at (Ohta et al 1996, Omont et al 1996a) and, recently, in 53W002 at (Scoville et al 1997). In addition thermal emission has now been convincingly detected at 1.3 mm in 8 QSOs (Barvainis et al 1992; McMahon et al 1994, Isaak et al 1994, Ivison, 1995, Omont et al 1996b) and in one radiogalaxy at (Dunlop et al 1992, Chini & Krügel 1994; Hughes et al 1997).
Such a jump in the redshift range of millimeter radioastronomy was made possible by : i) the existence at larger redshifts of extraordinary objects with molecular gas, dust and huge starbursts similar to the most powerful ultra-luminous IRAS galaxies; ii) the large increase of dust and CO luminosities with redshift when observed at fixed wavelength; iii) the existence of a spectacular gravitational lensing amplification in the two prominent cases of FIRAS10214+4724 and H1413+117. However, since some tentative detections of quasars and quasar absorption line systems have not been confirmed (Wiklind & Combes, 1994; Braine, Downes & Guilloteau, 1996), the number of detections of CO at remains small, consisting of the four detections previously mentioned. It is important to extend the number of CO detections at large redshift so that we can study more systematically: the nature of these sources, the properties of and the relative amount of molecular gas and dust, the spatial distribution of CO and dust, the role of gravitational amplification, and the spatial extension of their millimeter emission (e.g. is the extension observed in BR 1202-0725 unique ?)
In order to address these issues, we have adopted the following strategy: i) search for dust emission toward radio-quiet quasars at very high redshift in the millimeter or submillimeter ranges using single dish telescopes; ii) for the sources detected, systematically search for CO and map the continuum with the IRAM interferometer. Among the detections reported by Omont et al (1996b), the most obvious candidate to search for CO with the interferometer was BRI 1335-0415, an optically selected QSO from the APM multicolour quasar survey (Irwin et al 1991, Storrie-Lombardi et al 1996). It is the second source with with the strongest 1.3mm dust emission after BR 1202-0725 (Omont et al 1996b). We report in this letter the detection of CO(5-4) in BRI 1335-0415 with an intensity comparable to that of BR 1202-0725.
2 The redshift of BRI 1335-0415
Because of the relatively small instantaneous bandwidth of available heterodyne receivers (500 MHz at 105 GHz, i.e. 1400 km s-1 or at , a prerequisite for CO observations is a precise determination of the the redshift of the target object.
In the case of high redshift quasars the redshifts have to be determined from rest frame ultra-violet emission lines (e.g. Ly-:1216Å, Cv:1549Å) with widths of 10,000 km s-1. Moreover, it is well established that the above high ionization lines show systematic differences when compared with redshifts derived from lower ionization lines (Carswell et al 1991, Tytler & Fan 1992). Espey et al (1990) give a mean redshift difference of 1000 km s-1 in quasars. Of particular relevance to this work, Storrie-Lombardi et al (1996) find 43060 km s-1 for the APM sample of quasars. The error quoted above is the uncertainty in the mean and the actual dispersion(1) about the above value is 1260 km s-1.
We have made an independent redetermination of the redshift of BRI 13350415 using the same data as Storrie-Lombardi et al (1996). The C iv line gives and the Si iv line , while the low ionisation lines O i and C ii give and 4.426, respectively. However, the O i and C ii measurements are certainly not as reliable as the Si iv and C iv ones, as the former lines are quite weak. Therefore, from the emission lines, one can just estimate that the redshift should lie in the broad range 4.370–4.426.
However, as in the case of BR 1202-0725 (Isaak et al 1994) another indication can be derived from the absorption lines at redshifts close to that of the quasar. On the line of sight of BRI 1335-0415, there is a Lyman limit system (LLS) quite close to the quasar redshift (Storrie-Lombardi et al 1994, 1996) with an estimated H i column density of the order of 1018 cm-2 Its redshift can be established from the presence of the C ii and Si ii lines detected at and 4.406, respectively. There is no doubt that these lines are due to the LLS. In addition, there is a strong Ly line at Å, i.e. . These facts confirm that the LLS is at . This value can appear as one of the best guess for an approximate value of the redshift of the quasar. Lyman-limit absorption systems so close to the redshift of the quasar are rare and only occur within 4000 km s-1 in 2 of 15 quasar sight lines studied by Storrie-Lombardi et al (1996).
3 Observations
Observations were made with the IRAM interferometer between May 1996 and March 1997. We used the standard CD configuration, which gives a beam of at PA 24∘ at 1.35 mm and at 3 mm. Dual frequency receivers were used to search simultaneously for CO(5-4) emission at 3mm and dust emission at 1.35 mm. Two different tunings, separated by 450 MHz, were used at 3 mm, at 107.020 GHz and 106.570 GHz to provide wide velocity coverage. The 3 mm receivers were tuned in single sideband and the 1.35 mm receivers in double sideband (at 223 GHz LSB and 226 GHz USB). Typical SSB system temperature were K at 3 mm and K at 1.35 mm. Amplitude and phase calibration were done using 3C273, whose flux raised from 19 to 23 Jy at 106 GHz, and 15 to 19 Jy at 224 GHz during that period. Flux density scale is accurate to better than 10%. Phase noise was below 30∘ on all baselines even at 1.35 mm. The final results are presented in Figs.1-3. The total integration time is about 10 hours for the CO(5–4) line, and 18 hours for the 1.35 mm continuum.
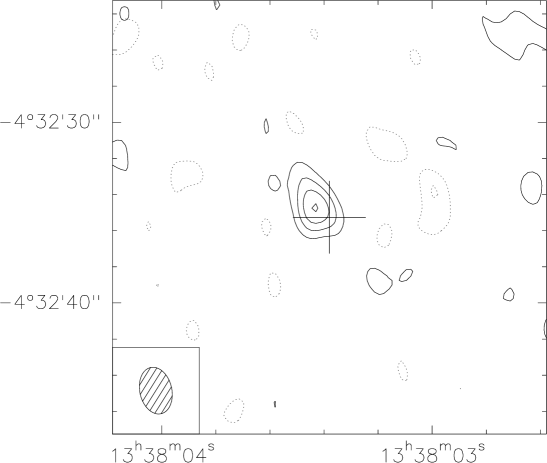

At 1.35 mm, we detected a total flux of mJy (Fig. 1). The continuum source position is offset by () from the optical position (RA Dec J2000.0), well within the astrometric uncertainty of both measurements. The source appears only marginally resolved, with a formal gaussian size of . This could be purely a seeing effect.
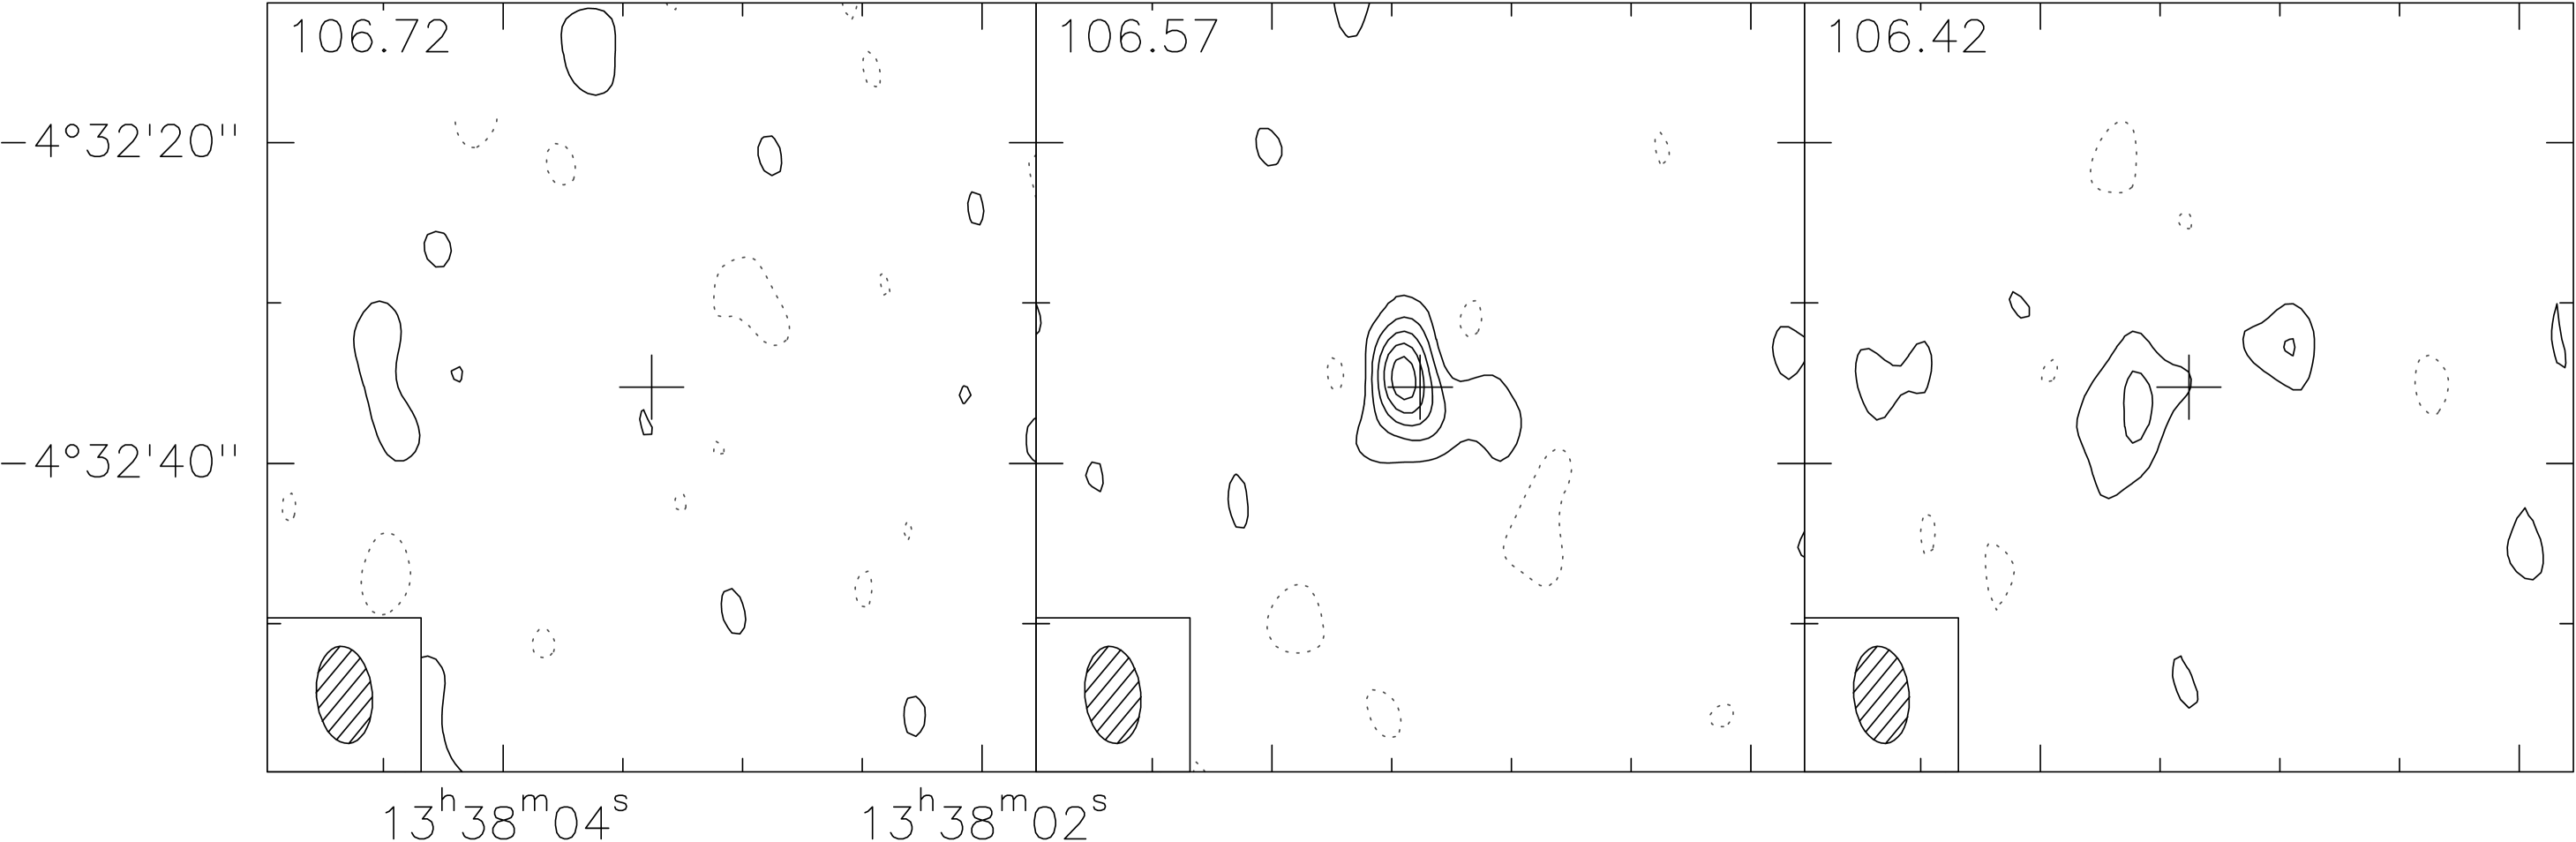
While the setting at 107.020 GHz only yields an upper limit of 1.2 mJy (3 ) on the 3 mm continuum, the CO(5-4) line (=576.2677 GHz) is clearly detected towards the position of the continuum emission. The CO(5–4) line is found at a frequency of 106.570 GHz, corresponding to a redshift of . The spectrum is displayed in Fig. 2, and maps over 150 MHz wide channels are shown in Fig. 3. The integrated line flux is Jy km s-1 with a line width of km s-1.
The broad channel maps of the CO(5–4) line (Fig. 3) show marginal evidence for extension and/or position shift with velocity. The first contour (2 levels) is clearly extended in the central channel centered at 106.57 GHz, whereas the 2 contour is seen towards the east in the channel at 106.42 GHz. In both channels, the emission extends about one beam away from the peak emission. However, it is difficult to decide with the present signal to noise ratio whether this result is really significant.
4 Discussion.
There is no doubt about the reality of the CO detection in BRI 1335-0415: the signal-to-noise ratio is high, especially on the integrated intensity. The profile, as well as the baseline, is very well behaved. The coincidence with the QSO position and the absence of signal elsewhere (Fig.3) further strengthens the reality of the detection. The lack of pure continuum emission when all the 3-mm broad band measurements, except in the line frequency range, are included, indicates that the detected 3mm emission comes from a spectral line (Fig.2). The width of 420 km s-1 is in the range of, although slightly larger than, the values observed for other high–redshift sources : 200-350 km s-1 for BR 1202-0725 (Omont et al 1996a), 220 km s-1 in F10214+4724 (Solomon et al 1992), 330 km s-1 in H1413+117 (Barvainis et al 1994), from 150 to 550 km s-1 for a sample of 37 ultraluminous galaxies (Solomon et al 1997).
The derived redshift for the molecular gas is just in the redshift range derived from optical emission lines, in the upper part as expected, close to the low ionisation lines. Indeed, it is practically coincident with the redshift of the Lyman limit absorption system (LLS). It will be important to obtain a better redshift for this Lyman limit system to see if the redshift agrees more closely with the CO.
The integrated CO intensity of BRI 1335-0415 (2.8 Jy km s-1) is slightly stronger than for BR 1202-0725 (2.4 Jy km s-1) which is at a similar redshift. As in other sources (see, e.g., Omont et al 1996a), several approximations are required to estimate the mass of molecular hydrogen in BRI 1335-0415 from the CO intensity. Assuming a relatively high rotational temperature demonstrated in other sources by the CO line ratios, and using the same conversion factor as in Omont et al (1996a) for the mass of molecular hydrogen from the (5-4) line luminosity (see Solomon et al 1992), we obtain where h = Ho/100 km s-1 Mpc-1 and adopting qo = 0.5 . This is similar to the value derived for BR 1202-0725 in Omont et al (1996a). However, this H2 mass could be overestimated as in the case of ultraluminous IR galaxies with comparable CO luminosities where the H2 masses, derived as above, are too high by a factor 3 (Solomon et al 1997, Downes et al 1993).
The measured total continuum flux at 1.35 mm ( mJy), is consistent with the value measured at an effective wavelength of 1.25 mm at the IRAM 30–m with the bolometer receivers ( mJy), when the high spectral index (3.5–4) of the thermal dust emission is taken into account. However, it is strange that the ratio of the 1.35 mm fluxes of BR 1202-0725 and BRI 1335-0415 as measured with the interferometer (Omont et al 1996a and this paper) is 2.80.4, while the ratio of the 1.25 mm fluxes measured with the 30–m telescope is 1.20.2 (Omont et al 1996b). It is important to understand why there is such a difference. Differences in the dust temperature or a range in the dust to molecular gas ratio are two possibilites that can be addressed by further observations. Finally, although the present 30–m and interferometer values for the continuum flux of BRI 1335-0415 are consistent, the smaller flux measured with the interferometer could indicate that the interferometric observations miss a weak extended component of the emission.
In several other aspects, BRI 1335-0415 appears notably different from other high sources, and especially from BR 1202-0725. First there is no evidence for a large extension of the 1.35 mm continuum emission with respect to the 2′′ beam (Fig. 1), while in BR 1202-0725 there is another strong component 4′′ away from the QSO. A priori, in BRI 13350415 there is no indication of gravitational lensing as is clearly the case for F10214+4724 and H1413+117. Second, the line of sight of BRI 1335-0415 also appears less rich in absorption systems than BR 1202-0725. Storrie-Lombardi et al (1996) report 10 unique intervening redshift systems in BR 1202-0725 whereas in the case of the BRI 13350415 they report only 2 such systems, i.e. the Lyman-limit system discussed above and a strong Mg ii/Fe ii system at .
5 Conclusion
With a CO intensity comparable to that of BR 1202-0725, BRI 1335-0415 is another exceptional object at redshift larger than 4. If the absence of strong gravitational magnification is firmly established, it could have one of the largest mass of molecular gas known, M⊙. Such a large mass of molecular gas probably indicates a huge starburst, possibly associated to the formation of the core of an elliptical galaxy or bulge of a massive spiral galaxy. The coincidence of the redshifts shows that the CO emission and the Lyman limit absorption system may pertain to the same object, possibly the host galaxy of the QSO. If so a more detailed chemical analysis of the absorption line system would be very interesting since it would allow a determination of the metallicity of the interstellar medium in this quasar’s host galaxy.
Contrary to BR 1202-0725, neither the 1.35 mm emission, nor the CO emission display a strong extension at a scale of several arcseconds. However, there is an indication of a weak extension of the CO emission which should be confirmed. It would also be interesting to further compare the continuum 1.3 mm continuum flux measured with the IRAM 30–m telescope and interferometer. Although the present values are consistent, it is not excluded that the smaller flux measured with the interferometer could indicate that it misses a weak extended component of the emission. It will also be important to understand why the ratio of the CO intensity to the 1.35 mm interferometer flux is three times larger in BRI 1335-0715 than in BR 1202-0725.
Acknowledgements.
This work was carried out in the context of EARA, a European Association for Research in Astronomy. RGM thanks the Royal Society for support. We are grateful to the IRAM staff at Bure for its efficient assistance.References
- [] Barvainis R., Antonucci R., Coleman P., 1992, ApJ, 353, 41
- [] Barvainis, R., Tacconi, L., Antonucci, R., Alloin D., Coleman, P., 1994, Nature 371, 586
- [] Braine, J., Downes, D., Guilloteau, S., 1996, A&A 309, L43
- [] Brown, R.L., Vanden Bout, P.A., 1992, ApJ 392, L11
- [] Carswell, R.F., et al 1991, ApJ 381, L5
- [] Chini R., Krügel E., 1994, A&A, 288, L33
- [] Dunlop J.S., Hughes D.H., Rawlings S., Eales S.A., Ward M.J., 1994, Nature, 370, 347
- [] Espey, B.R., Carswell, R.F., Bailey, J.A., Smith, M.G., Ward, M.J., 1989, ApJ 342, 666
- [] Hughes, D.H., Dunlop, J.S., Rawlings, S., 1997, MNRAS, in press
- [] Irwin, M.J., McMahon, R.G., Hazard, C., 1991, in: The Space Distribution of Quasars, ASP Conference Series, Vol. 21, p117, D. Crampton (ed.)
- [] Isaak K., McMahon R., Hills R., Withington, S., 1994, 269, L28
- [] Ivison R.J., 1995, MNRAS, 275, L33
- [] McMahon R.G., et al 1994, MNRAS, 267, L9
- [] Ohta, K., Yamada, T., Nakanishi, K., Kohno, K., Akiyama, M., Kawabe R., 1996, Nature 382, 426
- [] Omont, A., Petitjean, P., Guilloteau S., McMahon, R.G., Solomon P.M., Pécontal, E., 1996a, Nature 382, 428
- [] Omont, A., McMahon, R.G., Cox, P., Kreysa, E., Bergeron J., Pajot, F., Storrie-Lombardi, L.J. 1996b, A&A, 315, 1
- [] Scoville, N.Z., Yun M.S., Windhorst R.A., Keel W.C., Armus L., 1997, ApJ 485 L21
- [] Solomon, P.M., Downes, D., Radford, S.J.E., 1992, ApJ 398, L29
- [] Solomon P.M., Downes, D., Radford, S.J.E., Barrett, J.W., 1997, ApJ 478, 144
- [] Storrie-Lombardi, L.J., McMahon, R.G., Irwin, M.J., Hazard, C., 1994, ApJ, 427, L13
- [] Storrie-Lombardi, L.J., McMahon, R.G., Irwin, M.J., Hazard, C., 1996, ApJ, 468, 121
- [] Tytler, D., Fan, X.-M., 1992, ApJS, 79, 1
- [] Wiklind T., Combes, F., 1994 A&A, 288, L41