Morphological Studies of the Galaxy Populations in Distant “Butcher–Oemler” Clusters with . II. AC 103, AC 118, and AC 114 at .111Based on observations obtained with the NASA/ESA Hubble Space Telescope which is operated by STSCI for the Association of Universities for Research in Astronomy, Inc., under NASA contract NAS5-26555.
Abstract
We present new results of a program to study the detailed morphologies of galaxies in intermediate redshift clusters and hence understand the physical origin of the enhanced star formation seen in these environments at earlier epochs. Deep, high resolution imagery has been obtained of 3 rich clusters, AC 103, AC 118 & AC 114 at , through the (F702W) filter of the Wide Field Camera (WFPC-2) of the Hubble Space Telescope (). For AC 103 and AC 118, single 3–orbit pointings covering a central Mpc area have been obtained. For AC 114, a mosaic of four 6–orbit pointings has provided coverage of a central Mpc area, allowing for the first time a study extending to the outer regions of a more distant cluster. Morphological classification has been conducted visually using these images, with Hubble types plus evidence of dynamical interactions and/or structural abnormalities recorded for all galaxies down to in AC 103 & AC 118, and in AC 114. New spectroscopy limited at has also been acquired, providing within our WFPC-2 images a total sample of 129 confirmed cluster members of which 117 have secure star formation classifications (eg. starburst, post–starburst, H–strong).
Our study reveals that the mix of Hubble types within the distant clusters is, overall, significantly different to that seen in the same high–density environments nearby: there are proportionally more spiral galaxies and fewer E/S0 galaxies at these earlier epochs. Within the core ( kpc) regions of the 3 clusters, spirals covering the full Sa–Sdm/Irr range are present in numbers up to a factor of higher than that seen in present–day clusters, the highest fraction being observed in the least massive cluster within our sample, AC 103. Only in the virialised core of our most massive, regular cluster, AC 114, do we see morphological fractions approaching those of the present epoch. However, outside the core of this cluster the spiral fraction rises to % – 3 times above the present–day level. Dynamical interactions are also widespread throughout the populations of all three clusters with % of the members, on average, showing morphological evidence of this phenomenon.
The various subsets of ‘active’ cluster members show emergent morphological trends. The majority of blue galaxies either undergoing a starburst or seen shortly ( Gyr) thereafter are systems involved in major mergers. These galaxies, however, are generally of modest luminosity ( mag) even in this brightened phase; in their faded state they appear destined to become dwarfs, too faint to be included in magnitude–limited spectroscopic samples such as ours. Cluster members with ongoing star formation typical of present-day spirals are mostly normal Sb–Sdm/Irr Hubble types. Galaxies identified as having completed their last major episode of star formation 1–2 Gyr prior to the epoch of observation are conspicuous by their commonality in morphology, all being early–type (S0–Sb) disk systems. The red H–strong objects, interpreted from their colors and spectra as being the remnants of secondary star formation in old dormant systems, have morphologies consistent with this picture, being a mixture of normal E and S0 galaxies.
In combination, these results point to cluster galaxy evolution being driven by not one but several different physical processes. The only conspicuous one is galaxy–galaxy interactions and merging. However, our study reveals many galaxies where this process could not have been responsible for altering the course of their star formation activity. Furthermore, the normal disk morphology of the majority of these previously active galaxies indicate the operation of process(es) which halt star formation but leave the basic disk structure intact and largely unperturbed. This tends to favour mechanisms which affect the gas supply (eg. ram-pressure stripping, galaxy infall) rather than processes like “galaxy harassment” where we simply do not see the population of severely distorted spirals expected if its operation is widespread.
1 Introduction
One of the longest–standing and most striking pieces of evidence for galaxy evolution is the so–called “Butcher-Oemler” (BO) effect whereby the cores of rich, regular clusters at are observed to contain many more blue galaxies than in their present–day counterparts (Butcher & Oemler 1978, 1984; Couch & Newell 1984; see also Rakos & Schombert 1995). Yet, understanding how cluster populations can be so different at recent look–back times and determining the physical processes responsible for their subsequent transformation remain an important challenge in observational cosmology. This series of papers provides an important contribution towards the resolution of these issues through comprehensive analyses of magnitude-limited samples of member galaxies in clusters for which high quality spectra, deep infrared imaging and post-refurbishment imaging has been secured. The relative proximity of these clusters and their varied evolutionary state as judged from their masses and X-ray luminosities together with the uniform nature of the datasets constructed, complements other analyses based on samples which span a wider range of redshift and include a larger number of clusters, particularly the “MORPHS” sample (Smail et al. 1997a, Dressler et al. 1997a; see also Stanford et al. 1996).
In the first paper of this series (Couch et al. 1994; hereafter Paper I), an initial indication of the morphological nature of galaxies in our distant cluster sample was obtained using images taken with in its aberrated state. Deep Wide Field and Planetary Camera (WFPC-1) images were gathered of two rich clusters, AC 114 at and Abell 370 at , for which comprehensive ground–based photometry and spectroscopy was available (Couch & Sharples 1987; MacLaren, Ellis & Couch 1988; Aragón-Salamanca, Ellis & Sharples 1991). These data allowed us to morphologically classify, with moderate precision, the galaxy populations in these clusters, in particular those active or recently active in star formation and responsible for the BO–effect. This revealed two important trends amongst the population of blue active galaxies: (1) most had a disk-dominated, late-type spiral morphology which is rarely seen in the cores of present-day clusters, and (2) almost half appeared to be involved in dynamical interactions and mergers, a process first identified in distant rich clusters by Lavery & Henry (1988; see also Lavery, Pierce & McClure 1992). Similar trends were also found by Dressler et al. (1994a,b) in their separate –based study of the cluster Cl0939+37 at . Also examined in Paper I was the morphology of red cluster members with spectroscopic and/or photometric indications of previous star formation activity. In contrast to the blue population, these galaxies appeared to be isolated and undisturbed with a normal spheroidal morphology. This work gave a first indication that in the BO effect we were dealing with not only a wide-spread change in the typical star formation properties of galaxies in rich clusters, but also with a transformation of their morphologies.
Using spectroscopic measures, Barger et al. (1996; hereafter B96) explored in more detail the star formation characteristics seen amongst the distant cluster galaxies in order to better interpret the morphologies observed for these objects. They showed that the numbers of galaxies found in the different phases of star formation activity – starburst, post-starburst, spiral-like, red H-strong (Couch & Sharples 1987, hereafter CS; Paper I) – were consistent with a model incorporating a secondary starburst in % of the distant cluster populations. When B96 combined this with preliminary morphologies derived from a subset of the data we present here, there was a strong suggestion that mergers and interactions played an important part in triggering this star formation cycle.
The role of this paper is to fufill the original goal of this project: to determine morphological classifications for galaxies within three clusters at and to analyse these in the context of hypotheses discussed in Paper I and B96. The basic material for our analysis consists of morphological classifications, uniformly constructed, for magnitude-limited samples of cluster galaxies in AC 103, AC 118 and AC 114, each of which exhibit a significant blue BO excess and are at . At this redshift, we demonstrate that biases in morphological classifications when using high quality WFPC-2 data are minimal. We also present new spectroscopy extending considerably the data published by CS and in Paper I and which enables us to analyse the properties of a large sample of galaxies with morphologies in the context of spectral diagostics of recent star formation. This is the most direct method to uncover the physical mechanisms which are causing the recent and dramatic transformation in the cluster populations. Our cluster sample has a number of important advantages in this regard: (1) the three clusters lie at the same redshift and are imaged to comparable depths – comparisons between them are thus unaffected by differential K-corrections or surface brightness dimming; (2) the cluster masses and morphologies, as traced by their lensing and X-ray properties (Smail et al 1997b, Natarajan et al. 1997), span a broad range and include a relatively low mass cluster (AC 103), a regular massive cluster (AC 114), and a massive merging system (AC 118), allowing us to differentiate between those triggering processes which depend upon cluster environment; (3) finally, in the massive regular cluster AC 114, we have obtained wide-field WFPC-2 imaging out to kpc (where is Hubble’s Constant in units of 100 km s-1 Mpc-1), enabling us to trace the morphological composition of this cluster outside the core and hence constrain those transformation mechanisms which are sensitive to local galaxy density. These are the first wide–field observations of the morphologies of galaxies in a distant cluster to be published and we show how they provide a powerful insight into the nature and evolution of galaxies inhabiting such structures.
The plan of the paper is as follows: In the next section we describe our WFPC-2 observations and present the new ground–based spectra. In reporting the latter, we extend the sample of cluster members classified according to their star formation activity by combining line index measurements made from the new spectra with existing broad–band colors. In §3, we review our scheme for morphologically classifying galaxies both in terms of Hubble type and any visual evidence for dynamical interactions. The results of our morphological classifications are presented in §4 where we examine the overall morphological content of our clusters and investigate the population gradients seen within our WFPC-2 fields. In the next section we focus on the samples of spectroscopically confirmed cluster members, in particular those involved in the starburst cycle. We examine the morphology of galaxies in the different phases of this cycle and in doing so review the importance of dynamical interactions. Our findings are then discussed in §6; in particular, we revisit the starburst cycle proposed by CS and explored more quantitatively by B96, addressing specifically whether one mechanism is sufficient to drive the phenomenon. We summarise our conclusions in §7.
2 Observations and data reduction
2.1 Imagery
WFPC-2 observations of AC 118, AC 103 and AC 114 were obtained over the period September 1994 – January 1996 in time allocated to two different programs. The two clusters, AC 118 and AC 103, were observed in time allocated in Cycle 3 to complete the imaging of the 3 clusters studied by CS. Due to scheduling delays, these observations were in the end carried over into Cycle 4, the first cycle after the HST refurbishment mission. The other cluster, AC 114, was observed during Cycle 5 in time allocated to Smail, Kneib & Ellis to further investigate the gravitational lensing of background sources by this cluster (Smail et al. 1995a, Natarajan et al. 1997).
Details of these observations are given in Table 1 where we list the field centers, the dates, the filters used, the telescope position angles (V3 axis), and the total exposure times. All three clusters were imaged using the F702W filter. For AC 118 and AC 103, a single pointing at the listed position and PA was obtained, involving 3 orbit–length exposures offset from each other by 3 WFC pixels (0.30 arcsec) to facilitate cosmic ray and hot pixel removal. The positions and orientations chosen for AC 103 and AC 118 were those which maximised our coverage of the existing samples of spectroscopically confirmed members (CS, Paper I) within the core regions of these clusters. Hence the centers of these clusters are not coincident with the apex of the WFPC-2 field. AC 114 was observed over 24 orbits, split into four different pointings, chosen to give both contiguous coverage of the cluster (over an area approximately in size) and a double exposure of the central core region of the cluster. The latter was achieved by positioning one of the WFC chips on exactly the same area in two of the pointings thereby giving a total exposure of 33.6 ks on the central of the cluster. Yet again a 3 WFC pixel ‘dithering’ between individual exposures was employed.
Processing of our images took place using the standard STScI pipeline reduction, with the steps of bias subtraction, dark current removal and flat–fielding accomplished in the usual way. The images were then aligned using integer pixel shifts and combined with the IRAF/STSDAS task CRREJ. Cataloging and photometry of objects on these coadded frames was carried out using the SExtractor image analysis package (Bertin & Arnouts 1996). Image detection proceeded by first convolving the data with a 0.3 arcsec top–hat filter and then employing a mag arcsec-2 (equivalent to 1.3 above the background) detection isophote together with a minimum object area of 12 contiguous pixels. The SExtractor package measures both isophotal and total ‘Kron-type’ magnitudes for each object and it is the latter that we use for this study. These have been placed on the system using the synthetic zero-points published by Holtzman et al. (1995).
The surface-brightness limits attained in our cluster exposures are sufficiently deep to secure imagery with a signal-to-noise ratio high enough to provide robust morphological classifications to at least ( mag), the limit achieved in the ground–based photometric studies. Our confidence in achieving this limit was based on the analysis of the first ‘ERO’ observations made with WFPC-2 immediately after refurbishment (eg. Dressler et al. 1994b), which revealed the tremendous potential of HST for conducting morphological classifications at these faint limits. Such morphological classifications are of course sensitive to both the bandpass and depth of the source material used. Our selection of the F702W filter provides close to rest-frame imagery of the distant cluster members, ideally matched to the blue/visual source material on which local morphological schemes are based. The issue of the depth required to adequately classify galaxies has been extensively addressed in the simulations of Glazebrook et al. (1995) and Abraham et al. (1996). They investigated the reliability of using F814W images of a few orbits duration for classifying field galaxies to 1. These workers found little error in the recognition of spheroidal galaxies and early-type spirals, but intermediate and late-type spirals at high redshifts appear to have later Hubble types than might genuinely be the case because of a combination of signal-to-noise ratio (S/N), sampling and bandpass shifting effects. However, our clusters lie at sufficiently low redshift that we expect this bias in the spiral classifications to be negligible. For the case of differentiating between E and S0 galaxies using WFPC-2 imaging we refer to the discussion in Ellis et al. (1997) and Smail et al. (1997a). These authors classified the populations in clusters using F814W images (also rest-frame ) from WFPC-2. To a magnitude limit significantly fainter than that adopted here, at a redshift where the scale and sampling is 30% coarser, they demonstrated that only % of the S0 population was misclassified, the loss being round S0s misclassed as Es, a problem which also occurs at a similar level in local samples (c.f. Smail et al. 1997a). We are therefore confident that the depth and wavelength coverage available from our WFPC-2 imaging is sufficient to provide robust and unbiased classifications on the Hubble system for all morphological types in these clusters.
2.2 New ground–based spectroscopy
Another important component of our observational program is the comprehensive spectroscopic study of our distant cluster fields. While at the most basic level spectroscopy is necessary to provide membership information for galaxies in our fields, we do not expect a high field contamination rate in our samples due to the high contrast of the cluster cores in the limited field of view of WFPC-2 (Couch & Newell 1984; hereafter CN). Instead, the principal role of the spectral data is to obtain high quality line index measurements for member galaxies, which we can combine with the detailed morphologies from our WFPC-2 imaging. Following CS and B96, we show that the information the former data provide on current and past star formation is crucial for understanding the evolution of galaxies in these clusters. In obtaining new spectroscopy, we have sought to redress the incompleteness in CS’s spectroscopic coverage to and, in a complete way, to extend it faintwards to limits more commensurate with the depth of our WFPC-2 images.
The new data presented here were obtained during two observing runs, one on the 3.9 m Anglo–Australian Telescope (AAT) using the Low Dispersion Survey Spectrograph (LDSS-1), and the other on the European Southern Observatory’s 3.5 m New Technology Telescope (NTT) using the European Multi–Mode Imager/Spectrograph (EMMI). For the former, the three clusters AC 118, AC 103, and AC 114 were targeted. Two multi–slit masks, each containing slits for 20–25 objects, were designed and manufactured for each cluster. Program objects were chosen first and foremost from samples assembled for each cluster from the infrared imaging data of B96. The purpose of this infrared ()–based selection was to reduce the bias towards star–forming and, in particular, star–bursting galaxies, which as demonstrated by B96 is a serious effect in samples selected in the optical (rest-frame uv-blue). While this catered for object selection within the -band field and hence the WFPC-2 field contained within it, it did not fully utilise the 10 arcmin field of LDSS-1. Our samples were therefore supplemented with objects from the photographic catalogues of CN with a small number of the galaxies observed spectroscopically by CS also being included for comparison purposes. Selection in this case was made using optical data to a limit of . Of the 25 objects selected for each mask, it was possible to include 10–12 within the single WFPC-2 field of AC 103 and AC 118, and all but 1 or 2 within the larger field of AC 114. These numbers were set largely by the need to impose a minimum slit length of 15 arcsec to facilitate accurate sky estimation and subtraction.
For the NTT run, our observations were subsidiary to a program of spectroscopic confirmation and redshift measurement of the gravitationally lensed ‘arcs’ and multiple images in the field of AC 114 (Ebbels et al. 1997). Spectroscopy of the lensed candidates was carried out using two masks, one designed to cover the brightest arcs and another to cover a sample of fainter ‘arclets’. The unused regions of these masks were accordingly devoted to a set of ‘bright’ and ‘faint’ galaxy targets, respectively, within the AC 114 field. Selection of the ‘bright’ sample proceeded as for the LDSS-1 observations using the limited infrared sample from B96 and the photographic photometry of CN. A total of 44 slits were devoted to this sample, of which 25 lay on objects within our WFPC-2 field. For the faint sample, object selection was carried out using the image taken with EMMI for the purpose of mask design. A sample of 35 objects covering a similar magnitude range () to the lensed candidates was chosen with 12 of these being within our WFPC-2 field.
The AAT run took place on the nights of 1995 August 28, 29 and 30. LDSS-1 was used with its “high-dispersion” grism to give a dispersion of 164 Å mm-1 and, with a slit–width of 1.5 arcsec employed, a spectral resolution of 9 Å. A thinned 1024 x 1024 24 m pixel Tektronix CCD was used as the detector, providing a wavelength coverage of 4000 Å 8000 Å. Excellent weather conditions were experienced on the first two nights of this run; the third night was completely lost due to cloud cover.
The NTT observations were made on the nights of 1995 October 22, 23 and 25. EMMI was used in its ‘Red Imaging Low Dispersion’ (RILD) mode with the 118 Å mm-1 grism (grism #2) and a thinned 2048 x 2048 24 m pixel Tektronix CCD (#36) as detector. A slit width of 1.5 arcsec was used yielding a spectral resolution of 12 Å. The wavelength coverage of the spectra was approximately 4000 Å 8700 Å. All the observations were made in non–photometric conditions with the ‘faint’ mask exposures being particularly affected by cloud.
A log of the AAT and NTT observations, with relevant details such as the total exposure time and the recorded seeing, is given in Table 2. The quoted exposure times consisted of a series of 2000 s (and the occasional 1000 s) integrations for the LDSS-1 observations and 3600 s integrations for the EMMI observations.
The data from both runs were reduced using a combination of routines in the LEXT (Colless et al. 1990), FIGARO, and IRAF reduction packages. Individual exposures were bias subtracted and then combined using the CCDPROC and IMCOMBINE commands within IRAF. Some of the LDSS-1 frames required small (1–3 pixel) shifts in the dispersion direction prior to coaddition to compensate for the effect of flexure within the spectrograph throughout the course of a set of integrations on a particular mask. The size of the shifts required were determined by cross-correlating the positions of the night-sky lines in adjacent exposures. The first night of data taken with LDSS-1 also required correction for a small misalignment between the dispersion direction and the columns of the CCD. This was accomplished using the SDIST and CDIST routines within FIGARO. The former was used to quantify the tilt from the spectra recorded in a tungsten lamp exposure taken through the same mask; CDIST then applied the fractional shifts required in the spatial direction (ie. along each row of the CCD image) to align the spectra along the CCD columns. The final steps of spectral extraction, sky-subtraction and wavelength calibration were performed using LEXT as previously described in Paper I.
A representative collection of the reduced spectra is shown in Figure 1. These spectra are comparable in quality to those obtained in earlier work (CS, Paper I) with the same range in S/N (3–20) and a similar median value (S/N8). They thus provide the same high rate of redshift identification and level of precision in making spectral line measurements. The only exception to this are the spectra obtained with the ‘faint’ mask at the NTT. Apart from 2 objects, these spectra all had signal-to-noise values too low (S/N) to make reliable absorption line measurements. Nevertheless, a large fraction of these objects did provide redshift measurements due to the presence of emission lines. Measurements of the central observed wavelength and equivalent width (EW) of the identifiable emission and absorption lines in each spectrum were carried out using the FIGARO routine ABLINE. This was done independently by two of us (W.J.C. and A.J.B.) in order to provide an empirical check on our errors. In particular it allowed us to assess the uncertainty introduced into our equivalent width measurements through the placement of the continuum – a procedure which is done interactively within ABLINE.
The results of these measurements together with other relevant data are presented in Table 3. The first 3 columns give the identity number of each object in (i) the SExtractor catalogue derived from our WFPC-2 images (§2.1), (ii) the photographic catalogue of CN, and (iii) the infrared () catalogue of B96, respectively. The absence of an entry in the first of these columns indicates that the object lies outside the WFPC-2 field. Listed in the next 5 columns are the R.A. and Decl. (1950), the and magnitudes, and the – color. The and magnitudes are ‘total’ values, the former being taken from our WFPC-2 derived SExtractor photometry where available (and from CN where not) and the latter from B96. The colors are the reddening–corrected – values of CN, transformed onto the standard Kron-Cousin – scale (Couch 1981). The next 3 columns of Table 3 contain our spectral measurements. Listed are the mean redshift and the rest–frame equivalent widths of the [O II]3727 emission and H absorption lines measured for each object. The presence of a colon following the redshift value denotes that the measurement is based on just one emission line – assumed in all cases to be [O II]3727. The mean internal error in our redshift measurements is (corresponding to km s-1 in the rest-frame at ) and a comparison based on the 10 repeated CS objects indicates a mean redshift difference, (this paper)–(CS), of – consistent with the internal errors in both sets of measurements. The errors quoted for the [O II]3727 and H equivalent widths represent the quadrature sum of the uncertainties arising from the noise in the spectra (taken from the [S/N, (EW)]–relation derived empirically by CS from model synthetic spectra) and the placement of the continuum (as determined from our two independent sets of measurements).
As a final step we combine our photometric data and spectroscopic measurements to derive a spectral type for each object, the results of which are recorded in the last column of Table 3. Here we follow exactly the precepts established by CS based on the position of objects within the [EW(H), (–]–diagram. As described in detail by CS and further discussed in Paper I, this diagram is a powerful diagnostic for recognising and therefore isolating galaxies with different ongoing and recent star-formation histories. In the context of the star formation activity seen in distant cluster galaxies, 5 spectral types are of relevance: (1) “Starburst” (SB) – galaxies undergoing a burst of star formation, (2) “Post–starburst” (PSG) – galaxies which completed a burst of star formation within 2 Gyr prior to the epoch of observation, (3) “Spiral–like” (Sp) – galaxies with the spectral and color properties of normal nearby spiral galaxies, (4) “Passive” (Psv222These were referred to as “E/S0” types in CS and Paper I; we have changed our nomenclature here to avoid confusion with our morphological classifications (see §4).) – galaxies with the spectral and color properties of nearby E and S0 galaxies, and (5) “Red H–strong” (HDS) – galaxies with the same spectral and color properties as the passive population but with enhanced H absorption. The exact definitions of these different types and their location within the [EW(H), (–]–plane can be found in CS and Paper I and these are used here with one exception: B96’s more conservative limit of EW(H) Å for HDS types is adopted instead of the EW(H) Å limit used previously. For AC 103, AC 118 and AC 114 we once again define “red” and “blue” galaxies to have – colors (col. 8, Table 3) greater than and less or equal to 2.0, respectively, and stress that it is this color boundary which separates the HDS types (which are “red” and often referred to as “E+A” galaxies elsewhere in the literature; Dressler & Gunn 1982, 1983) from the PSG galaxies (which are “blue”).
In listing the spectral types for cluster members in Table 3, a number of objects have been designated as “Psv(pec)”. These are galaxies whose spectra have all the same characteristics as the passive types but whose colors are marginally bluer (ie. –1.8–1.9) that they do not satisfy the ‘red’ criterion. Whilst photometric scatter could account for some of these objects, we flag them nonetheless. It should also be noted that some objects have their spectral types listed as “?”. This indicates that their spectral types were not measurable due to the low quality of their spectra.
These new observations have provided spectroscopy for 107 previously unobserved objects within the fields of AC 103, AC 118 and AC 114. Of these, 15, 21 and 31 galaxies are contained within our WFPC-2 images of these clusters thereby extending the samples of spectroscopically confirmed cluster members in these fields to 26, 30 and 73 galaxies, respectively. In addition, there is now sufficient data to make comparisons between cluster and field objects with the latter types amounting to a sample of 33 galaxies with a mean redshift of . To this end we have compared the distribution in [OII]3727 equivalent widths to gauge whether there is any gross difference in star-formation rates between the two environments at these earlier epochs. A Kolmogorov–Smirnov test shows that there is no difference between the cluster and field distributions at the 5% significance level. Further spectroscopy of matched samples of cluster, super–cluster and field galaxies at these redshifts is really needed to establish this conclusively.
3 Morphological Classification of Cluster Samples
An inspection of our WFPC-2 images indicated that the goals of our study could be best achieved by continuing with the visual morphological classification scheme we developed for the WFPC-1 data in Paper I. Whilst machine–based measurements offer an objective means for obtaining broad classifications across large samples (Abraham et al. 1996; Smail et al. 1997a), the visual approach is more sensitive to finding regular galaxies with unusual structure or minor peculiarities – traits which we regard to be more important to this study. The excellent quality of the WFPC-2 frames meant that they provided high signal–to–noise (S/N) imagery of all the galaxies whose evolution had been previously quantified both photometrically and spectroscopically. Most importantly, the S/N was clearly sufficient to recognise small irregularities in their structure that might be pertinent to their evolution (eg. signatures of dynamical interaction). The primary concern of this section, therefore, is the visual classification of magnitude–limited samples of galaxies within our cluster fields. We also describe tests of our discrimination between E and S0 galaxies using a profile fitting technique.
3.1 Visual Classification
As was indicated in the initial studies of distant clusters (Paper I; Dressler et al. 1994a,b; Oemler, Dressler & Butcher 1997) and which is even more striking in post-refurbishment images, the galaxy populations within these fields appear, morphologically, to be predominantly of normal Hubble type (elliptical, S0, spiral). In addition, the WFPC-2 data continue to reveal a significant number of objects with conspicuous signs of dynamical interaction either through the presence of tidal bridges and tails or gross distortions. We have therefore continued to use the classification scheme developed in Paper I based largely on the Revised Hubble system with an additional classifier used to flag different manifestations of interactions and merging between galaxies. Broadly, we assign to each object a Hubble type (ie. E,S0,Sa,Sab…Irr) and categorise dynamical interactions on the basis of the visible evidence be it an obvious merging of two objects, a clear interaction between two objects, or the presence of tidal features. The presence of satellites is also noted. The criteria used in making these classifications will be detailed below.
Two of us (W.J.C. & R.S.E.) each independently classified galaxies in all our cluster fields in the following manner. Using AC 103 as a test case, all objects within the SExtractor catalogue were classified in terms of Hubble type to as faint a magnitude limit as possible (). We then determined how the incompleteness of our classifications varied with apparent () magnitude. This was gauged by the numbers of objects which were either too faint to classify or when classified as a spiral, their spiral arm structure was too faint to determine their subclass (i.e. a,b,c,dm). It was found that in this case of a 3–orbit exposure, incompleteness began to set in at , rising from % at to more than 20% at . This led us to adopt a magnitude limit of ( at ) for our morphological classifications in AC 103 and AC 118. The corresponding limit adopted for the 6–orbit exposures of AC 114 was mag ().
A full classification down to these magnitude limits was then conducted in each of our cluster fields. The two sets of results were merged and the final morphologies are presented in the last 4 columns of Table 4. Objects with stellar appearance have been omitted in the compilation of this table. The first of these columns contains the Revised Hubble type. Here the nomenclature used is standard with the only departure being for the brightest member of AC 114 whose visual appearance was more appropriately described by the “cD” classification of the Morgan system. In denoting early Hubble types, the classifications “E/S0” and “S0/a” have sometimes been used. These reflect the ambiguities and uncertainties that can occur in classifying these types (this is discussed more fully in Smail et al. 1997a) and are not meant to indicate transition cases. More specifically, they have been used to record cases where either both classifiers were unable to decide between an E or S0/S0 or Sa classification or their classifications differed to this extent. The relative split between these two different situations was approximately 60% : 40%. Spirals have been classified to half a subclass with barred systems denoted in the usual way. However, barred systems were only noted where obvious and in no way can our catalogues be regarded as complete in the recording of these types. As partly mentioned already, some objects could be readily identified as “spirals” (through their “disky” rather than spheroidal appearance) but as a result of their faintness, orientation, or proximity to another object, the subclass they belonged to was unclear. Such cases are denoted with an “S”.
A small fraction of objects have a morphology that could not be described within the Revised Hubble system; these are listed as either peculiar (“pec”) or compact (“comp”). The latter, which were the most common in this category, are an interesting set of barely resolved objects which while not truly stellar in appearence, are too compact to classify in any detail. Unfortunately no spectroscopy is yet available to cast any light on the nature of these objects. Finally, some objects have been given a “GL” classification; this category is used for the numerous gravitationally lensed “arc” features revealed in our images (Smail et al. 1995a). Our list, however, should not be taken to give a complete identification of such images with a more optimised and thorough compilation being reported elsewhere (Smail et al. 1997b; Natarajan et al. 1997). There is also a small number of galaxies which are well enough resolved to be given a Hubble classification but are clearly distorted in a manner consistent with being lensed by the cluster. Such cases have been catalogued with their Hubble type and a note made to this effect in the last column of the table.
The next column, headed “MDS”, lists our classifications on the numerical scheme devised by Glazebrook et al. (1995) in their analysis of the Medium Deep Survey data. Here the different Hubble classes are assigned a number between 0 and 6 with E=0, E/S0=1, S0=2, Sa–Sb=3, S=4, Sc–Sdm=5, and Irr=6. This scheme then uses a value of -1 for objects with the same “compact” morphology as found here and a value of 7 for unclassified objects. The only convention not adhered to was to assign galaxy mergers a value of 8. Instead we have preferred to record the MDS number appropriate to the Hubble type of the object and to use the subsequent column to indicate its involvement in a merger.
The third of our classification columns in Table 4 is used to indicate evidence of dynamical interactions and/or the presence of satellites. The morphological signatures associated with interacting and merging systems are well documented and understood from the observation and modelling of nearby systems (Arp 1966, Toomre 1977, Quinn et al. 1993), and the simulations of Mihos (1995) provide a useful indication of how the different phases of the merging process might appear in WFPC-2 images of the distant galaxies studied here. With these studies in mind, we have categorised objects in terms of three generic situations:
1. Interactions. These are generally the most conspicuous and
hence easily identifiable cases involving spatially distinct systems
(separations arcsec) of comparable brightness which have either a
clear isophotal and hence tidal link between them (eg. AC 114#CN87 and
AC 114#CN849 in Fig. 6a) or are mutually distorted in a way consistent with
tidal interaction (eg. AC 114#CN111 in Fig. 6a).
2. Mergers. These fall into two categories: multiple systems
clearly in the process of merging and single systems where the visible
distortions/peculiarities are interpreted as being due to a recent merger. The
former are distinguished from objects in the previous class in that their
multiple structure is on smaller scales (ie. separations
0.2–0.5 arcsec; kpc at ) – examples include
AC 118#CN104 and AC 114#CN22 in Fig. 6a. The latter systems are identified
on the basis of either having the classical tidal arm signature of a merger
event (eg. Fig. 1 of Mihos 1995)
or being so strongly distorted as to suggest the recent capture of another
galaxy. Obviously the identification of these types is a rather subjective
procedure and we treat such cases with caution (see below). A typical example
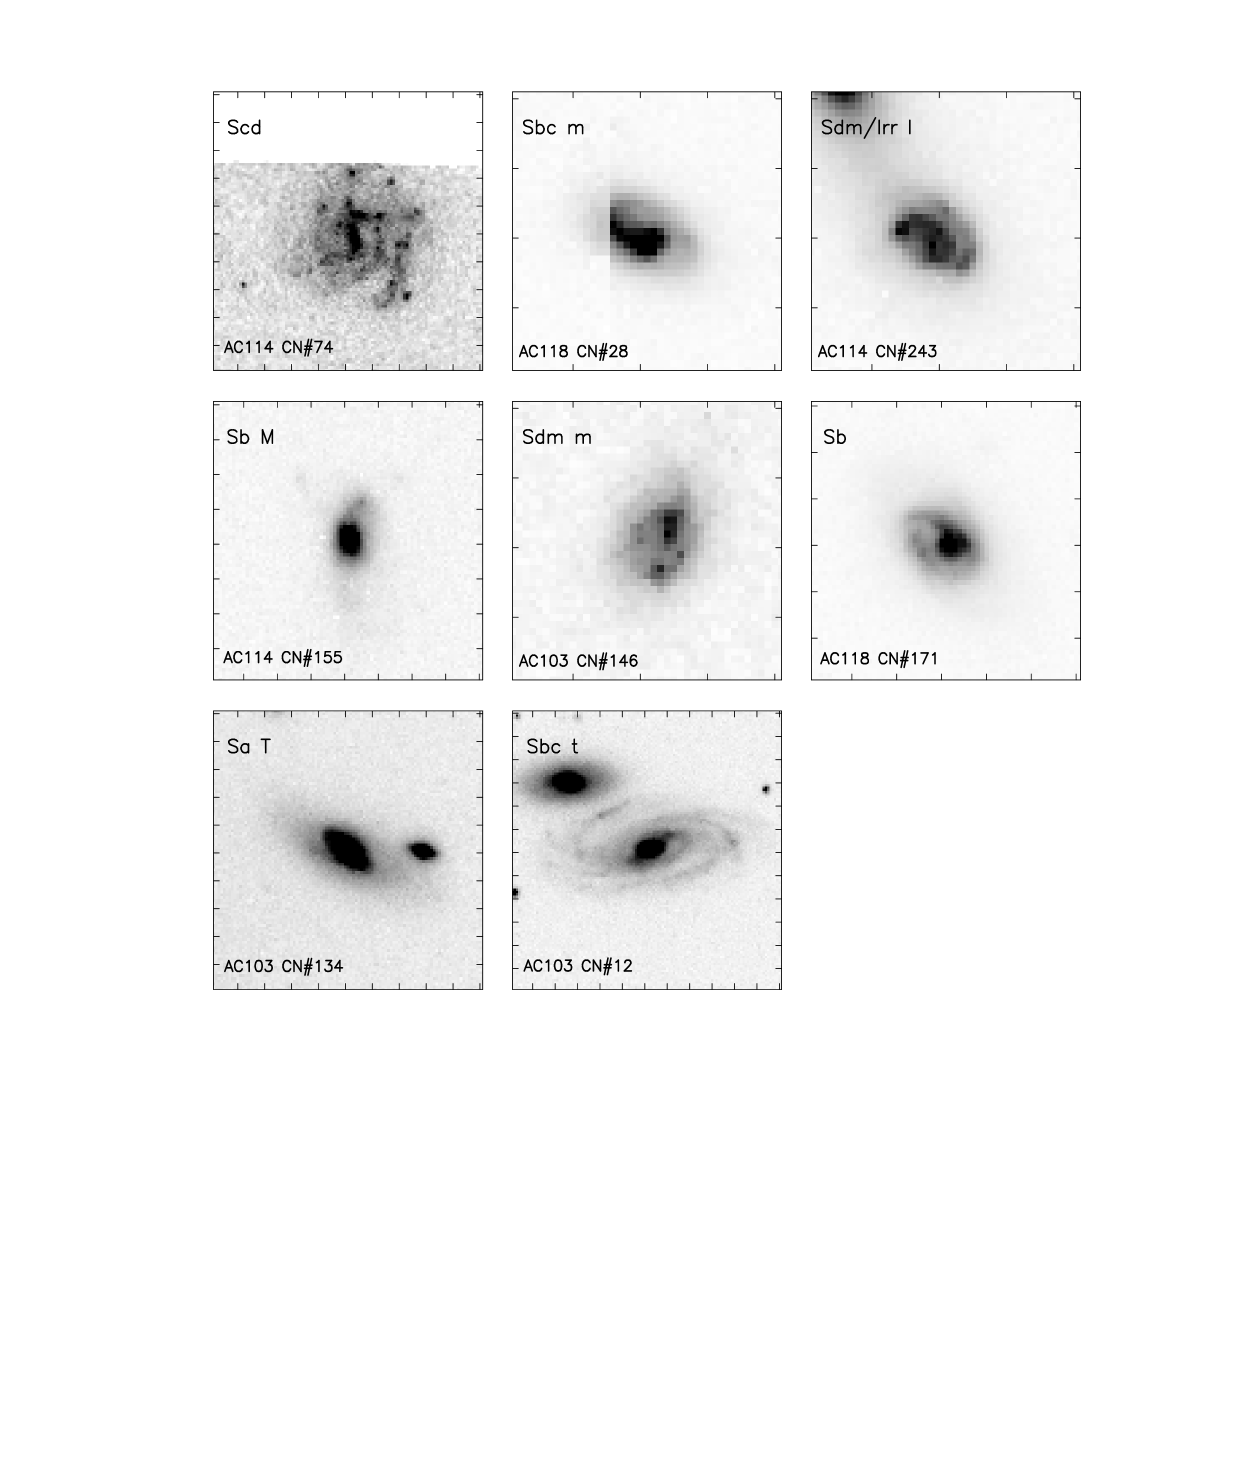
is AC 114#CN155 in Fig. 6b.
3. Tidal Evidence. This category is used to record objects which
show evidence of tidal features but do not provide direct evidence of a
merger or interaction with another galaxy. The connection between the two
is, therefore, by implication only. Such features include: possible “shells”
of the type seen by Malin & Carter (1983) in the outer regions of nearby
spheroidal galaxies, warped and distorted outer isophotes around elliptical
galaxies, “debris” of the sort predicted by Mihos (1995) to surround merger
products for Gyr after the merger event333A preliminary
determination of the incidence of these types in AC 103 and AC 118 was
reported in B96., and faint tails, whisps and arms consistent with having
a tidal origin.
These three different classes are denoted I or i, M or m, and T or t in the “Dyn/Int” column. The use of upper and lower case symbols is to indicate the level of certainty and unanimity in our classifications. Where upper case symbols are used, both classifiers independently and unreservedly gave the object this classification. Lower case symbols then indicate instances where there was not unanimity or some doubt in the classification was expressed by either or both of the classifiers. The one other entry in this column is “Sat” for galaxies with faint satellites. The criterion applied here is the presence of significantly fainter objects (as determined only visually) within a galaxy’s visible envelope. In cases where there are multiple satellites, the exact number is recorded in parentheses.
The final column in Table 4 contains comments relating to our morphological classifications. These serve several purposes, the main two being to make it clear what type of feature is responsible for an object’s T/t classification, and to record peculiarities which are not described adequately under the Hubble or I/M/T/Sat schemes. One such peculiarity commonly recorded was a clear asymmetry in the arm structure of spirals.
Having presented our morphological classifications, some comment is required on their reliability and consistency both internally and externally. An internal check was available from the two independent sets of classifications and this showed a high level of concordance between the two classifiers with no evidence of any systematic difference between them. In particular, a comparison of the Revised Hubble types derived over the three cluster fields indicated that, on average, exact agreement between the two classifiers occurred 56% of the time, agreement to within half a class (i.e. the difference between an E and E/S0 or between an Sb and Sbc) occurred 86% of the time, and agreement to within one class occurred 95% of the time. In addition, the average of these differences was zero indicating that one classifier did not systematically classify objects earlier or later (in the Hubble sense) than the other. When differences did occur, the method for dealing with them was as follows: In cases where the difference was one class or less, the average between the two was taken. For the small number of more serious discrepancies, the two classifiers reviewed their classifications and a final result was mutually agreed upon.
The excellent level of internal agreement of our classifications, when combined with our concious attempt to keep our classification scheme as close as possible to the systems used by other HST morphological studies, means that our catalogues can be easily compared to these other samples. In particular, we can be confident that our Revised Hubble types are on the same system as those derived visually for the field galaxy populations imaged in the HST Medium Deep Survey (MDS, Griffiths et al. 1994; Glazebrook et al. 1995), as a large part of their classifications was conducted by R.S.E. In addition, both W.J.C. and R.S.E. played a major role in a similar classification of galaxies in more distant clusters as part of the “MORPHS” project – an HST–based study of 10 clusters at (Smail et al. 1997a). This ensures that our classifications are well tied to this study as well.
Finally, as a reference for examining how the different morphological types we have identified are distributed spatially within the clusters (§4.4), plots showing the location and morphology of the classified samples within the WFPC-2 fields are presented in Figure 2. Galaxies have been plotted using different symbols to differentiate their morphology and those with a M, I, or T classification have been circled.
3.2 Profile fitting
An important check on the accuracy of the visual morphological classification of E and S0 galaxies can be made using surface brightness profiles to identify extended disk components. The method we have adopted is to visually classify the surface brightness profiles, using plots of vs , vs and vs , where is the equivalent radius of the best-fitting elliptical isophote with surface brightness in logarithmic units and is the coefficient in the Fourier decomposition of the fit. In the absence of instrumental PSF and finite pixel size effects, a pure de Vaucouleurs elliptical would therefore be a straight line in the former plot, and an exponential disk in an S0 would show up as a linear region in the outer parts of the second plot. The final plot measures the ‘diskiness’ of the isophotes and is a useful diagnostic for the presence of nearly edge-on flattened disks (e.g. Carter 1987).
The surface brightness profiles were extracted from the reduced HST images using the Starlink Extended Surface Photometry package (Privett 1996) which allows interactive fitting of the local sky background and galaxy profiling using elliptical isophotes fitted to uncontaminated parts of the image. To account for the effects of finite pixel size and the wings of the WFPC-2 PSF on the profiles, we used the IRAF ARTDATA package to generate synthetic images using pure exponential and pure profiles, with appropriate S/N, and convolved them with PSFs generated using the TINYTIM (Krist 1994) package. These profiles then served as a reference set on which to base classification of the profiles extracted for galaxies in the 3 clusters.
The primary role of the profile-based classifications has been to resolve cases of ambiguity where the visually determined morphologies were discrepant between the two classifiers. Figure 3 shows two such examples from AC 103 where the profiles indicate an elliptical (HST#69) and S0 (HST#650) classification, respectively. We have also used blind profile classifications to check the morphological classifications for a subset of the E & S0 galaxies in each cluster. The profile classifications were found to agree exactly with the visual classifications in 70% of cases; 15% of the sample were classified E visually but S0 on the basis of profiles, whilst 15% were classified S0 visually and E from the profiles (3% of the sample were unclassifiable on the basis of profiles alone). In general, therefore, despite using a very simplified model of real galaxies, the profile classifications support those based on a direct visual inspection of the HST images. In cases where there is disagreement, the profile–based classifications have been adopted in preference to the visual ones.
4 Results
4.1 Morphological Content
Determining the morphological composition of our distant clusters is the primary goal of our study and, as a first step, we examine the distribution in Hubble type of the magnitude–limited samples classified in each field. This information is contained within Figure 4 where we present “cluster” morphological distributions which show the numbers of different Hubble types (binned into E, S0, Sa–Sb, Sc–Sdm, Irr) corrected statistically for the expected contributions from the superimposed field galaxy population. The raw numbers of objects classified as “pec” or “comp” are also shown. Because of the much larger areal coverage available for AC 114, the data for this cluster have been divided into 3 contiguous radial bins each 1 arcmin (180 kpc) in width and plotted accordingly. A radial analysis of the data is justified for this cluster given its regular, centrally–concentrated structural morphology (CN). Note also that the inner kpc zone corresponds closely to the regions covered by our single WFPC-2 pointings of AC 103 and AC 118.
Subtraction of the field component from our cluster distributions was accomplished using the –band galaxy number count data of Metcalfe et al. (1995) and the deep field morphology data of Driver et al. (1995). The former were used to determine the expected number of field galaxies within our WFPC-2 frames; they predict 27 galaxies brighter than within the single 5.1 arcmin2 WFPC-2 fields acquired for AC 103 and AC 118, and 195 galaxies brighter than in the 20.1 arcmin2 field of AC 114. In comparison, the numbers of galaxies observed in these fields to the respective limits are AC 103 (122), AC 118 (129), and AC 114 (474). The distribution of the field population across the different Hubble types was set using the morphological mixes published by Driver et al. For our samples, a %E:%S0:%Sab:%Scdm:%Irr = 17:17:25:30:11 mix was adopted, and for our sample in AC 114 a %E:%S0:%Sab:%Scdm:%Irr = 10:10:25:30:25 mix was adopted.
In determining the field contribution, careful account was taken of the differences between the system used for our WFPC-2 based photometry and the (; Couch & Newell 1982) system used by Metcalfe et al. This was done by computing the offsets between the two bands using the spectral energy distributions for different Hubble types published by Pence (1976): for E/S0, for Sab, for Sbc, for Scd, for Sdm. It should also be pointed out that the field galaxy mixes used here were determined from WFPC-2 observations made in a different passband (F814W) to the F702W band used for this study. However, the difference in apparent morphological mix between these two red bands should, to the limits we are working at, be small, to the extent that they will have a negligible effect on our final field–subtracted “cluster” distributions. To be consistent at least in magnitude limit, we converted our values onto the system assuming – – the mean color of the field galaxy population at these limits (Smail et al. 1995b).
To provide a present-day “bench mark” with which to compare the morphological composition within our distant clusters, predictions of the morphological mix based on that observed in similar environments nearby were computed in each case. This is important in isolating evolutionary changes given that morphological mix is a strong function of global cluster morphology (Oemler 1974) and local galaxy density (Dressler 1980), both of which vary considerably over our distant sample. To produce quantitative predictions, we used Dressler’s well-defined [morphological mix, local galaxy density]–relation which he showed underlies the variation in morphological mix with cluster morphology. Our procedure was to evaluate the density of galaxies local to each of the objects classified in our magnitude–limited samples, following as closely as possible the prescription adopted by Dressler. This involves identifying the 10 nearest neighbouring galaxies and then calculating the corresponding projected surface density, corrected for field galaxy contamination. In Dressler’s nearby study this was done in the visual band to a limiting magnitude of for a cluster sample with an average redshift of . At these experimental “conditions” can be reproduced almost directly, since in the rest–frame our F702W band is reasonably well matched to Dressler’s visual band. The appropriate limiting magnitude in the band at this redshift has already been calculated by Couch (1981) and so we use the equivalent limit on the system () as determined by the transformations described above.
The distant versus nearby comparison of morphological content has been analysed in two ways. In AC 114 where our WFPC-2 imagery goes well out beyond the central core region, the observed field–corrected E:S0:Sp mix has been evaluated in contiguous radial zones centred on the central cD galaxy (HST#1.1089) and 0.5 arcmin ( kpc) in width. This is a valid approach for reasons already mentioned. The local galaxy density averaged over all the galaxies within each of these zones was calculated, thus providing a present–day comparison by reading off the corresponding E:S0:Sp mix from Dressler’s [morphological mix, local galaxy density]–relation. In AC 103 and AC 118, where we have only single pointings with the clusters not perfectly centred within them, such a radial analysis was not practical. Instead, we simply compared the morphological mix observed over the whole frame with the nearby prediction based on the local galaxy density averaged over the whole frame as well.
4.2 The Morphological Mix in the Cluster Cores
We start by discussing the morphological mix seen in the cores ( kpc) of these clusters. Here the distributions in Figure 4 show quite clearly that, with the exception of the “Irr” class, all Hubble types are present in significant numbers in these regions. In particular, we see considerable numbers of Sa–Sdm galaxies in addition to the dominant population of E and S0 types. This corroborates the conclusion of the initial studies (Paper 1; Dressler et al. 1994a,b; Oemler et al. 1997) that spiral galaxies are a common inhabitant in the core regions of rich clusters at these earlier epochs. Importantly, this mix of morphologies is also seen in the samples of spectroscopically confirmed members (represented by the cross–hatched histograms in Figure 4) thereby ruling out that it is an artifact of incorrect field galaxy subtraction.
These trends are documented more quantitatively in Table 5 where we list the E:S0:Sp fractions observed in our clusters together with those predicted from the Dressler [morphological mix, local galaxy density]–relation. To aid our comparisons, we include for AC 114 the observed and predicted mixes within a single WFPC-2 sized field, centred on the cluster in an equivalent way to that of AC 103 and AC 118 (referred to as the “WFPC-2” region in Table 5). Inspection of the data shows only one instance where the observed and predicted mixes come within close agreement: in the central arcmin ( kpc) in AC 114. Clearly the process(es) responsible for the morphology–density relation have almost run their full course in the very centre of this cluster and it maybe no coincidence that this happens to be the most massive and regular cluster within our sample. In the core regions of the other two clusters spirals are seen in excess numbers, making up –35% of the galaxy population in contrast to fractions of less than 10% seen at the same projected densities nearby. The highest fraction (35%) is observed in AC 103, the least massive of the clusters in our sample. Furthermore, the enhancement in spiral numbers persists all the way into the centres of AC 103 and AC 118, with the E:S0:Sp mixes within their central 0.5 arcmin being no different to those evaluated over the full WFPC-2 field. With spirals being present in excess numbers, accordingly there is a deficit in the numbers of E and/or S0 galaxies, the balance of which appears to vary between the two clusters. In AC 103, both the E and S0 fractions are below the present-day levels whereas in AC 118 it is only the ellipticals that are deficient.
A comparison of the morphological mixes we see at with those at higher redshift is also an important one and here the “MORPHS” observations based on single WFPC-2 pointings of the cores of 9 clusters at (Smail et al. 1997a) allow us to do so almost directly. The two most conspicuous trends involve the Sp and S0 populations. The spiral fractions in the higher redshift sample are, in general, significantly higher than that seen at , being at the 40–50% level. In addition, we see a significant drop in the fraction of S0’s in going to higher redshift; whereas % of the galaxies are S0s in our clusters at , the fraction is consistently within the 5–20% range in the interval . Given that the morphological classifications of both studies should be consistent with each other (see §3.1), it is unlikely that this is the result of systematic differences in the way S0s are identified. Rather it further emphasises the conclusion of Dressler et al. (1997a) that there has been a significant and quite rapid production of S0s (and depletion of Sps) in cluster cores since .
4.3 The morphological mix on larger scales
Our WFPC-2 mosaic of AC 114 provides a first–time view of the morphological mix in the more outer regions of a distant cluster; in particular, we are able to examine morphologies out to distances of kpc from the center of AC 114. In doing so, we probe regions where the projected galaxy density is a factor of lower than that in the central core and, as a result of AC 114’s rather flat and regular surface density profile at these projected radii, is relatively uniform (50–60 gals Mpc-2).
Returning to Figure 4, the most conspicuous trend seen in going to larger radii is the significant decline in E & S0 numbers to the point that the distributions are now spiral–dominated. The extent to which this simply reflects the change in morphological mix with galaxy density, which drops with radius, requires examination and here we refer to the data presented in Table 5 and Figure 5. The latter shows, in separate panels, the observed and predicted fractions of E, S0 and Sp galaxies in the 6 contiguous radial zones evaluated for AC 114. The two innermost “core” zones show graphically the behaviour described in the previous section.
At larger radii ( kpc) the discrepancy between the observed and present-day fractions becomes very pronounced. This is particularly so for the spirals which show a very strong increase, rising to % of the cluster population which is well above the % levels seen nearby at the same, lower projected galaxy densities. This excess of spirals is largely at the expense of the S0 population which shows a significant deficit at these larger radii. A deficit in the fraction of E galaxies is also seen although it is only significant at radii between 200 and kpc.
Some caution needs to be taken in interpreting the excesses and deficits we have identified via this comparison. Firstly, the present–day mixes taken from Dressler’s [morphological mix, local galaxy density]–relation represent mean values about which he found a scatter of % from cluster to cluster. Secondly, the interpretation that the E and S0 deficits seen in our distant clusters are evidence for further production of these types at subsequent epochs is, with our use of fractional content, not a unique one. A mere drop in the numbers of spirals would be sufficient to cause the E and S0 fractions to rise. Such a scenario cannot be overlooked given the considerable ( mag) fading spirals are known to undergo should their star formation cease (B96, Abraham et al. 1996), thereby effectively removing many of them from apparent magnitude–limited samples such as we have studied here. The possibility that the distant cluster spiral populations are being modified in this way will be discussed in §6.
4.4 Trends in other morphological signatures
As a final step in examining our observed morphologies, we focus on the subset of objects showing evidence of dynamical interactions, containing satellites, and exhibiting structural abnormalities. In particular, we examine whether they show any spatial gradients or segregation within the regions covered by our WFPC-2 imagery. Any variations of this nature may further constrain what physical processes are at play; for example, cluster tidal forces (Byrd & Valtonen 1990, Valluri 1993) which increasingly distort galaxies as they come close to the center, the process of violent relaxation which may mix the cluster uniformly but also destroy interacting systems (Gunn & Gott 1972), or “galaxy harassment” where a combination of two–body and tidal forces combine to disrupt low surface brightness galaxies and those with low central concentration (Moore et al. 1996).
A visual assessment of the spatial distribution of dynamically interacting (M/I/T) systems within our cluster fields is easily gained from the positional/morphological maps of Figure 2. Here we see no evidence for any strong clustering of these objects nor any evidence that they avoid the densest regions of the clusters. At most there is an indication in AC 103 and AC 118 that they are located preferentially near the peaks in galaxy density – top right– and bottom left–hand corners of the AC 103 field and left/below center in AC 118 – but it is hardly convincing. To be more quantitative, we have analysed the number of M, I or T types (as a fraction of the total cluster population) as a function of radius from the cluster center. The data for AC 114 are shown in the bottom panel of Figure 5; this shows the fraction of M/I/T systems remains relatively constant at % with the fluctuations about this being no more than that expected statistically (Gehrels 1986). Although not plotted, AC 118 shows a similar flat behaviour out to its radial limit of kpc, albeit about a lower mean fraction of 12%. The same analysis was not attempted for AC 103 due to its lack of adequate statistics and its irregular structure.
The statistics on those systems showing structural abnormalities or containing satellites are small and so only broad conclusions can be drawn about their distribution within the clusters. With the exception of one or two cases, all the identifications of structural abnormalities occurred amongst spirals, their arm structure having been listed as either “assymetric” or “distorted”. We therefore compared the incidence of these abnormal spirals in and out of the core regions in AC 114 and AC 118, with the contamination by field spirals taken into account. In AC 114, there is no evidence to suggest that such systems are any more abundant in one region than the other; about 1 in every 5 cluster spirals appears to have this peculiar arm structure right across the cluster (0–0.5 Mpc). In AC 118, there is marginal evidence that the incidence of these galaxies is greater outside the core but the factor of increase is only significant at the 2 level.
For those galaxies identified as having one or more satellites, a total of 9 were found in AC 103, 7 in AC 114, and 5 in AC 118. Yet again we see cluster-to-cluster differences in their distribution rather than the same general trend across all 3 clusters. In AC 118 it is notable that all the galaxies with satellites are located within the central 1.0 arcmin core whereas in AC 103 and AC 114 they show no such preference. These observations must be treated with caution, however, as our cataloguing of these systems is not in any way complete.
5 Morphology and Star Formation
Spectroscopy of the clusters studied here, as indeed with other distant clusters, has linked the BO–effect to higher levels of star formation, much of which is of an intense and short-lived nature (Dressler & Gunn 1982, 1983; CS). We now address the morphological nature of these highly active systems on a case by case basis. This follows on from Paper I where we first examined the connections between star formation characteristics and morphology. However, on that occasion we were frustrated by the rather small sample of objects at our disposal, particularly active blue members. With our sample now considerably expanded both in terms of the number of clusters imaged with and the numbers of spectroscopically confirmed members with reliable star-formation typings, we are in a position to draw much firmer conclusions on this issue.
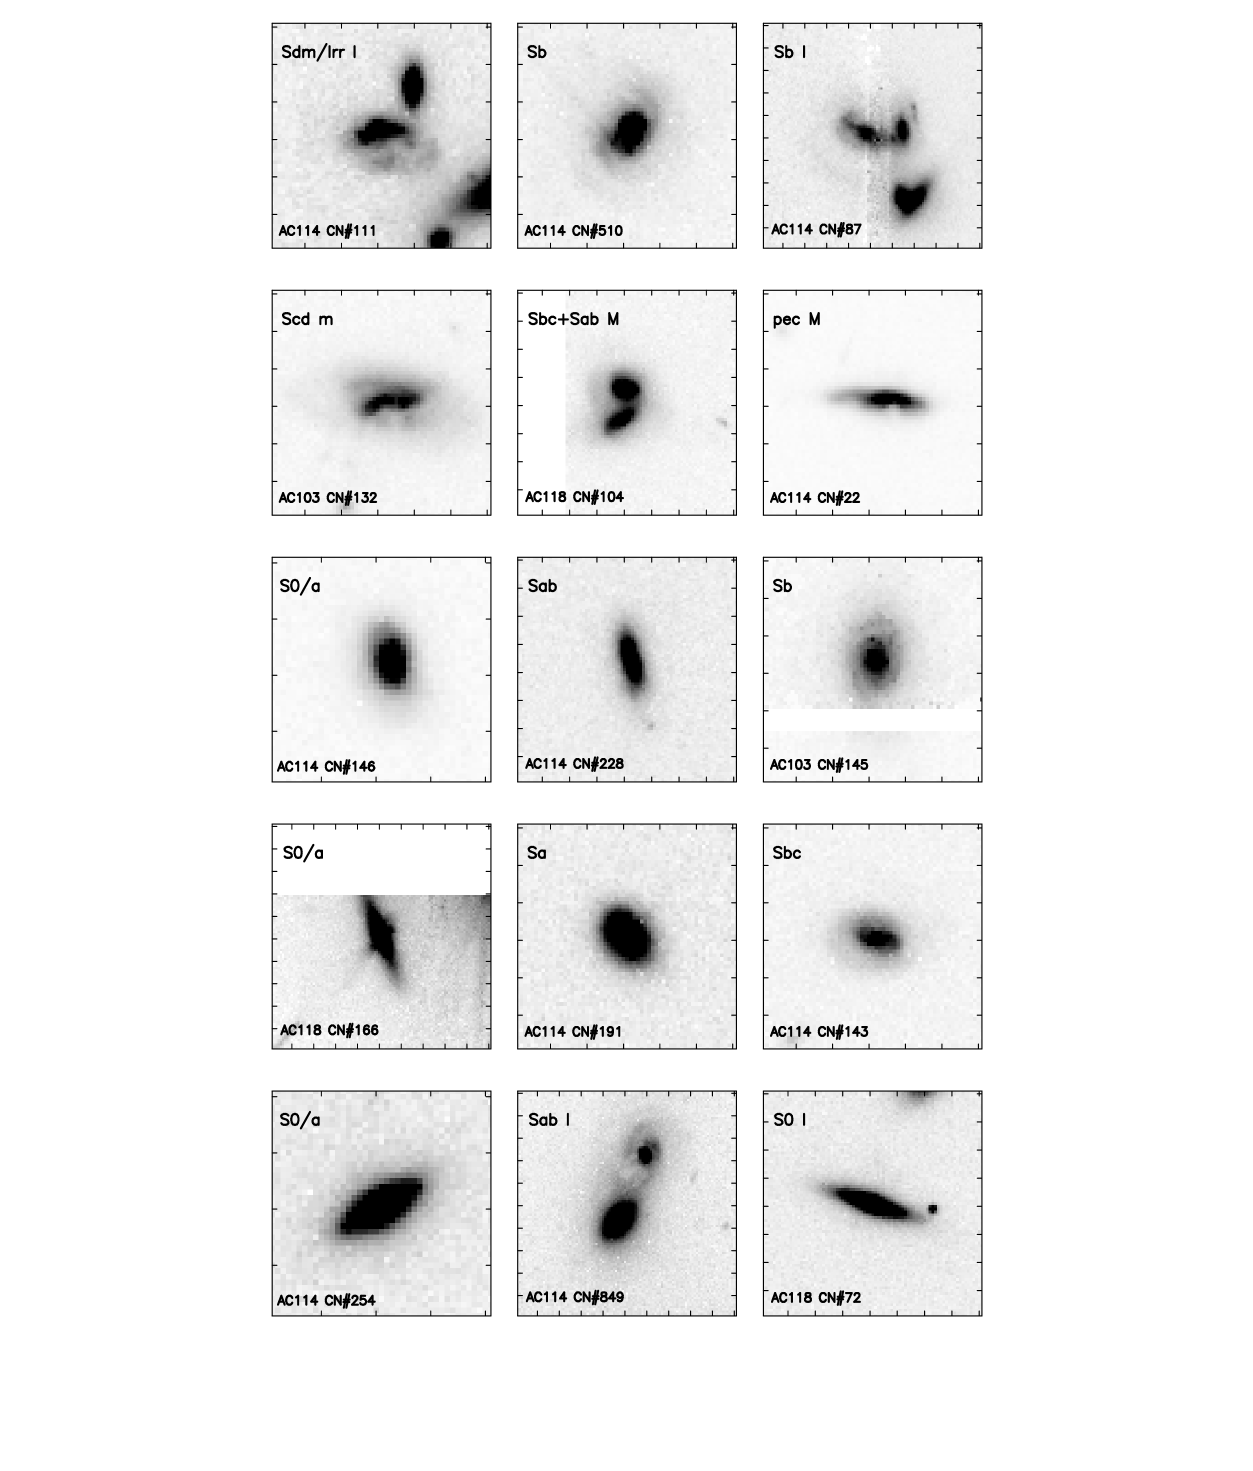
In Figure 6 the WFPC-2 images of the spectroscopically identified ‘active’ members in AC 103, AC 118 and AC 114 are assembled and grouped according to their star formation typings (SB, PSG, Sp, HDS; see §2.2). The SB and PSG galaxies are shown in Fig. 6(a). The former, which occupy the top row, are objects genuinely undergoing a major burst of star formation with high-excitation emission line-dominated spectra similar to local examples of starburst galaxies and rest-frame colors equally as blue (see CS). The PSG objects which follow, are displayed in order of increasing , the time that has elapsed since the completion of their most recent star formation. This can be estimated from their position in the [EW(H), (-)]-diagram using the model tracks of CS and B96. Going from left to right across each row and down the mosaic, the first 7 objects are estimated to be seen at Gyr, the next 4 at Gyr, and the final object at Gyr. Of these, the objects shown in the second row of Fig. 6(a) are the most unambiguous in terms of having a starburst event in their recent past; their colors are simply too blue [] and their H equivalent widths too large (Å) to be consistent with the truncation of star formation in just a normal spiral galaxy. For the remaining objects it is not so easy to distinguish them from “truncated spirals” although in the cases of AC 114#228, AC 118#166, AC 114#191, and AC 114#849, their positioning very close to or below the spiral galaxy sequence in the [EW(H), (-)]–plane favours more a starburst history (see CS for further details).
The most conspicuous feature of this set of objects is the number which are unambiguously interacting and/or merging, with 2 of the 3 SB galaxies and 3 of the 10 PSG galaxies having an I or M classification. Furthermore, they are all major mergers/interactions in which the participating galaxies are both luminous and of similar size. Our WFPC-2 images of CN#111, 87, and 22 in AC 114, of course, reconfirm the interacting/merging nature of these objects first reported in Paper I. However, we now see much more clearly the morphology of the individual galaxies that are involved. What is even more significant is that all but two of the 6 galaxies for which we have the clearest spectroscopic and photometric evidence of starburst activity (top two rows of Fig. 6a) are undergoing major mergers/interactions: Although our sample of such objects is small, it provides a strong indication that dynamical interactions are a major driver of the starburst activity seen in these clusters. Our observations also fit nicely with the sequence of events predicted by the simulations whereby the very active period of star formation triggered by the interaction/merger occurs close to the time we see them here of final approach and coalescence (Mihos 1995). In addition, the galaxies involved are mid- to late-type spirals, consistent with the gas–rich systems required to sustain such a strong burst of star formation (CS).
Whilst having established this important link between interactions/mergers and starburst activity, it clearly is not unique: we see starburst objects where major interactions/mergers could not possibly be responsible for their star formation activity. The two cases in point are AC 114#510 and AC 103#132. The former, which is caught undergoing a starburst, has the morphology of a normal mid–type (Sb) spiral galaxy, albeit with a noticeably higher central surface brightness. It is perhaps also of note that this galaxy is considerably further from the cluster center than the other two SB galaxies (500 kpc cf. 100–200 kpc). AC 103#132 is a late–type Scd spiral with somewhat peculiar internal structure. One interpretation of this structure is that it has undergone a minor merger but the evidence is hardly convincing (hence the “m” classification).
A further conspicuous division seen amongst the galaxies of Fig.6(a) is the common and quite distinct morphology of the bottom set of 7 objects, with all but one of them being normal, isolated S0–Sb types. Whatever the exact details of recent star formation are in these galaxies (ie. starburst, truncated spiral, or otherwise), clearly the end-products are early–type disk systems. While this identifies one evolutionary path at least that leads to the production of S0s, it raises other questions. For example, can any of these objects really be the descendants of the merging/interacting–type systems seen in the top two rows of Fig. 6(a)? We shall defer discussion of this issue until the next section.
We next move on to the sample of 8 “Sp” types which have spectra and broad–band colors similar to present–day spiral galaxies; their images are presented in Figure 6(b). They show CS’s spectral/color–based classification to be 100% successful in identifying galaxies which are true spirals in the morphological sense. The fact that 7 of these spiral members are of Sb Hubble type or later further emphasises the late-type composition of the blue spiral population in these distant clusters (see also Oemler et al. 1997). Our images also convey a strong visual impression of what feeble and low surface brightness objects some of these galaxies – particularly the later types – would be in the event of their star formation ceasing and the associated bright knotty regions being no longer present. That some of these spirals will simply fade from view when the star formation in their disks is eventually extinguished is clearly a distinct possibility. It is also of note that this set of galaxies is not without its irregularities. AC 114#243 and AC 103#134 are clearly interacting with or tidally distorted by their close neighbours while AC 114#155 has tidal arm structure highly suggestive of a recent merger. We would stress, however, that galaxies in this class do not share the more definitive merging characteristics of the SB and PSG types. As already discussed, another important irregularity seen in many of the spirals is a strong asymmetry in their spiral arm structure (see §4.4). Such a peculiarity in the detailed structure of spirals in the rich cluster environment at these redshifts appears to be common; a more rigorous quantification of this effect based on a much larger sample of spectroscopically confirmed cluster spirals can be found in Dressler et al. (1997b).
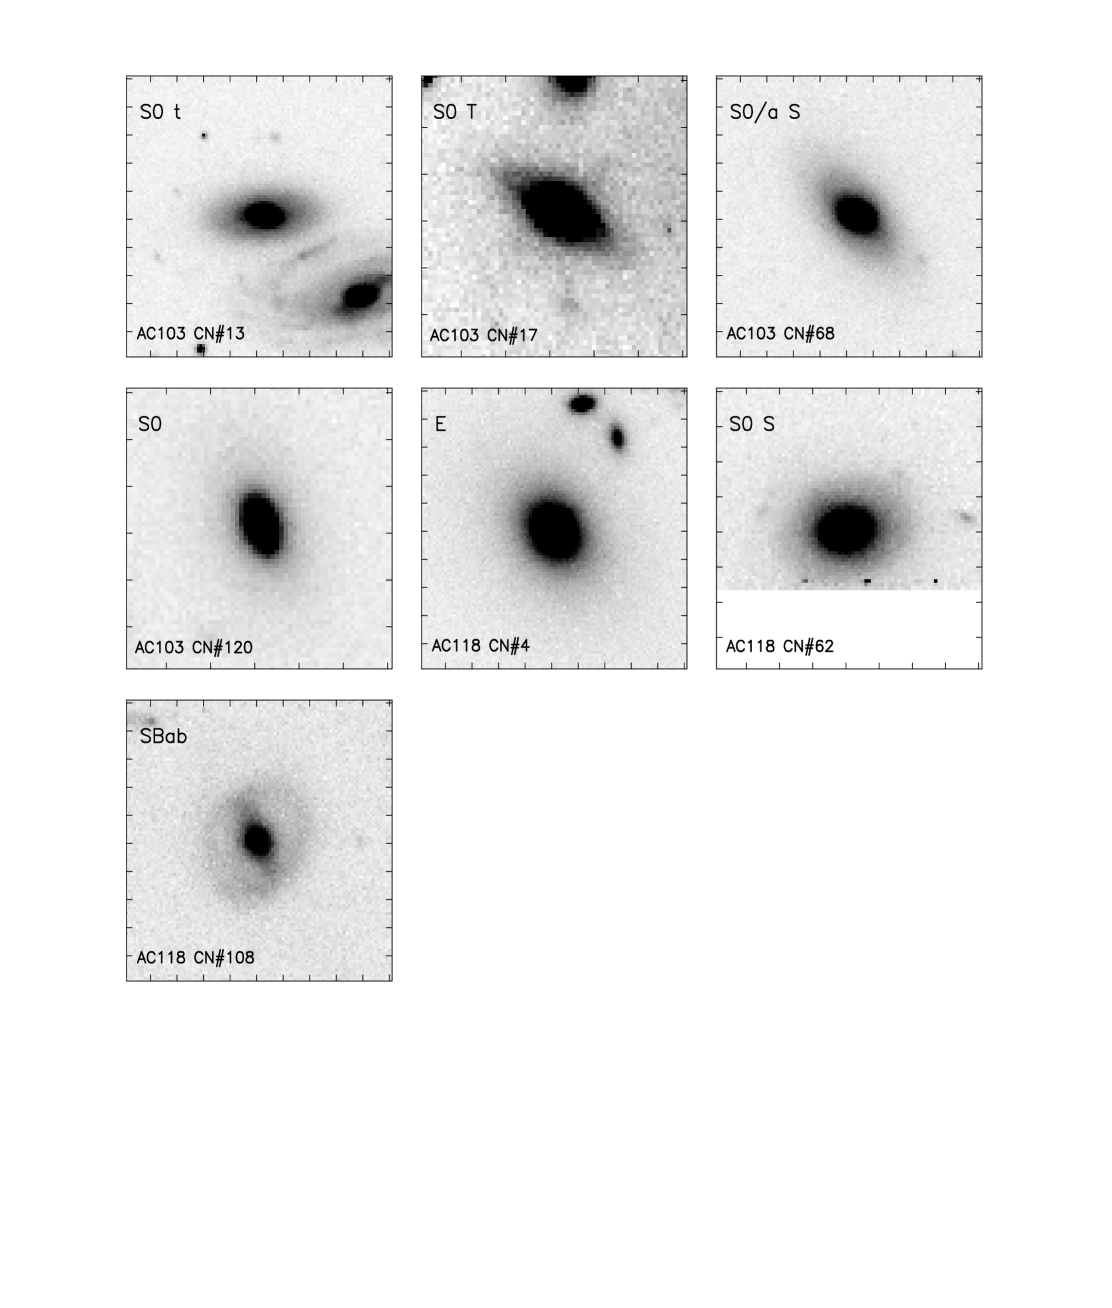
Figure 6(c) contains the images of the red HDS types. It can be seen that the large majority (14/16) of these objects are normal, mostly isolated E or S0 galaxies. This confirms the conclusion of Paper I that these objects are spheroid-dominated systems, although with twice the sample of objects and the better quality data we have here, it is now apparent that they are not preferentially ellipticals but instead comprise a 35%:65% mix of E and S0s, respectively. Our profile fitting technique (§3.2) has been crucial in this context, establishing that objects AC 114#4, AC 114#858, AC 114#89 and AC 118#4 are bona fide ellipticals rather than face-on S0 galaxies.
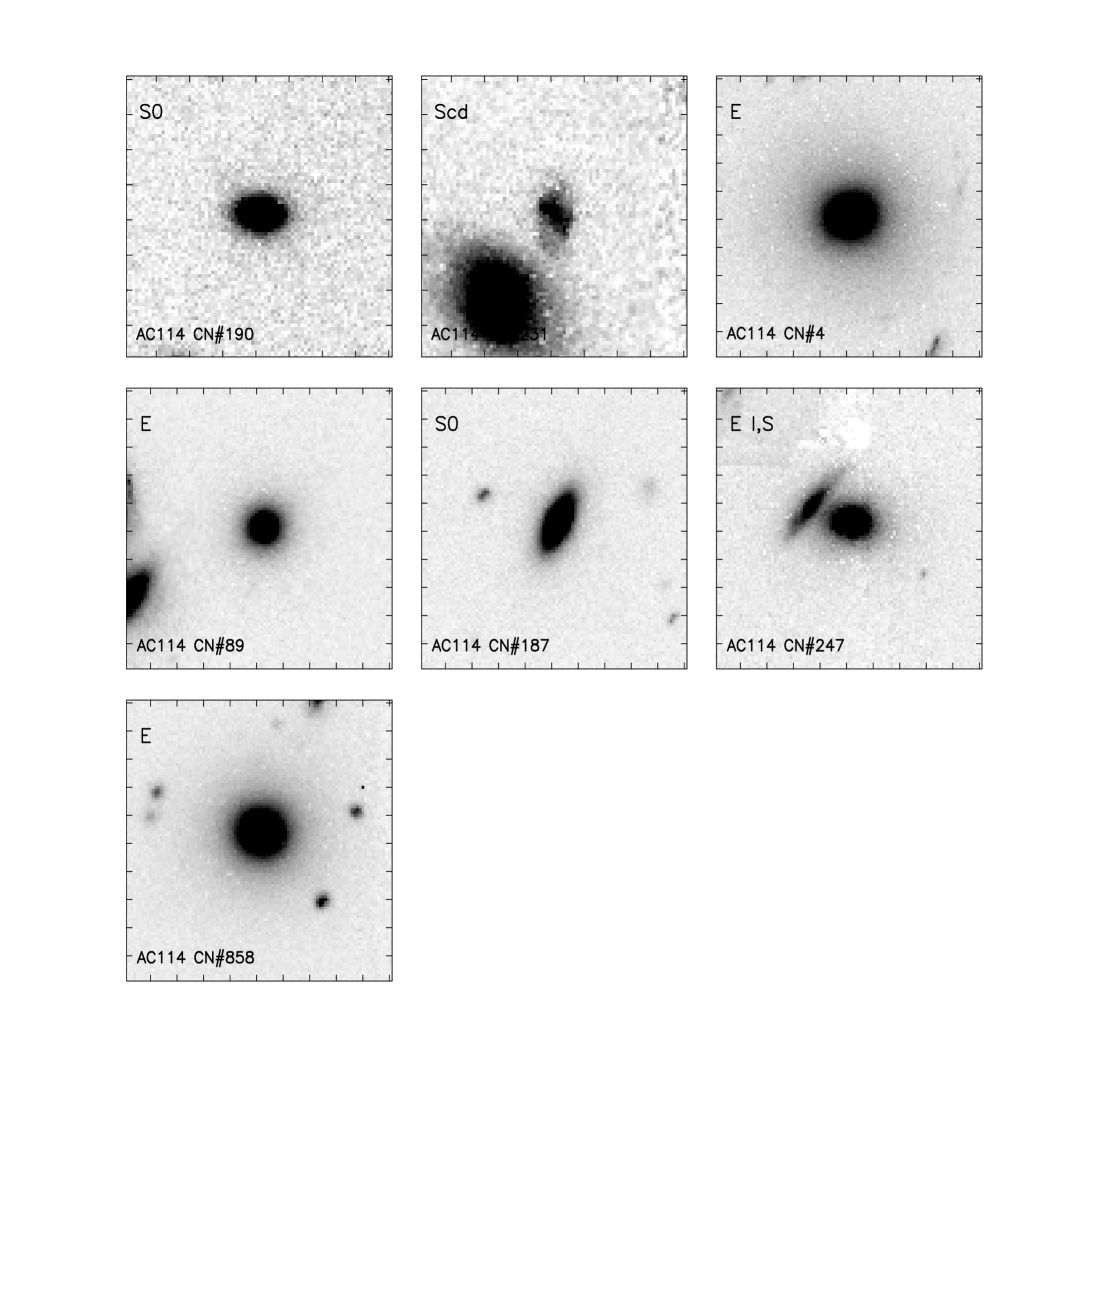
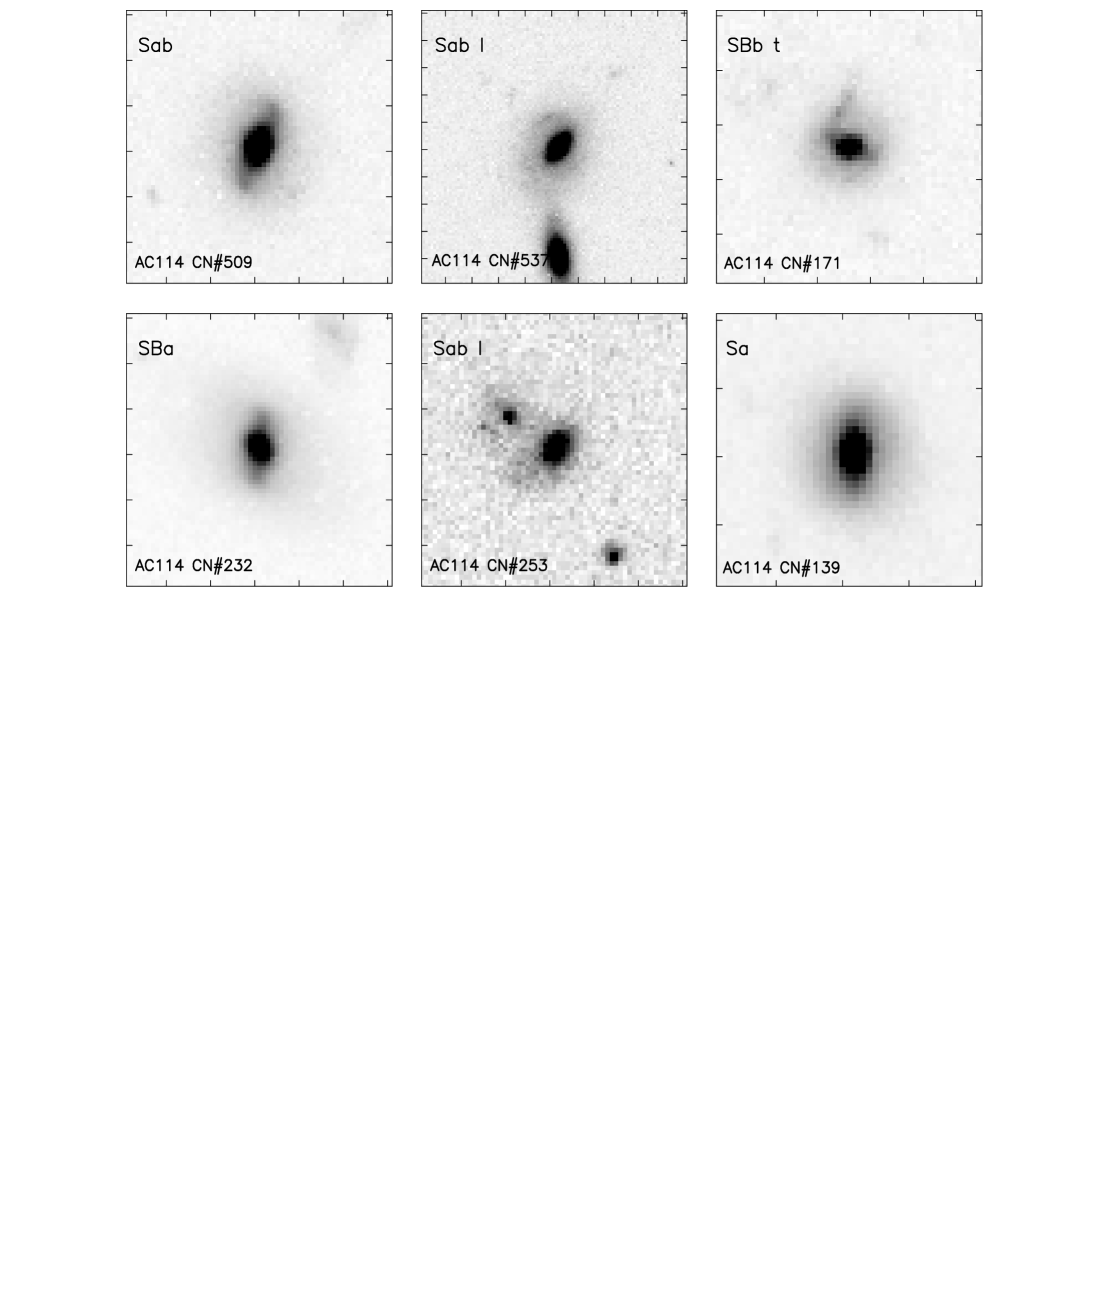
The purpose of Figure 6 has, up to this point, been to examine and discuss the morphology of the ‘active’ (SB, PSG, Sp, HDS) cluster members. The morphologies of the 72 “Psv” and 8 “Psv(pec)” galaxies whose images have not been shown also deserve comment, in particular whether the former are consistent with their spectroscopic and photometric classification of being identical to present-day E or S0 galaxies (CS). By and large we find this to be the case with 59 (82%) of the Psv types having Hubble types of E, E/S0, S0 or S0/a. The 13 remaining objects in this sample are all early-type (Sa, Sab, Sb) spirals; a representative collection of these objects is shown in Figure 6(d). Although it is only a small sample, it is interesting to note that all but one of the 8 Psv(pec) galaxies have an S0 or S0/a classification.
Whilst we expect some fraction of the spiral population in clusters to be as red as the E and S0 populations (Butcher & Oemler 1978b), such objects would be expected to have some on-going star formation and, strictly, should not be included in the “Psv” spectroscopic class due to their [OII] emission. On the other hand the strength of [OII] emission in present-day spirals, at least, is correlated with their color in the sense that the reddest objects have the weakest emission (Dressler & Gunn 1982, CS). It could well be the case that we struggle to detect [OII] emission in such objects given the expected weakness of this feature (EWÅ), the limited S/N of our spectra and the limited size ( arcsec) of our spectroscopic aperture. A reexamination of the spectra shows this is likely in some but not all cases. Whereas objects CN#253 and CN#171 in Fig. 6(d) have spectra with a S/N insufficient to rule out [OII] emission at the EWÅ level, objects CN#509, CN#537, CN#232, and CN#139 all have much superior spectra in which [OII] emission has to be absent at the EWÅ level. Clearly high S/N spectroscopy of the light integrated over the full disk of these galaxies would be valuable in clarifying their emissive nature (or otherwise). Nonetheless, we note that all these galaxies have smoothly–textured and rather diffuse spiral arm structure similar to that of the ‘anaemic’ gas–deficient spirals identified by van den Bergh (1976) in nearby rich clusters. This is suggestive of a family of ‘dead’ spirals which have possibly had their star formation extinguished through gas removal or gas starvation processes (Gunn & Gott 1972; Larson, Tinsley & Caldwell 1980).
Finally, our systematic inspection of galaxy morphology according to star formation class has revealed numerous examples of dynamically interacting systems amongst all types. We conclude this section by taking an inventory of the numbers of M/I/T systems within the different spectroscopic classes and properly assessing the statistical significance of their rate of occurrence in each. The data are presented in Table 6 with the numbers for each cluster listed individually and, to maximise the statistics, in combined form as well. The numbers in parentheses are those where the m, i, and t systems have also been included; for completeness, the numbers of objects recorded as having satellites (Sat classification) are also listed. Despite the numerous cases of major mergers/interactions found amongst the SB and young PSG types (§5 and Fig. 6a), the galaxy samples involved still remain small even when combined across all three clusters. When subjected to a formal error analysis (based on binomial small number statistics; Gehrels 1986) we see that the higher incidence of dynamical interactions amongst the SB and PSG classes in comparison to the other (Sp, HDS and Psv) types is yet to be established with any statistical significance. The most we can conclude from our data is that dynamical interactions occur at a significantly higher rate (%) across the blue active (SB+PSG+Sp) population in comparison to the Psv population (rate = %). There is also a suggestion that the merger/interaction rate amongst the HDS population is at the same, lower level as the Psv population although better statistics are needed to confirm this. Table 6 also serves to highlight the fact that AC 103 is somewhat of an exception in that its population of blue active galaxies contains no undisputed cases of mergers or interactions (M or I class objects). Whilst the statistics are even poorer in this individual case, it is of note that AC 103 has quite different global properties to AC 114 and AC 118, being significantly poorer (CN) and having a much lower lensing-inferred mass (Smail et al. 1997b; see §6). Perhaps even more relevant in this context is the virialisation process within AC 103 which, on the basis of its redshift distribution (see also §6), would appear to be more advanced than in the other two clusters with the consequence that merging/interacting systems are possibly disrupted.
6 Discussion
In this paper we have examined the morphological mix exhibited by the galaxy populations in a sample of 3 distant clusters all at the one look–back time, Gyr. We have studied this both globally and in more detail by concentrating on spectroscopically confirmed members categorised according to their current or recent star formation activity. Our analysis has provided a detailed view of the morphology of galaxies within clusters at an earlier epoch across a range of environments and cluster type. The challenge remaining is to piece together the trends seen at this era across the different classes of object and between the 3 clusters into a unified evolutionary picture which accounts for the observed changes in star formation activity and morphological content at subsequent times. A parallel aim in doing so is to glean clues about the physical processes responsible for these changes.
A simple question to ask at the outset is whether the various sub-populations identified in the distant clusters can be successfully described as different stages of a single evolutionary cycle, rather than as a collection of unrelated objects. This issue has been addressed in detail by B96 whose careful modelling showed that the SB, PSG and HDS types, at least, are consistent with sequential phases of a single evolutionary cycle, involving secondary star formation in a cross–section of cluster galaxies. This conclusion was not based solely on reproducing galaxy colors and spectra using evolutionary burst models (as in CS), but also in accounting for the numbers of objects observed in each phase, having properly taken into account the evolutionary time-scales, the changes in luminosity associated with the starburst, and the selection of the spectroscopic samples. It was shown that the relative numbers of SB, PSG, HDS, and even quiescent Sp types observed in AC 103, AC 118 and AC 114 were best reproduced by a model population in which starbursts take place stochastically in % of the objects over a Gyr period prior to the epoch of observation. Whilst this modelling places only mild constraints on the detailed characteristics of the starbursts, it demonstrated the viability of an evolutionary connection between some subset of the SB, PSG, and HDS types. Galaxies in these classes, therefore, need not be considered in isolation but also as the possible antecedants/descendants of each other.
In the framework of this proposition our morphological study has uncovered two striking trends which may be of major importance in further testing the single cycle model of B96. Firstly, the ‘older’ ( Gyr) PSG galaxies are all early–type disk (S0–Sb) systems whereas the HDS population comprises a mixture of these types plus ellipticals as well. Secondly, the majority of the galaxies seen in the actual starburst phase or very soon after are involved in major interactions/mergers, thereby suggesting that this process is the predominant trigger of this activity. The fact that we see numerous galaxies in the interacting, pre-merger phase adds strong support to this. Not only do they provide direct evidence of interactions/mergers taking place, but they also imply the process to be widespread given the expected brevity ( Gyr; Mihos 1995) of this phase. However, an important question remains: can the observed morphologies of the evolved PSG and HDS types be reconciled with their formation through recent mergers and, if so, do we constrain the nature of these mergers?
Dealing first with the remnant morphologies expected from major mergers, there are potentially two problems for this type of merger picture: Firstly, there is a long–established result from simulations that major mergers of disk galaxies have remnants which show pure de Vaucouleurs () profiles, with little or no disk component remaining (Negroponte & White 1983; Barnes 1988; Hernquist 1993). However, all the older PSG types are disk systems and E galaxies make up only % of the HDS population. This would indicate that the high proportion of galaxies with disks seen amongst the older PSG and HDS categories are not formed through major mergers. The second problem for the major merger scenario relates to the tidal debris that is predicted to surround the remnants of major mergers for Gyr after coalescence (Mihos 1995). Mihos’ simulations showed that although faint, it should be clearly visible on WFPC-2 images of the depth attained in this study, and yet we see no evidence of debris around the younger PSG galaxies, where we would estimate that they are viewed within the appropriate period, Gyr, after the merger. However, it is possible that the cluster environment has additional effects on the visibility of this debris, perhaps stripping it to form intracluster light, although such a process might also have substantial effects on the galaxy in its own right. Nevertheless, unless there are shortcomings in our understanding of major mergers, it seems unlikely that the majority of the PSG and HDS types are the remnants of this kind of event.
In terms of outcomes, “minor” mergers in which galaxies accrete satellite or dwarf galaxies can be quite different and less constraining. Although these events lack the visibility associated with the early stages of a major merger, this may be more than compensated for in the much larger pool of dwarf galaxies available to fuel minor mergers. Moreover, whilst minor mergers can significantly disturb the structure of a galaxy, they can do so without destroying their disks (Quinn et al. 1993). Schweizer (1996) has even argued that they can contribute to S0 formation. Although none of our galaxies show unambiguous evidence of undergoing a minor merger, it is conceivable that features such as the high central surface brightness of the SB galaxy AC114#510 and the disturbed appearance of the PSG galaxy AC103#132 (as well as a number of the Sp types) result from this process, taking Quinn et al.’s simulations as a comparative guide.
Another important consideration in this context is the selection effects that come into play in defining our samples of SB, PSG and HDS objects. Of particular importance is the sizeable increase in luminosity that accompanies starburst activity thereby considerably enhancing the visibility of these objects in the SB and early PSG phases, but in contrast making them significantly fainter in the later PSG and HDS phases (B96). We have attempted to minimise the bias this might have on our spectroscopic samples by largely basing their selection on infrared magnitudes (see §2.2). However, even in this band a mag rise and fall in luminosity is seen at the beginning and end of the starburst phase (Fig. 2, B96); the galaxies in the top two rows of Fig. 6(a) would therefore seem destined to fade by this amount by the time they get to the late PSG phase. This would be sufficient for at least 4 of these galaxies (AC 114#111, AC 103#132, AC 118#104, AC 114#22 all with ) to drop below the selection limit of our spectroscopic samples (). Hence if the infrared luminosities of the starburst systems we see here are representative of the population of cluster members that experience this phenomonen – that is they are of modest luminosity with mag – then it is no surprise that the end–products are largely missing from our current samples, having faded to join the clusters’ dwarf galaxy population.
Despite these questions over the identification of the post–merger population, the fact remains that we see dynamical interactions actually taking place, not just amongst the starburst objects but across the whole cluster population (§5). This seems contrary to the notion of a “hot” cluster environment where the relative velocities between galaxies exceed their internal values thus making strong interactions unlikely. However, this objection may well be a naive one for two reasons: Firstly, theoretical work by Mamon (1992) and Makino & Hut (1997) has shown that interactions/mergers do still occur in rich clusters at levels sufficient to influence the evolution of galaxy systems despite the high relative velocities. Secondly, and perhaps more importantly, the assumption of a “hot” virialised environment in the clusters we observe here is not necessarily a valid one. If we look at the cluster redshift distributions assembled from all the available spectroscopic data (Figure 7), all three show varying degrees of incompatibility with the pure Gaussian form expected for a virialised population. AC 114 and AC 118, in particular, show the greatest deviations in this context. Whilst the former does contain a major gaussian component – centred at and seemingly associated with the virialised core ( kpc) region identified by lensing studies (Natarajan et al. 1997) – a second velocity sub–component centred at is also clearly present. AC 118 shows no overall gaussian behaviour whatsoever and, instead, appears to be a collection of at least two velocity sub-structures. Indeed the unrelaxed state of AC 118 is further emphasised by X-ray and gravitational lensing studies. Masses inferred from the weak lensing shear observed for background sources in the field of AC 118 would, if the system was virialised, result in a velocity dispersion 70% smaller than that observed (Smail et al. 1997b). In addition, the shear map derived for AC 118 in this study together with the map of the hot X-ray gas obtained with the ROSAT PSPC (Bower et al. 1997) show this cluster to have two well resolved mass sub–components which are presumably coalescing.
As encouraging as this might be to understanding why the conditions within our clusters are favourable towards dynamical interactions, it still has to be born in mind that the observed incidence of this phenomenon (20% over our 3 clusters; Table 6) is considerably higher than that seen in any environment nearby. Even in the Hickson compact groups – recognised as being the most favourable environments locally for galaxy interactions and mergers – show a merger fraction of only 6% (Zepf 1993). Clearly the evidence from this study together with the similarly high fractions of interacting/merging systems observed in other distant clusters (e.g. Paper I, Oemler et al. 1997) point to a significant evolution in the rate of interactions and mergers between these earlier epochs and the present day.
A useful theoretical framework in which such evolution might be explained and the assemblage of clusters through the merging of mass sub–components (as seen in AC 118) is a major feature, is provided by the “hierarchical” clustering models described and developed in various ways by Bower (1991), Kauffmann (1995a,b) and Baugh et al. (1997). Of key importance in this scenario is that the distant clusters we observe here have had quite different evolutionary histories to their present–day counterparts, undergoing a much shorter and more turbulent period of merging prior to virialisation. As the above studies have shown, this has important evolutionary implications for their galaxy populations, with the most massive systems predicted to show the strongest effects. Evidence for this within our sample is suggestive if not conclusive: The absence of any detectable lensing signal in the direction of AC 103 indicates that it has a central mass approximately an order of magnitude less massive than AC 118 and AC 114 (Smail et al. 1997b, Natarajan et al. 1997). Notably, this cluster has the highest core spiral fraction of our three clusters (see Table 5) and shows the smallest incidence of interacting/merging amongst its blue population (see §5); however, its blue galaxy excess within kpc of its center is no different to that of AC 118 and AC 114 (CS) and it has a similar population of active (SB, PSG, HDS) types. At the other extreme, studies of the ‘strong’ and ‘weak’ lensing effects seen towards AC 114 (Smail et al. 1995a, Natarajan et al. 1997) indicate that it has a very massive and deep central ( kpc) potential and it is in this very region where we see the most evolved morphological mix within our 3 clusters (§4.2). Clearly a bigger sample of clusters with well determined lensing–based mass distributions are needed to better clarify such trends.
Finally, on the question of mechanisms, we are faced with a clear dichotomy amongst the population of active cluster members: there is a distinct subset of objects undergoing major interactions/mergers but there is an equally conspicuous collection of objects where this process is unlikely to have played any part in their recent evolution. For the former, the interacting/merging process provides a natural mechanism for triggering and then truncating a burst of star forming activity and, at the same time, producing systems with a spheroid morphology. For the latter – particularly the population of normal disk systems (Fig. 6a,b) – it would seem some other mechanism is responsible for the demise, at least, of their star formation activity. Numerous alternative mechanisms have been suggested and discussed in the literature: ram pressure stripping (Gunn & Gott 1972, Kent 1981), galaxy infall and interactions with the intracluster medium (Bothun & Dressler 1986), tidal compression by the cluster gravitational potential (Byrd & Valtonen 1990, Valluri 1993), and “galaxy harassment” via high speed impulsive encounters (Moore et al. 1996).
The recent study by Abraham et al. (1996) of the rich cluster Abell 2390 at has refocussed attention on galaxy infall, showing it to be a process of major importance in this cluster’s development and the evolution of its galaxy population. Their evidence was based on comprehensive color, spectral, dynamical and coarse morphological information on galaxy members going out to very large radii ( Mpc), which revealed gradients in these properties consistent with the cluster being fed and built up by an infalling population of field galaxies. If what is seen in A 2390 is a widespread phenomenon in clusters, then the Abraham et al. study would indicate we should at least see the remnants of this infalling population even within the much smaller fields studied here. Given the infallers should be predominantly normal spirals whose star formation is halted upon entry into the cluster, the remnants will be identifiable via their “truncated spiral” type spectra/colors and morphologies consistent with the later phases of a spiral anaemic spiral S0 transformation sequence. Certainly these characteristics have been recognised amongst our cluster members. As discussed in the previous section, some of the older PSG types shown in the bottom 3 rows of Fig. 6(a) have spectra and colors equally well explained by truncated star formation in a normal spiral. In addition they are all disk galaxies with either an S0 or early-type spiral morphology as might be expected. Another set of candidates is the ‘dead’ spirals with their passive–type spectra/colors and anaemic spiral morphology (Fig. 6d). Importantly though, we also see in our clusters spirals undergoing normal star formation which raises the question as to why they have managed to survive? Their distribution in redshift (Fig. 7) gives no (limited) indication that they are peripheral objects and hence perhaps early infallers. Alternatively, we might be seeing them after just one or two crossings of the cluster, which are insufficient to completely wipe out their star formation activity.
Turning to the galaxy harassment scenario (Moore et al. 1996), it is particularly interesting as it makes quite specific predictions as to the duration of the visible phase of this process and the morphological signatures that are expected to be seen. Specifically, Moore et al’s simulations of a model spiral galaxy falling into a cluster show the harassment phase to last for several billion years during which the galaxy’s spiral arms are drawn out of its disk and, as such, are subjected to severe tidal distortions (as seen in their Figure 3b). Given the timescale together with the fact that this is expected to be a continuous process, a high fraction of blue disk galaxies showing this type of distortion should be seen over a wide range in redshift. An inspection of our distant cluster galaxy morphologies reveals only 3 possible cases of spirals in this harassed state (AC 118#438, AC 114#1.147, and AC 103#62), but these examples are far from dramatic. Furthermore, according to Moore et al., disturbed spirals are likely to be accompanied by starbursts, but our SB category does not show any distorted spirals. While this casts some doubt as to the widespread operation of galaxy harassment within our clusters, it is perhaps premature to rule it out entirely. The main reason for this is that Moore et al’s simulations have explored only a small region of parameter space in terms of the properties (luminosity, morphology, etc) of the harassed galaxy; more comprehensive simulations of this process will better establish its importance.
The data presented here on three clusters of intermediate redshift further emphasise the rapid evolution in morphological content and star formation activity that has occurred in rich clusters over the last one third of a Hubble time. Fundamentally, however, this tracking of cluster galaxy morphology back in time both by our study and even further by the MORPHS study (Smail et al. 1997a, Dressler et al. 1997a) has revealed the changes to be one of morphological mix rather than one of basic galaxy structure: the same basic Hubble types we see today are in place in clusters at 0.3–0.5. Nonetheless, the epoch when this basic structure formed in cluster galaxies would appear to be within grasp. Observations of clusters at with by Dickinson (1997) and Faber et al. (1997) reveal galaxy populations dominated by chaotic and fragmented systems bearing no resemblance to the normal Hubble types seen in the clusters at . Clearly the interval merits similarly detailed attention if we are to fully unravel the morphological development of galaxies within the rich cluster enviroment.
7 Summary
This paper has presented deep, –based high resolution imagery of 3 rich but diverse clusters at from which detailed morphologies of their galaxy populations have been derived and analysed with reference to ground–based spectroscopy and optical–infrared multi–band photometry. The primary results of our study can be summarised as follows:
(1) Our 3 clusters, each of which exhibit a significant blue BO excess, provide further evidence that this effect is linked to the presence of greater numbers of spiral galaxies in these environments at earlier epochs. We find these spirals to be generally of normal Hubble type spanning the full Sa–Sdm/Irr range and, collectively, are present in numbers up to 4 times higher than that seen in the same high density environments nearby. The galaxies directly responsible for the blue BO excess are predominantly of mid to late (Sb–Sdm) Hubble type.
(2) Some indications as to the dependency of this spiral galaxy excess on global cluster environment are provided by our study. In the core ( kpc) regions we find the highest spiral fraction (35%) to be in the least massive, most irregular cluster in our sample (AC 103). In contrast, the morphological mix closest to that seen at the same densities nearby is found in the core of our most massive and regular cluster, AC 114. Furthermore, our study of the outer ( kpc) regions of this latter cluster, where the projected galaxy density has dropped by a factor of relative to the core, reveals spirals to be in excess by a similar factor.
(3) The higher fractions of spiral galaxies in these clusters is accompanied by a deficit in either or both E and S0 galaxies. Although still substantial, the deficit in S0 galaxies seen here at is significantly lower than that seen in rich clusters at (Smail et al. 1997a, Dressler et al. 1997a), indicating a steep downward trend consistent with a quite rapid production of S0s in cluster cores since .
(4) On average, one in every five cluster members (both blue and red) show morphological signatures indicative of dynamical interactions. A similar fraction of the spirals in our clusters also show structural abnormalities in which their arms appear to be mildly asymmetric or distorted. Examination of the spatial distribution of both sets of objects within our clusters shows no convincing evidence that they are clustered in any way or avoid particular regions of the cluster. The fraction of galaxies involved in dynamical interactions appears to remain constant with radius from the cluster center.
(5) Our extensive spectroscopy and multi–band photometry of the clusters in our sample has allowed us to focus on the morphology of those cluster members identified as being currently active in star formation or having been so in their recent past. The very blue galaxies either undergoing a major starburst or having just recently completed one are predominantly systems involved in major mergers. Dynamical interactions appear to be a common cause of this most extreme form of star formation activity seen in these clusters. With the caveat that our statistics are small, the galaxies involved are mostly of modest luminosity ( mag) even in this brightened phase; in their later faded state they appear destined to become dwarfs, too faint to be included in magnitude–limited spectroscopic samples such as ours. The galaxies with ongoing star formation occuring at the rates typical of normal nearby spirals, are mostly normal Sb–Sdm/Irr Hubble types. For the later types in this group, their visibility on our WFPC-2 images is due mainly to their compact, knotty regions of star formation; it is clear they would become quite diffuse, low surface brightness systems if their star formation were to cease.
(6) The galaxies seen at times Gyr after their last major episode of star formation – the blue “PSG” and red “HDS” objects – also show clear morphological trends. The former, whose spectra and colors are consistent with them having either a starburst or “truncated” spiral origin, are all normal early–type (S0–Sb) disk galaxies – a morphology seemingly inconsistent with them having experienced a major merger, at least in their recent past. It would seem that they are mostly descendants of the active spiral population who have had their star formation curtailed by some other mechanism, thereby (as we see directly) feeding the early–type disk populations in these clusters. The HDS objects, interpreted from their spectra and colors as being the remnants of secondary star formation in old dormant systems, have morphologies consistent with this picture, being mostly normal, isolated E or S0 galaxies.
(7) Collectively, these results provide further evidence that the evolution in star formation activity and morphological content associated with the BO–effect involves not one but several physical processes. Only one of these – galaxy-galaxy interactions and merging – can we see at work directly, providing a natural mechanism for triggering and then truncating star formation and transforming galaxies morphologically into spheroidal systems. However, an almost equally conspicuous feature of our samples is the numbers of objects where this process could not have played any major part in altering the course of their star formation activity. Pinpointing what processes are responsible in these cases is a more difficult challenge. To this end our study does provide some important clues: The normal disk morphology of the old “PSG” population together with the anaemic looking spirals found amongst the “Psv” types point to processes which bring star formation to a halt but leave the basic disk structure intact and largely unperturbed. This seems more consistent with the operation of mechanisms which affect just the gas supply (eg. ram-pressure stripping, galaxy infall) rather than all mass components of the galaxy (eg. tidal processes). Indeed as far as “galaxy harassment” is concerned (a prominent example of the latter), we find no evidence of the population of severely distorted spirals that is predicted if the operation of this mechanism is widespread.
References
- (1) Abraham, R.G., van den Bergh, S., Glazebrook, K., Ellis, R.S., Santiago, B.X., Surma, P., & Griffiths, R.E. 1996a, ApJS, 107, 1
- (2) Abraham, R.G., Smecker-Hane, T.A., Hutchings, J.B., Carlberg, R.G., Yee, H.K.C., Ellingson, E., Morris, S., Oke, J.B., & Rigler, M. ApJ, 471, 694
- (3) Aragón-Salamanca, A., Ellis, R.S., & Sharples, R.M. 1991, MNRAS, 248, 128
- (4) Arp, H. 1966, ApJ, 14, 1
- (5) Barger, A.J., Aragón-Salamanca, A., Ellis, R.S., Couch, W.J., Smail, I., & Sharples, R.M. 1996, MNRAS, 279, 1 (B96)
- (6) Barnes, J.E. 1988, ApJ, 331, 699
- (7) Baugh, C.M., Cole, S., Frenk, C.S., & Lacey, C.G. 1997, astro-ph/9703111
- (8) Bertin, E., & Arnouts, S. 1996, Astron. Astrophys.Suppl., 117, 393
- (9) Bothun, G.D., & Dressler, A. 1986, ApJ, 301, 57
- (10) Bower, R.G. 1991, MNRAS, 248, 332
- (11) Bower, R.G. et al. 1997, in preparation
- (12) Butcher, H., & Oemler, A. 1978a, ApJ, 219, 18 (BO)
- (13) Butcher, H., & Oemler, A. 1978b, ApJ, 226, 559
- (14) Butcher, H., & Oemler, A. 1984, ApJ, 285, 426
- (15) Byrd, G., & Valtonen, M. 1990 ApJ, 350, 89
- (16) Carter, D. 1987, ApJ 312, 514
- (17) Colless, M., Ellis, R.S., Taylor, K., & Hook, R.N. 1990, MNRAS, 244, 408
- (18) Couch, W.J. 1981, PhD thesis, Australian National University
- (19) Couch, W.J., Ellis, R.S., Sharples, R.M., & Smail, I. 1994, ApJ, 430, 121 (Paper I)
- (20) Couch, W.J., & Newell, E.B. 1982, PASP, 94, 610
- (21) Couch, W.J., & Newell, E.B. 1984, ApJS, 56, 143 (CN)
- (22) Couch, W.J., & Sharples, R.M. 1987, MNRAS, 229, 423
- (23) Dickinson, M. 1997, in The Early Universe with the VLT, ed. J. Bergeron (Berlin Heidelberg: Springer), p. 274
- (24) Dressler, A. 1980, ApJ, 236, 351
- (25) Dressler, A., & Gunn, J.E. 1982, ApJ, 263, 533
- (26) Dressler, A., & Gunn, J.E. 1983, ApJ, 270, 7
- (27) Dressler, A., Oemler, A., Butcher, H., & Gunn, J.E. 1994a, ApJ, 430, 107
- (28) Dressler, A., Oemler, A., Sparks, W.B., & Lucas, R.A. 1994b, ApJ, 435, L23
- (29) Dressler, A., Oemler, A., Couch, W.J., Smail, I., Ellis, R.S., Barger, A.J., Butcher, H., Poggianti, B.M., Sharples, R.M. 1997a, ApJ (in press)
- (30) Dressler, A., Poggianti, B.M. et al. 1997b, in preparation
- (31) Driver, S.P., Windhorst, R.A., Ostrander, E.J., Keel, W.C., Griffiths, R.E., & Ratnatunga, K.U. 1995, ApJ, 449, 23
- (32) Ebbels, T., Ellis, R.S., Kneib, J.P., Smail, I. 1997, in preparation
- (33) Ellis, R.S., Smail, I., Dressler, A., Couch, W.J., Oemler, A., Butcher, H. & Sharples, R.M. 1997, ApJ, 483, 582
- (34) Gehrels, N. 1986, ApJ, 303, 336
- (35) Glazebrook, K., Ellis, R.S., Santiago, B., & Griffiths, R. 1995, MNRAS, 275, 19
- (36) Griffiths, R.E., Ratnatunga, K.U., Neuschaefer, L.W., Casertano, S., Im, M., Wyckoff, E.W., Ellis, R.S., Gilmore, G.F., Elson, R.A.W., Glazebrook, K., Schade, D.J., Windhorst, R.A., Schmidtke, P., Gordon, J., Pascarelle, S.M., Illingworth, G.D., Koo, D.C., Bershady, M.A., Forbes, D.A., Phillips, A.C., Green, R.F., Sarajedini, V., Huchra, J.P., & Tyson, J.A. 1994, ApJ, 437, 67
- (37) Gunn, J.E., & Gott, J.R. 1972, ApJ, 176, 1
- (38) Hernquist, L. 1993, ApJS, 86, 389
- (39) Holtzman, J.A. 1995, PASP, 107, 1065
- (40) Kauffmann, G. 1995a, MNRAS, 274, 153
- (41) Kauffmann, G. 1995b, MNRAS, 274, 161
- (42) Kent, S.M. 1981, ApJ, 245, 805
- (43) Krist, J. 1992, TINYTIM User’s Manual (Baltimore: STScI)
- (44) Lavery, R.J., & Henry, J.P. 1988, ApJ, 330, 596
- (45) Lavery, R.J., Pierce, M.J., & McClure, R.D. 1992, AJ, 104, 2067
- (46) MacLaren, I., Ellis, R.S., & Couch, W.J. 1988, MNRAS, 230, 249
- (47) Malin, D. F., & Carter, D. 1983, ApJ, 274, 534
- (48) Makino, J. & Hut, P. 1997, ApJ, 481, 83
- (49) Mamon, G.A. 1992, ApJ, 401, L3
- (50) Metcalfe, N., Shanks, T., Fong, R., & Roche, N. 1995, MNRAS, 273, 257
- (51) Mihos, J. C. 1995, ApJ, 438, L75
- (52) Moore, B. Katz, N., Lake, G., Dressler, A., & Oemler, A. 1996, Nature, 379, 613
- (53) Natarajan, P., Kneib, J.P., Smail, I., & Ellis, R.S. 1997, in preparation
- (54) Negroponte, J., & White, S.D.M. 1983, MNRAS, 205, 1009
- (55) Oemler, A. 1974, ApJ, 194, 1
- (56) Oemler, A., Dressler, A., & Butcher, H. 1997, ApJ, 474, 561
- (57) Pence, W.D. 1976, ApJ, 203, 39
- (58) Privett G. 1996, Starlink Software User Note 180
- (59) Rakos, K.D., & Schombert, J.M. 1995, ApJ, 439, 47
- (60) Quinn, P. J., Hernquist, L., & Fullagar, D.P. 1993, ApJ, 403, 74
- (61) Schweizer, F. 1996, AJ, 111, 109
- (62) Smail, I., Dressler, A., Couch, W.J., Ellis, R.S., Oemler, A., Butcher, H., & Sharples, R.M. 1997a, ApJ (in press)
- (63) Smail, I., Couch, W.J., Ellis, R.S., Sharples. R.M. 1995a, ApJ, 440, 501
- (64) Smail, I., Hogg, D.W., Yan, L., Cohen, J.G. 1995b, ApJ, 449, L10
- (65) Smail, I., Ellis, R.S., Dressler, A., Couch, W.J., Sharples, R.M., & Butcher, H. 1997b, ApJ, 479, 70
- (66) Stanford, S.A., Eisenhardt, P.R.M., & Dickinson, M.E. 1996, BAAS, 188, 2106
- (67) Toomre, A. 1977, in The Evolution of Galaxies and Stellar Populations, ed. B. M. Tinsley & R. B. Larson (New Haven: Yale University Press), p. 401.
- (68) van den Bergh, S. 1976, ApJ, 206, 883
- (69) Valluri, M. 1993, ApJ, 408, 57
- (70) Zepf, S.E. 1993, ApJ, 407, 448
| Exposure | |||||||
|---|---|---|---|---|---|---|---|
| Cluster | R.A.(1950) | Decl.(1950) | Date | Filter | P.A.(V3) | (s) | |
| AC 118 | 00 11 47.9 | -30 39 58.6 | 1994 Nov 22 | F702W | 217.0 | 6500 | |
| AC 103 | 20 52 51.5 | -64 50 26.3 | 1995 Jun 10 | F702W | 135.0 | 6500 | |
| AC 114 | #1 | 22 56 02.0 | -35 05 05.3 | 1996 Jan 05 | F702W | 270.0 | 16800 |
| #2 | 22 56 02.0 | -35 03 16.3 | 1996 Jan 05 | F702W | 270.0 | 16800 | |
| #3 | 22 56 10.6 | -35 05 05.8 | 1996 Jan 06 | F702W | 270.0 | 16800 | |
| #4 | 22 55 53.3 | -35 03 16.0 | 1996 Jan 07 | F702W | 270.0 | 16800 |
| Exposure | Seeing | ||||
|---|---|---|---|---|---|
| Cluster | Telescope/Instr | Mask | Date | (s) | (arcsec) |
| AC 103 | AAT/LDSS-1 | #1 | 1995 Aug 28 | 14000 | 1.5 |
| AAT/LDSS-1 | #2 | 1995 Aug 29 | 10000 | 1.7 | |
| AC 118 | AAT/LDSS-1 | #1 | 1995 Aug 29 | 10000 | 1.3–2.0 |
| AAT/LDSS-1 | #2 | 1995 Aug 28 | 15000 | 1.4 | |
| AC 114 | AAT/LDSS-1 | #1 | 1995 Aug 29 | 10000 | 1.4 |
| NTT/EMMI | ‘bright’ | 1995 Oct 22 | 7200 | 0.8 | |
| NTT/EMMI | ‘faint’ | 1995 Oct 23,25 | 7200 | 0.8–1.6 |
| Cluster | Region | Ncl | ObservedaaErrors are 1 confidence limits calculated using the tables published by Gehrels(1986) | Predicted | |||||
|---|---|---|---|---|---|---|---|---|---|
| %E | %S0 | %Sp | %E | %S0 | %Sp | ||||
| AC 103 | WFPC-2 | 84 | 34 | 31 | 35 | 42 | 49 | 9 | |
| AC 118 | WFPC-2 | 100 | 27 | 51 | 22 | 45 | 50 | 5 | |
| AC 114 | 24 | 55 | 39 | 6 | 49 | 49 | 2 | ||
| 36 | 38 | 40 | 22 | 36 | 47 | 17 | |||
| 64 | 19 | 29 | 52 | 31 | 46 | 23 | |||
| 71 | 12 | 24 | 64 | 30 | 47 | 23 | |||
| 46 | 26 | 29 | 45 | 32 | 46 | 22 | |||
| 21 | 14 | 24 | 62 | 31 | 46 | 23 | |||
| WFPC-2bbWFPC-2 sized field centred on the cluster | 117 | 44 | 37 | 19 | 42 | 48 | 10 | ||
| Numbers of objects | PercentagesaaErrors, where quoted, are 1 confidence limits calculated using the tables published by Gehrels(1986) | |||||||
|---|---|---|---|---|---|---|---|---|
| Spectral Class | Total | M | I | T | Sat | (M+I+T) | Sat | |
| AC 103 | ||||||||
| Psv | 17 | 0(0) | 0(0) | 1(3) | 4 | 6(18) | 24 | |
| HDS | 4 | 0(0) | 0(0) | 1(2) | 1 | 25(50) | 25 | |
| PSG | 2 | 0(1) | 0(0) | 0(0) | 1 | 0(50) | 50 | |
| SB | 0 | 0(0) | 0(0) | 0(0) | 0 | 0(0) | 0 | |
| Sp | 3 | 0(1) | 0(0) | 1(2) | 0 | 33(100) | 0 | |
| AC 118 | ||||||||
| Psv | 21 | 0(0) | 5(5) | 2(2) | 3 | 33(33) | 14 | |
| HDS | 3 | 0(0) | 0(0) | 0(0) | 1 | 0(0) | 33 | |
| PSG | 3 | 1(1) | 1(1) | 0(0) | 0 | 67(67) | 0 | |
| SB | 0 | 0(0) | 0(0) | 0(0) | 0 | 0(0) | 0 | |
| Sp | 2 | 0(1) | 0(0) | 0(0) | 0 | 0(50) | 0 | |
| AC 114 | ||||||||
| Psv | 42 | 1(1) | 4(4) | 1(2) | 5 | 14(17) | 12 | |
| HDS | 7 | 0(0) | 1(1) | 0(0) | 1 | 14(14) | 14 | |
| PSG | 7 | 1(1) | 1(1) | 0(0) | 0 | 29(29) | 0 | |
| SB | 3 | 0(0) | 2(2) | 0(0) | 0 | 67(67) | 0 | |
| Sp | 3 | 1(1) | 1(1) | 0(0) | 0 | 67(67) | 0 | |
| Overall | ||||||||
| Psv | 80 | 1(1) | 9(9) | 4(7) | 12 | () | ||
| HDS | 14 | 0(0) | 1(1) | 1(2) | 3 | () | ||
| PSG | 12 | 2(3) | 2(2) | 0(0) | 1 | () | ||
| SB | 3 | 0(0) | 2(2) | 0(0) | 0 | () | ||
| Sp | 8 | 1(3) | 1(1) | 1(2) | 0 | () | ||
| PSG+SB+Sp | 23 | 3(6) | 5(5) | 1(2) | 1 | () | ||
| Total | 117 | 4(7) | 15(15) | 6(11) | 16 | () | ||


![[Uncaptioned image]](/html/astro-ph/9711019/assets/x5.png)
![[Uncaptioned image]](/html/astro-ph/9711019/assets/x6.png)