THE 2dF GALAXY REDSHIFT SURVEY: Preliminary Results
Spectroscopic observations for a new survey of 250 000 galaxy redshifts are underway, using the 2dF instrument at the AAT. The input galaxy catalogue and commissioning data are described. The first result from the preliminary data is a new estimate of the galaxy luminosity function at .
1 Introduction
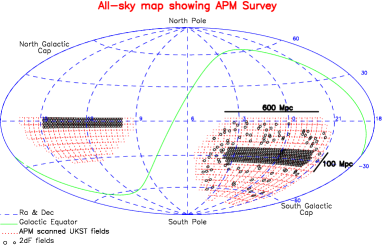
At the end of October 1997, the AAO 2dF instrument (Cannon, these Proceedings) is working reliably with the full 400 fibre system, and the commissioning phase is coming to an end. We are now starting the spectroscopic observations for a redshift survey of 250 000 galaxies, covering 2000 in the southern hemisphere. The survey will have a mean depth of , and a volume of , which is times larger than any present redshift survey (see Fig. 1). The large volume and dense spatial sampling will enable us to quantify statistics of the galaxy distribution on large scales. Updated information about the survey can be found at http://www.ast.cam.ac.uk/~sjm/

2 The Photometric Catalogue
The galaxies are selected from APM scans of UKST Bj plates, analyzed using techniques described by Maddox et al . Accurate positions of galaxies and fiducial stars are vital to avoid light loss outside the fibres, so we have improved the astrometric calibration by correcting for systematic distortions in the Schmidt plates. In addition, APM scans of UKST Second Epoch R plates are used to select fiducial guide stars which have negligible proper motion. These R-plates also provide broad-band colours for the galaxies.
We chose to observe 2000 of the revised APM catalogue at high galactic latitude, where there is little obscuration from Galactic dust. We estimated dust extinction from recalibrated, temperature corrected IRAS 100 emission maps . The survey area consists of: a contiguous block in the SGP; a contiguous block in the NGP; and 100 randomly positioned 2dFs spread over the SGP (see Fig. 2). The magnitude limit is set to match the surface density of galaxies to the 400 fibres per 2dF. At this limit, the integration time required to obtain a redshift () is roughly matched to the expected time to reconfigure the fibres for the next field.
Allowing for the average weather statistics, the galaxy survey will require 80 nights to complete. We merged our target list with the UVX QSO sample of Boyle et al , which was selected from other APM data in the same astrometric system. The combined survey requires 90 nights. In addition, we aim to use the best 10% of observing conditions to measure redshifts for a sample of galaxies . These galaxies are selected from APM scans of UKST 4415 films and should have . Our first scheduled PATT time is planned for January 1998, and we hope to finish the surveys by the end of 2000.

3 Scientific Goals
We will use the survey to address a variety of fundamental problems in galaxy formation and cosmology. Some specific measurements are:
The power spectrum of galaxy clustering on scales Mpc. This allows a direct comparison between galaxy fluctuations and microwave background anisotropies on the same spatial scales.
The distortion of the clustering pattern in redshift space. This measures and so constrains the cosmological density parameter and the spatial distribution of dark matter.
The morphology of galaxy clustering. The topology and shape of the density distribution can test whether the initial fluctuations are Gaussian, as predicted by inflationary models of the early universe.
Correlations between galaxy properties and large-scale structures, and variations in the clustering and velocity distributions of galaxies as a function of their luminosity, type and star-formation history. These two complementary approaches quantify environmental effects which will provide crucial constraints on models of galaxy formation.
The objective classification of spectra using Principal Components Analysis and Artificial Neural Nets. These will give physical insight into the Hubble sequence.
The evolution of the galaxy luminosity function, star-formation rate and galaxy clustering amplitude out to a redshift of .
Clusters and groups of galaxies, and in particular of the infall in clusters and dynamical estimates of cluster masses at large radii.
4 First Results
Up to the end of June 1997, 16 fields of 200 fibres were observed for the galaxy survey during commissioning. 1937 spectra were reduced automatically using the AAO 2dFdr pipe-line software and some also interactively using IRAF. We obtained 782 redshifts by hand, and 1445 by automatic cross-correlation, emission line detection and pca analysis. This gave a total of 1562 galaxies with reliable redshifts.
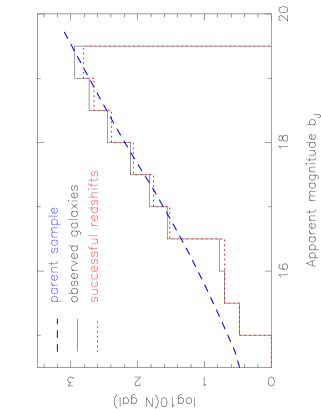
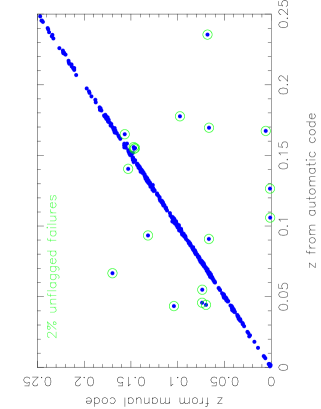
The commissioning data are (not surprisingly) of variable quality, and the average completeness is only 80%. There is very little dependence on magnitude (see Fig. 3). On fields which are as good as we expect for the survey, the completeness is . The unsupervised automatic codes are already highly reliable, giving only 2% undetected failures (see Fig. 4), and we expect this to improve as instrument and software are tuned. The rms velocity error estimated by comparing multiple measurements for 646 galaxies is .
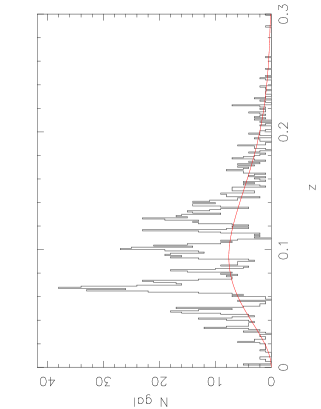
The mean redshift is consistent with our expected value (see Fig. 5). In Fig. 6 the galaxy positions in a redshift space cone plot show strong clustering, with some large structures apparently extending between widely separated 2dFs.
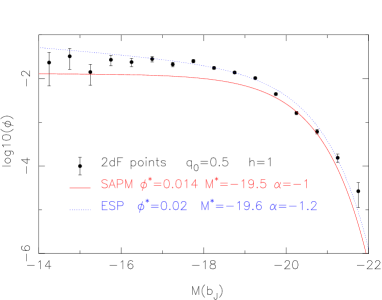
We calculated a preliminary luminosity function, using the standard estimate, and the ratio of the observed to parent magnitude distribution to correct for incompleteness. As seen in Fig 7, the normalization is consistent with that found by the ESO slice project . This is higher than the SAPM result at , even though the SAPM and 2dF samples are selected from essentially the same galaxy catalogue. This strongly argues against the SAPM measurement being low because of simple magnitude errors in the APM catalogue, as has been suggested by some authors. A combination of a local underdensity and evolution is the most probable explanation, though surface-brightness selection effects may also be important.
The Latest Update
At the beginning of November 1997, 4 nights of observing with variable weather yielded over 3000 spectra, bringing the current total up to 5000. For the first time we achieved more than 1000 redshifts in one night of observing. The data are already reduced and the resulting luminosity function agrees well with the result from the commissioning data.
References
References
- [1] Maddox, S.J., Sutherland, W.J., Efstathiou, G., and Loveday J. M.N.R.A.S. 243, 692 (1990)
- [2] Maddox, S.J., Efstathiou G.P. and Sutherland W.J. M.N.R.A.S. 283, 1227 (1996)
- [3] Schlegel, Finkbeiner, D., Davis, M., astro-ph/9710327
- [4] Boyle, B., Smith, R.J., Shanks, T., Croom, S.M., Miller, L., astro-ph9710202
- [5] Loveday, J., Peterson, B.A., Efstathiou, G. and Maddox, S.J. Astophys. J. 390, 338 (1992)
- [6] E. Zucca, G. Zamorani, G. Vettolani, A. Cappi, R. Merighi, M. Mignoli, G. M. Stirpe, H. MacGillivray, C. Collins, C. Balkowski, V. Cayatte, S. Maurogordato, D. Proust, G. Chincarini, L. Guzzo, D. Maccagni, R. Scaramella, A. Blanchard, M. Ramella A&A 390, 338 (1997)