1 Introduction
This IAU Joint Discussion proposes to address the subject of redshift surveys in the 21st century. This paper, however, deals with two major new redshift surveys that those involved sincerely hope will be completed in the 20th century. Nonetheless, these surveys are relevant to the topic of the meeting, as they clearly foreshadow the scope and style of redshift surveys, if not in the coming millennium, at least in the coming decade.
The surveys are being carried out with the new Two Degree Field (2dF) facility on the Anglo-Australian Telescope (AAT), a 400-fibre multi-object spectrograph with the capability, as described in Section 2, to increase the size of redshift surveys by an order of magnitude over current best efforts. The main scientific goals, survey strategy and some preliminary results from the 2dF Galaxy Redshift Survey are outlined in Section 3, while Section 4 similarly describes the 2dF QSO Redshift Survey. Further information can be found on the WWW at http://www.aao.gov.au/2df/ for the 2dF facility, at http://msowww.anu.edu.au/colless/2dF/ for the galaxy survey and at http://www.aao.gov.au/local/www/rs/qso_surv.html for the QSO survey.
2 The 2dF Facility
The 2dF facility on the AAT consists of several major components, shown schematically in Figure 1: a new prime focus optical assembly, comprising an atmospheric dispersion compensator and field corrector; a pair of field plates, each with 400 positionable fibres, which can be tumbled between the focus location and a configuration location; a robotic fibre positioner which can rapidly re-configure the 400 fibres; two spectrographs, each dealing with the light from 200 fibres; and a top-end ring assembly to carry these various components.
2dF obtained its first scientific data in November 1996. For the next nine months it operated with only 200 fibres and one spectrograph while the system was tested and commissioned and the second spectrograph completed. In September 1997 the full 400 fibres were installed (see Figure 2) and for the first time 400 spectra were obtained simultaneously using the two-spectrograph system.
3 The 2dF Galaxy Redshift Survey
3.1 Goals of the Survey
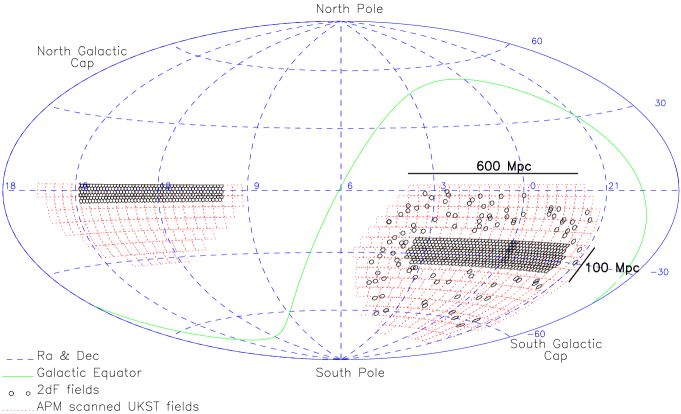
The observational goal of the 2dF Galaxy Redshift Survey is to secure high quality spectra and redshifts for 250,000 galaxies brighter than bJ=19.5 (extinction-corrected), with a deeper extension to R=21 making best use of good conditions. The brighter galaxies cover an area of 1700 square degrees selected from both the southern galactic hemisphere APM galaxy survey and an extension into the north galactic hemisphere equatorial region. The arrangement of 2dF survey fields is shown in Figure 3.
We aim to use the survey to address a variety of fundamental problems in galaxy formation and cosmology. The main scientific goals include:
1. Accurate measurements of the power spectrum of galaxy clustering on scales of up to a few hundred Mpc, allowing direct comparisons with microwave background anisotropy measurements of fluctuations on the same spatial scales.
2. Measurements of the distortion of the clustering pattern in redshift space, providing constraints on the cosmological density parameter and the spatial distribution of dark matter.
3. A determination of variations in the spatial and velocity distributions of galaxies as a function of luminosity, type and star-formation history, providing important constraints on models of galaxy formation.
4. Measurements of the evolution of the galaxy luminosity function, clustering amplitude and star formation rates out to a redshift of 0.5. This will be accomplished by combining the bright bJ19.5 survey with the faint R21 survey, which is comparable in size to the largest current local surveys.
5. Investigations of the morphology of galaxy clustering and the statistical properties of the fluctuations—for example, whether the initial fluctuations are Gaussian as predicted by inflationary models of the early universe.
6. A study of clusters and groups of galaxies in the redshift survey, in particular the measurement of infall in clusters and dynamical estimates of cluster masses at large radii.
7. Application of novel techniques to classify the uniform sample of 250,000 spectra obtained in the survey, thereby obtaining a comprehensive inventory of galaxy types as a function of spatial position within the survey.
3.2 Survey Status
As of mid-1997 we have taken nearly 2000 redshifts for the survey. These were obtained in commissioning time on the instrument using only one of the two spectrographs and 200 fibres. Later this year we will begin observations with all 400 fibres and the survey will enter production-line operation. We expect to complete the survey observations by the end of 1999.
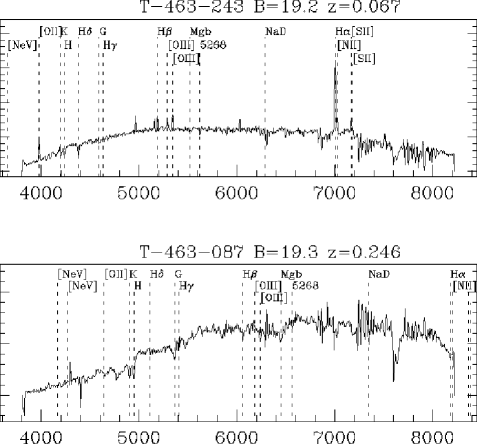
Two example spectra taken in the commissioning period are shown in Figure 4. One is a bJ=19.2 emission-line galaxy at =0.067 and the other is a bJ=19.3 absorption-line galaxy at =0.246. The quality target for the survey spectra is a S/N of at least 10 per 2-pixel resolution element (FWHM9Å); most spectra will easily exceed this target.
This minimum S/N permits reliable automatic spectral classification and redshift measurement. Employing both a standard cross-correlation and line-fitting code and a new code which uses Principal Component Analysis and -fitting to simultaneously classify the spectrum and measure its redshift (Glazebrook et al. 1997), we find we achieve a very high level of reliability. A comparison of the redshifts obtained from these codes with redshifts determined semi-manually via visual inspection (Figure 5) shows a very low level of failures in the automatic algorithms, even with the variable-quality commissioning data.

3.3 Preliminary Results
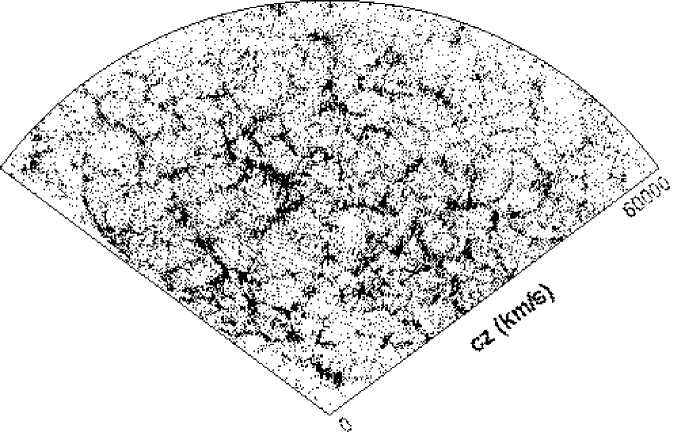
Figure 6a is a cone plot, combining NGH and SGH strips, showing the galaxies with redshifts measured to date—this is less than 1% of the full sample. For comparison, Figure 6b shows a simulated cone plot of a single 2∘ declination slice in the redshift survey; even this slice, which contains 34,000 galaxies, represents less than 15% of the survey.

Although so far we have observed too few fields to effectively address questions of large-scale structure, we do have a sufficiently large sample of redshifts to begin to look at the properties of local galaxies. Figure 7 shows a preliminary determination of the galaxy luminosity function (LF) at a mean redshift of =0.1. This LF is in good agreement with the LFs from the Autofib survey (Ellis et al. 1997) and the ESO Slice Project (Zucca et al. 1997), and gives an overall galaxy density about 50% higher than that obtained in the Stromlo-APM survey (Loveday et al. 1992). It is important to note that we are reaching more than 5 magnitudes below even with this small sample, and that we should be able to tightly constrain the faint end of the local luminosity function for each morphological or spectral type with the full sample.

4 The 2dF QSO Redshift Survey
4.1 Goals of the Survey
The observational goal of the QSO redshift survey is to obtain spectra for 30000 21 QSOs in two declination strips at the South Galactic Pole and in an equatorial region at the North Galactic cap. The QSO survey will probe the largest scales in the universe (10 h-1 Mpc 1000 h-1 Mpc) over a wide range in redshift space (), and is thus complementary to the galaxy survey. The primary scientific aims of the survey are:
1. To obtain the primordial fluctuation power spectrum out to COBE scales.
2. To determine the rate of QSO clustering evolution in the non-linear and linear regimes, and hence obtain new limits on the value of and (Croom & Shanks 1996).
3. To apply geometric methods to measure (Ballinger et al. 1996).
4. To identify large statistical samples of unusual classes of QSOs (e.g. BALs) or absorption line systems (e.g. damped Ly systems).
Observations that radio-quiet QSOs exist in average galaxy cluster environments (5 h-1 Mpc) at low-to-moderate redshifts (Smith et al. 1995 and references therein) demonstrate that radio-quiet QSOs can be used to provide important information on the structure of the Universe at the largest scales.
4.2 Survey Strategy and Status
The 2dF QSO survey covers an area of 740 deg2 comprising two strips on the sky (small areas surrounding bright stars have been excluded from the analysis). QSO candidates were selected from APM measurements of UK Schmidt , and plates/films, on the basis of their anomalous position in the stellar / colour–colour diagram. The vast majority (85%) of the candidates are selected solely on the basis of their colour (sensitive to QSOs with 2.2), but the additional use of the magnitude minimises contamination from Galactic stars and extends the redshift range over which QSOs can be selected to 2.9. The initial UVX-selected catalogue is shown in Figure 8. In total over 150 , and plates (comprising 30 UKST fields) were used to compile the input catalogue. Great care was taken to keep photometric variations at 0.1 mag level over the entire catalogue (Smith 1997).
The QSO 2dF redshift survey fields form part of the area of sky surveyed by the galaxy 2dF survey, and so the objects in the QSO and galaxy 2dF redshift surveys are being observed simultaneously with 2dF. This leads to significant gains in both efficiency (the combined survey can be carried out in 20 nights less than if the surveys had been separate) and completeness (the QSO survey will pick up compact blue galaxies, the galaxy survey will identify extended low-redshift QSOs).
To date (October 1997), almost 800 QSO candidates in the 2dF QSO survey have been observed, comprising over 400 QSOs. Most of these have been observed with 2dF, but over 100 bright (18) QSOs have been identified with the UKST FLAIR system and 20 QSOs in close pairs (separations less than 20 arcsec) have been discovered with the MSSSO 2.3m telescope. Representative spectra from the QSO survey are shown in Figure 9.

We hope to complete the QSO 2dF redshift survey over the next two years, providing an invaluable resource with which to study the large-scale structure of the Universe out to 3. Progress of the survey can be monitored through the WWW site (see Introduction), and by-products of the survey (CCD calibration, input catalogue) will be available at regular intervals.
References
- [1] Ballinger W.E., Peacock J.A., Heavens A.F., 1996, MNRAS, 282, 877
- [2] Colless M.M., 1996, Wide Field Spectroscopy and the Universe, Wide Field Spectroscopy, eds Kontizas M., Kontizas E., Kluwer, pp.227–240
- [3] Croom S.M., Shanks T., 1996, MNRAS, 281, 893
- [4] Ellis R.S., Colless M.M., Broadhurst T.J., Heyl J.S., Glazebrook K., 1996, MNRAS, 280, 235
- [5] Glazebrook K., Offer A.R., Deeley K., 1997, MNRAS, in press
- [6] Loveday J., Peterson B.A., Efstathiou G., Maddox S.J., 1992, ApJ, 390, 338
- [7] Smith R.J., 1997, PhD Thesis, University of Cambridge
- [8] Smith R.J., Boyle B.J., Maddox S.M., 1995, MNRAS, 277, 270
- [9] Zucca E., Zamorani G., Vettolani G., Cappi A., et al., 1997, A&A, in press