The Caltech–Jodrell Bank VLBI Surveys
Abstract
The Caltech–Jodrell Bank VLBI surveys of bright extragalactic radio sources north of declination 35∘ were carried out between 1990 and 1995 using the Mark-II system, achieving images with a resolution of about 1 mas at 5 GHz. The CJ1 survey (together with the older ‘PR’ survey) includes 200 objects with 5 GHz flux density greater than 0.7 Jy; the CJ2 survey includes 193 flat-spectrum sources with 5 GHz flux density greater than 0.35 Jy; and we have defined a complete flux-density limited sample, CJF, of 293 flat-spectrum sources stronger than 0.35 Jy. We summarize the definition of the samples and the VLBI, VLA, MERLIN, and optical observations, and present some highlights of the astrophysical results. These include: (1) superluminal motion and cosmology; (2) morphology and evolution of the ‘compact symmetric objects’ (CSOs); (3) two-sided motion in some CSOs; (4) the angular-size–redshift diagram; (5) misalignment of parsec-scale and kiloparsec-scale jets.
California Institute of Technology and University of Manchester, Jodrell Bank
1. Introduction
Over the last twenty-five years, VLBI imaging has made a substantial contribution to our understanding of active galactic nuclei. The discovery of well-collimated, apparently superluminal jets on parsec scales has revealed the dominant effects of relativistic beaming on the appearance of these objects, and motivated the development of the so-called “unified theories” of quasars and radio galaxies. While detailed studies of individual objects are undoubtedly important for understanding the origin and collimation of the jets and their emission mechanisms, a full understanding will only come from study of large, well-defined samples that can be subjected to statistical analysis. This is the motivation for VLBI surveys. With surveys, we hope to examine the full range of source morphologies and produce a body of astrophysical data (brightness temperatures, energy densities, flow speeds, and so forth) that can be used to develop and test physical theories of active nuclei.
In this paper we will present some of the results of a series of surveys undertaken by our groups at Caltech and Jodrell Bank. We will first summarize the sample selection and the available observational data. We will then focus on some of the most interesting astrophysical results.
2. Sample Definition
The Caltech–Jodrell Bank (CJ) surveys were conducted in three parts. For all the surveys, sources were selected from the region of sky with declination and latitude . (1) The original sample, which has now become known as the “Pearson–Readhead” (PR) sample, was the complete sample of 65 sources with flux density Jy; 45 of these sources have been imaged with VLBI at 5 and 1.6 GHz (Pearson & Readhead 1981, 1988; Polatidis et al. 1995). (2) The CJ1 survey extended the PR sample down to Jy, adding 135 sources for a total of 200. Eighty-two of the additional sources have been imaged with VLBI at 5 and 1.6 GHz (Polatidis et al. 1995; Thakkar et al. 1995; Xu et al. 1995). (3) For the CJ2 sample, we further decreased the flux-density limit to Jy, but with the restriction that sources should have a flat spectrum (), which eliminates extended sources that are difficult to image with VLBI. The CJ2 sample contains 193 sources, all of which have been imaged with VLBI at 5 GHz (Taylor et al. 1994; Henstock et al. 1995).
We have more recently defined a complete flux-density limited sample of flat-spectrum sources stronger than 0.35 Jy, which we call the Caltech–Jodrell Bank flat-spectrum sample (CJF). This includes 293 extragalactic sources. For this sample, we have re-examined the single-dish surveys from which the sources were selected, and included 18 sources that were not included in PR, CJ1, or CJ2 (Taylor et al. 1996). The new selection is based on the 1.4 and 4.85 GHz Green Bank surveys. Thus we have complete samples of all sources down to 0.7 Jy (PR+CJ1), and of flat-spectrum sources down to 0.35 Jy (CJF).
3. Observations
The primary goal of the surveys was to image the parsec-scale structure in the objects at 5 GHz. The original observations were VLBI snapshots with a global array, using the old Mark-II narrow-band recording system. We were pleased to find that reliable images of compact objects could be made with only three 20-minute scans spaced in hour angle. In addition, we made 1.6-GHz VLBI images of the sources in the PR and CJ1 samples. All the images are presented in the papers cited in the previous section.
To compare the parsec-scale structure with the larger-scale structure in these objects, we have made (or obtained from the literature) images with the VLA and MERLIN at 5 and 1.6 GHz. We have also assembled radio spectra of the sources from the literature (Herbig & Readhead 1992; Xu et al. 1995; Henstock et al. 1995; Taylor et al. 1996).
We are making extensive optical observations to obtain redshifts for all the sources, using the Palomar 200-inch, Isaac Newton, William Herschel, and Keck telescopes (Henstock, Browne, & Wilkinson 1994; Xu et al. 1994; Lawrence et al. 1996; Vermeulen & Taylor 1995; Vermeulen et al. 1996; Henstock et al. 1997); for the PR sample, we have obtained high-quality, calibrated spectra which will allow statistical investigations of the relationship between the optical spectrum and the parsec-scale structure (Lawrence et al. 1996). We are approaching completeness: CJF is currently 97% optically identified, and we have redshifts for 92% of the objects. The redshifts range up to 3.886.
An important part of the project is continued VLBI monitoring to measure internal proper motions in the parsec-scale radio sources. Almost all of the CJF sources have been observed at at least two epochs, and we are part-way through observations for a third epoch, with a typical separation between observations of about two years. For most of the PR sources, we have four or more observations spread over nearly 18 years. All the recent observations have been made with the VLBA in snapshot mode.
4. Highlights
The CJ surveys have produced a large body of observational data that we hope will be of value for a wide variety of astrophysical investigations. In this paper, we have space only to mention some of the investigations that we have undertaken ourselves, and give references to more extensive presentations.
4.1. Superluminal Motion
The great majority of sources imaged in the CJ surveys show a parsec-scale jet on one side of a flat-spectrum, compact core. In the standard model, the asymmetry is attributed to relativistic beaming and the core is close to, though probably not coincident with, the center of activity. Several of the sources in the CJ surveys, and especially those in the PR sub-sample, have been monitored extensively to follow the evolution of brightness peaks (usually called “components”) as they move out along the jet. This is not the place to discuss these detailed studies of individual objects, but some results are apparent: components show a wide range of apparent velocities; different components in the same source can show different velocities; components can accelerate, decelerate, merge or split; and in some cases a stationary component can coexist with moving components. It is quite clear that the components are not discrete objects following ballistic paths; the apparent motions that we measure are probably phase velocities of a moving disturbance and may not be simply related to the velocity of the underlying jet flow.
A major goal of the CJ surveys is to make a statistical study of the apparent speeds, in order to understand the general properties of the phenomenon rather than the details of an individual object. We may also be able to place constraints on and (Vermeulen & Cohen 1994; Lister & Marscher 1997). Analysis of the second and third epochs is not yet complete: what follows is an update on the preliminary results presented by Vermeulen (1995, 1996), based on 81 objects. The distribution of apparent velocities (), which depends on km s-1 Mpc-1 and , shows an abundance of velocities in the range from zero to , with only a tail of the distribution reaching up to . A substantial fraction () of the objects show stationary features or have only upper limits on velocity. In a beamed, randomly oriented sample of jets with speed (Lorentz factor ), most sources should show , so this result shows that either the pattern motions we measure are different from the underlying bulk flow (by a factor up to 10), or there is a range of more than a decade in jet Lorentz factors over the sample, or both. The preponderance of in the earlier literature probably reflects a bias toward the faster sources, which are easier to measure. There are no significant differences between the average apparent speeds for galaxies (), BL Lac objects (), and quasars (); here we have ignored upper limits. A Kolmogorov-Smirnov test gives a probability of 30% that the values for quasars (44 objects) and BL Lacs (8 objects) are taken from the same distribution, in contrast to the result of Gabuzda et al. (1994).
There is a clear and very intriguing correlation between apparent velocity and luminosity at 5 GHz (observed frequency), calculated assuming isotropic emission. While low can be found at any observed luminosity, the largest occur only at the highest luminosity (Vermeulen 1996). Recent simulations by Lister & Marscher (1997) show that this effect can be obtained as a sort of Malmquist bias from the interplay between Lorentz factor distributions weighted to low values and the shape of the unbeamed luminosity function and its cosmic evolution. It is also possible that the Lorentz factor may be correlated with unbeamed luminosity.
4.2. Compact Symmetric Objects
Between 5 and 10% of the sources in the CJ samples are compact symmetric objects (CSOs), in which high-luminosity radio emission regions are seen on both sides of the center of activity on scales less than one kiloparsec (Wilkinson et al. 1994). This class includes the compact double sources earlier recognized by Phillips & Mutel (1982). A serious impediment to our understanding of these objects has been the difficulty of determining the exact location of the central engine—the best candidate is a compact, flat-spectrum component, but it is not always the brightest feature near the middle of the structure (Taylor, Readhead, & Pearson 1996). Although the overall structure is frequently symmetric about this point, there may be bright asymmetric emission perhaps associated with a jet, as in 0710+439 and 2352+495. The correct classification of some objects remains in doubt because of the difficulty of pinpointing the center of activity (e.g., CTD 93, p. LABEL:shaffe). In general, the CSOs have no larger-scale extended structure, have low polarization and low variability, and are identified with galaxies rather than quasars. The advance speed of the outer “hot spots” is low ().
The objects appear to be small versions of the extended double radio galaxies, and the question remains whether they are young precursors of kiloparsec-scale objects, are short-lived objects that will never achieve kiloparsec size, or are older objects that are unable to expand owing to strong confinement by the interstellar medium. If the hot spots are confined by ram pressure, we can use the observed pressure in the hot spots to constrain the advance speed and the density of the confining medium (Readhead et al. 1996a). For example, in 2352+495 we find cm-3, and hence the age of the object is yr. A variety of observations place limits on the density of H and H in the nuclear regions of the galaxy, cm-3, which imply an age yr. A larger density and age are possible if the medium is molecular (H2), but an age as large as yr would require an implausibly large mass of gas within the central 200 pc. We conclude that the CSOs are young objects, typically of age yr at a size of 50 pc, with . It is possible that the CSOs evolve into CSS doubles (MSOs), and then into large-scale FR II objects (Hodges & Mutel 1987; Fanti et al. 1995; Readhead et al. 1996b; De Young, these Proceedings, p. LABEL:deyou; O’Dea, these Proceedings, p. LABEL:odea). The numbers of objects show that, if the expansion speed remains constant, the luminosity must decrease roughly as and the external density must decrease as , where is the distance of the hot spot from the center of activity. On this model, the CSOs that we know of are the precursors of lower-luminosity FR-II objects, not the rare, highly luminous ones.
4.3. Bidirectional Motion
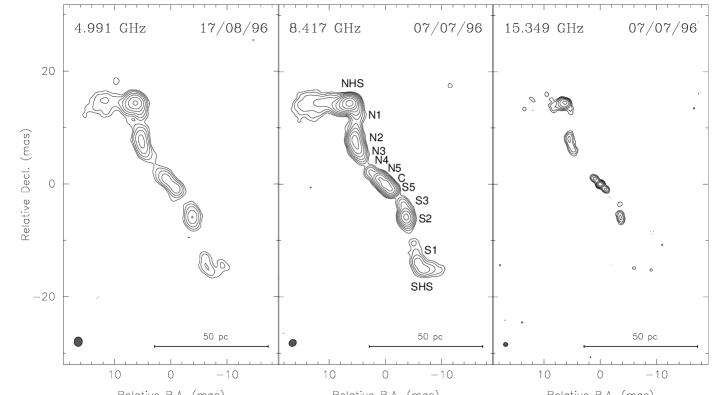
A particularly interesting result from the CJ surveys is the discovery of bidirectional relativistic jets in the radio galaxy 1946+708 (Taylor, Vermeulen, & Pearson 1995; Taylor & Vermeulen 1997). This is a CSO at a redshift . Several components can be identified, symmetrically placed on opposite sides of a compact, inverted spectrum component that is presumably the core (Figure 1). The two outer “hot spots” show an insignificant separation rate of mas yr-1, consistent with the low advance speed seen in other CSOs. If the images are aligned using the hot spots, intermediate components in the jets show significant motion away from the core component, which is a good indication that this component represents the true center of activity. When motion is detected on only one side of the core, one can measure one parameter involving the intrinsic speed and the angle to the line of sight : . With components on both sides, however, one can estimate both and . If the two components were emitted at the same time with the same speed, the ratio of their distances from the core (arm-length ratio) should be , and the apparent speed of separation of the two components should be . Conversion of angular separation rate to linear separation speed involves the distance of the source and is thus dependent on . In this particular object, the measurements are only consistent with the simple model if (i.e., the axis of the source is at a substantial angle to the line of sight), and for reasonable values of . If the jets are relativistic (), then km s-1 Mpc-1. The prospects are encouraging that future observations of bidirectional jets in this and other objects can be used to test the relativistic jet model in some detail, and possibly place useful constraints on and . A second such object, NGC 3894 (1146+596) has recently been found in the CJ sample (Taylor, Wrobel, & Vermeulen 1997).
4.4. Angular-Size – Redshift Test
The CJ surveys provide excellent, homogeneous samples for studying cosmology by way of the angular-size–redshift test for compact radio sources. The possibility of measuring in this way has attracted considerable attention since Kellermann (1993) first suggested it and showed that the data were consistent with . A similar result was obtained by Gurvits (1994) using angular sizes estimated from visibility data rather than measured from images. The main drawback of the method is that it is not clear that the measured angular size corresponds to a “standard rod” whose effective linear size is independent of redshift, although Kellermann’s results suggest empirically that it does. Several authors (e.g., Dabrowski, Lasenby, & Saunders 1995) have shown that Kellermann’s result, based on 82 sources, is not statistically compelling. We have therefore repeated Kellermann’s analysis with the complete CJF sample (Wilkinson et al. 1997).
Following Kellermann, we have measured the angular size between the peak in the image (the core) and the most distant component (peak) exceeding 1% of the core brightness (Kellermann used 2%). Unlike Kellermann, we have convolved each map to the same linear resolution corresponding to an angular resolution of 1.5 milliarcsec at redshift , assuming a value of . This should reduce the bias due to the dependence of angular resolution on redshift. At any redshift there is a large scatter in the angular size measurements, but we find that the median angular size decreases as increases up to , and flattens off at higher , in qualitative agreement with the results of Kellermann and Gurvits. The upper envelope of the distribution does not decrease with redshift. However, as emphasized by Wilkinson et al., there are several possible effects that must be understood before the data can be used to obtain a reliable estimate of , including the dependence of measured angular size on luminosity and the possible effects of evolution.
4.5. Misalignment-Angle Distribution
A surprising result that emerged from the PR survey was the discovery of a bimodality in the distribution of position-angle differences, PA, between the nuclear (parsec-scale) radio structure and the extended (kiloparsec-scale) structure. The distribution of PA shows two distinct peaks, near (aligned objects) and near (misaligned objects). This result was later confirmed in larger samples (Wehrle et al. 1992; Conway & Murphy 1993; Appl, Sol, & Vicente 1996), and the peak near was shown to be due primarily to objects of high optical polarization (Impey et al. 1991). With the completion of the CJ surveys, we now have larger, homogeneous samples, with which to investigate this phenomenon further. We have compiled the PA distribution for the 87 objects from PR and CJ1 for which we have adequate VLBI and VLA images, and we have made new measurements of the optical polarization of the CJ1 sources (Xu et al. 1997); unfortunately we have not yet made a similar analysis of CJ2. We have confirmed the bimodality of the distribution, and find that large misalignment angle is associated with high optical polarization, prominent parsec-scale core component, and flat spectrum—“blazar” properties that are usually attributed to orientation of the jet toward the observer and relativistic beaming. The bends that produce the peak in the distribution occur over a wide range of scales in different sources, from a few parsecs to a few kiloparsecs; in a few cases, a jet can be traced continuously through the bend from parsec to kiloparsec scales.
It is now clear that the bimodality is real, and is connected in some way with relativistic motion of the nuclear emission regions. Successful models of active galactic nuclei must account for this phenomenon. Possible explanations include helical jets with relativistic beaming (Conway & Murphy 1993), ram pressure bending (Pearson & Readhead 1988), and warped accretion disks (Appl et al. 1996). We prefer the geometrical model of Conway & Murphy, in which the visible part of the nuclear jet lies on the surface of a cone and relativistic beaming favors lines of sight close to the cone surface where PA will be observed. Various physical conditions might give rise to such a geometry: a helical jet driven by a binary black hole is an interesting possibility, but it is also possible that the visible emission is due to a helical instability on the surface of a wider conical jet.
5. Conclusion
The Caltech–Jodrell Bank surveys have yielded a large body of observational data that should be of use both for identifying individual sources of particular interest and for a wide variety of astrophysical investigations. Some of the results could have been predicted, for example the high incidence of superluminal motion, but the study of complete samples is yielding new data that will allow us to improve our understanding of this phenomenon. The identification of a large number of CSOs has shown that these objects really are a distinct population, not dominated by relativistic beaming, and it is clear that detailed studies of these objects will cast light on the early stages of radio source evolution. The prospects for cosmological studies are good, both for the direct measurement of with bidirectional jets and for the determination of through statistics of superluminal motion and angular sizes, although, as in all such studies, the effects of evolution and of observational bias need to be thoroughly understood. There are plenty of directions for future work, both in extending surveys to fainter sources and other areas of the sky, and in following up the results obtained so far. Indeed, several large-scale systematic surveys are now under way with the EVN, the VLBA, and HALCA, and many of them are described in other papers presented at this meeting.
Acknowledgments.
The CJ surveys represent one of the largest VLBI projects carried out prior to the completion of the VLBA, and we are very grateful to the personnel of the participating observatories and of the Caltech/JPL correlator for making the surveys possible. The work at Caltech was supported by the National Science Foundation (AST-9117100 and AST-9420018). The National Radio Astronomy Observatory is a facility of the National Science Foundation, operated under a cooperative agreement by Associated Universities, Inc.
References
Appl, S., Sol, H., & Vicente, L. 1996. A&A, 310, 419–437.
Conway, J. E., & Murphy, D. W. 1993. ApJ, 411, 89–102.
Dabrowski, Y., Lasenby, A., & Saunders, R. 1995. MNRAS, 277, 753–757.
Fanti, C., et al. 1995. A&A, 302, 317–326.
Gabuzda, D. C., et al. 1994. ApJ, 435, 140–161.
Gurvits, L. I. 1994. ApJ, 425, 442–449.
Henstock, D. R., Browne, I. W. A., & Wilkinson, P. N. 1994. Spectrum (Newsletter of the Royal Observatories), 4, 26–27.
Henstock, D. R., et al. 1995. ApJS, 100, 1–36.
Henstock, D. R., et al. 1997. MNRAS, 290, 380–400.
Herbig, T., & Readhead, A. C. S. 1992. ApJS, 81, 83–124.
Hodges, M. W., & Mutel, R. L. 1987. in Superluminal Radio Sources, eds. J. A. Zensus & T. J. Pearson (Cambridge: Cambridge Univ. Press), 168–173.
Impey, C. D., Lawrence, C. R., & Tapia, S. 1991. ApJ, 375, 46–68.
Kellermann, K. I. 1993. Nature, 361, 134–136.
Lawrence, C. R., et al. 1996. ApJS, 107, 541–619.
Lister, M. L., & Marscher, A. P. 1997. ApJ, 476, 572–588.
Pearson, T. J., & Readhead, A. C. S. 1981. ApJ, 248, 61–81.
Pearson, T. J., & Readhead, A. C. S. 1988. ApJ, 328, 114–142.
Phillips, R. B., & Mutel, R. L. 1982. A&A, 106, 21–24.
Polatidis, A. G., et al. 1995. ApJS, 98, 1–32.
Readhead, A. C. S., et al. 1996a. ApJ, 460, 612–633.
Readhead, A. C. S., et al. 1996b. ApJ, 460, 634–643
Taylor, G. B., Readhead, A. C. S., & Pearson, T. J. 1996. ApJ, 463, 95–104.
Taylor, G. B., & Vermeulen, R. C. 1997. ApJ, 485, L9–L12.
Taylor, G. B., Vermeulen, R. C., & Pearson, T. J. 1995. Proc. Natl. Acad. Sci. USA, 92, 11381–11384.
Taylor, G. B., Wrobel, J. M., & Vermeulen, R. C. 1997. in preparation.
Taylor, G. B., et al. 1994. ApJS, 95, 345–369.
Taylor, G. B., et al. 1996. ApJS, 107, 37–68.
Thakkar, D. D., et al. 1995. ApJS, 98, 33–40.
Vermeulen, R. C. 1995. Proc. Natl. Acad. Sci. USA, 92, 11385–11389.
Vermeulen, R. C. 1996. in Energy transport in radio galaxies and quasars, eds. P. E. Hardee, A. H. Bridle, & J. A. Zensus (ASP Conference Series, 100), 117–122.
Vermeulen, R. C., & Cohen, M. H. 1994. ApJ, 430, 467–494.
Vermeulen, R. C., & Taylor, G. B. 1995. AJ, 109, 1983–1987.
Vermeulen, R. C., et al. 1996. AJ, 111, 1013–1020.
Wehrle, A. E., et al. 1992. ApJ, 391, 589–607.
Wilkinson, P. N., et al. 1994. ApJ, 432, L87–L90.
Wilkinson, P. N., et al. 1997. in Cosmology from Radio Surveys, ed. M. Bremer & N. J. F. Jackson, in press.
Xu, W., et al. 1994. AJ, 108, 395–397.
Xu, W., et al. 1995. ApJS, 99, 297–348.
Xu, W., et al. 1997. in preparation.