11 (09.01.1; 09.13.2; 11.01.1; 11.09.4; 11.13.1; 13.19.3)
Y.-N. Chin, ASIAA, Taiwan, einmann@biaa21.biaa.sinica.edu.tw
Molecular abundances in the Magellanic Clouds
Abstract
Detections of CO, CS, SO, C2H, HCO+, HCN, HNC, H2CO, and C3H2 are reported from LIRS 36, a star-forming region in the Small Magellanic Cloud. C18O, NO, CH3OH, and most notably CN have not been detected, while the rare isotopes 13CO and, tentatively, C34S are seen. This is so far the most extensive molecular multiline study of an interstellar medium with a heavy element depletion exceeding a factor of four.
The = (H2)/ conversion factor is ()-1, slightly larger than the local Galactic disk value. The CO (1–0) beam averaged column density then becomes (H2) and the density ) 100 . A comparison with -values from Rubio et al. (1993a) shows that on small scales ( 10 pc) -values are more similar to Galactic disk values than previously anticipated, favoring a neutral interstellar medium of predominantly molecular nature in the cores. The (13CO)/(C18O) line intensity ratio indicates an underabundance of 12C18O relative to 13C16O w.r.t. Galactic clouds. (HCO+)/(HCN) and (HCN)/(HNC) line intensity ratios are 1 and trace a warm ( 10 K) molecular gas exposed to a high ionizing flux. Detections of the CS =2–1, 3–2, and 5–4 lines imply the presence of a high density core with ) = . In contrast to star-forming regions in the LMC, the CN 1–0 line is substantially weaker than the corresponding ground rotational transitions of HCN, HNC, and CS. CO, CS, HCO+, and H2CO fractional abundances are a factor 10 smaller than corresponding values in Galactic disk clouds. Fractional abundances of HCN, HNC, and likely CN are even two orders of magnitude below their ‘normal’, Galactic disk values. The CN/CS abundance ratio is 1. Based on chemical model calculations, we suggest that this is because of the small metallicity of the SMC, which affects the destruction of CN but not CS, and because of the high molecular core density which also favors CN destruction.
keywords:
ISM: abundances – ISM: molecules – Galaxies: abundances – Galaxies: ISM – Magellanic Clouds – Radio lines: ISM1 Introduction
Recent studies of the dense molecular gas in five star-forming regions of the Large Magellanic Cloud (LMC) revealed a number of striking differences with respect to properties typically observed in the clouds of the Galactic disk (see Johansson et al. 1994; Chin et al. 1997): C18O is underabundant relative to 13CO, the C18O/C17O ratio ( 2) appears to be smaller than the canonical value of 3.5 in the Galactic interstellar medium, and HCO+ to HCN line intensity ratios are larger than those in the Milky Way. In view of these results, one may expect that a thorough study of the Small Magellanic Cloud (SMC) with its low metallicity and strong UV radiation field will reveal even more drastic deviations from typical Galactic disk properties, thus permitting insights into otherwise not directly discernible astrophysical and astrochemical processes (cf. Johansson 1991, 1997; Rubio et al. 1993a,b, 1997; Lequeux et al. 1994; Chin et al. 1997; Heikkilä et al. 1997). Employing a Schottky receiver, Chin et al. (1997) reported the detection of C2H, CS, and a tentative detection of CN toward LIRS 36, the source with strongest CO =1–0 line temperature among investigated SMC IRAS sources (Rubio et al. 1993b).
Here, a high sensitivity study of LIRS 36 is presented, providing a detailed molecular view of a star formation region in the extremely metal poor environment (e. g. Westerlund 1990) that characterizes the SMC.
2 Observations
The data were taken in January 1996 and 1997 and in July 1997, using the 15-m Swedish-ESO Submillimetre Telescope (SEST) at La Silla, Chile. Two SIS receivers, one at = 3 mm and one at 2 mm, yielded overall system temperatures, including sky noise, of order = 250 K on a main beam brightness temperature () scale while for 12CO(1-0) reached 400 K. In January 1997, a = 1.3 mm SIS receiver yielded overall system temperatures of 500 – 1600 K at 218 – 245 GHz and 3000 – 4000 K at 265 – 267 GHz in clear but humid weather. In July 1997, a 0.85 mm SIS receiver with 3000 K was employed. The backend was an acousto-optical spectrometer (AOS) which was split into 2 1000 contiguous channels for simultaneous 3 and 2 mm observations. At 1.3 and 0.85 mm, all 2000 channels were used to cover a similar velocity range. The channel separation of 43 kHz corresponds to 0.04, 0.05 – 0.06, 0.08 – 0.10 and 0.11 – 0.15 for the frequency intervals 340 – 350, 265 – 220, 150 – 130 and 115 – 85 GHz, respectively. Depending on line frequency, the antenna beamwidth varied from 15′′ to 57′′ corresponding to linear scales of 4 – 17 pc. At 345 GHz, the beam was slightly broadened in E–W direction; this is caused by astigmatism, reflecting the limited surface accuracy of the SEST antenna (L.-Å. Nyman, priv. comm.).
The observations were carried out in a dual beam-switching mode (switching frequency 6 Hz) with a beam throw of 11′40′′ in azimuth. The on-source integration time of each spectrum varied from 8 minutes for 12CO(1-0) to 18.5 hours for C34S(3-2). All spectral intensities were converted to a scale, correcting for main beam efficiencies of 0.74 at 85–100, 0.70 at 100–115, 0.67 at 130–150, 0.45 at 220–265 GHz, and 0.30 at 345 GHz (L.B.G. Knee, L.-Å. Nyman, A.R. Tieftrunk, priv. comm.). Calibration was checked by measurements of Orion KL, M17SW, and NGC 4945; it was found to be accurate to 10%. The pointing accuracy, obtained from measurements of the SiO masers R Dor and U Men, was better than 10′′. 345 GHz data with pointing offsets in excess of 5′′ were ignored in the data analysis.
| Molecule | Frequency | a) | r.m.s.b) | d c) | |||||
|---|---|---|---|---|---|---|---|---|---|
| & Transition | [MHz] | [K] | [mK] | [] | [] | [] | |||
| C3H2 | =21,2–10,1 | 85338.890 | 0.025 | 7 | 126.3 | 3.9 | 0. | 108 | 0.008 |
| C2H | =1-0 =3/2–1/2 =2–1 | 87316.925 | 0.040 | 8 | 126.0 | 4.1 | 0. | 180 | 0.008 |
| =1–0 | 87328.624 | 0.030 | 7 | 126.6 | 1.8 | 0. | 075 | 0.008 | |
| HCN | =1–0 | 88631.847 | 0.026 | 5 | 126.3 | 2.5 | 0. | 106 | 0.006 |
| HCO+ | =1–0 | 89188.518 | 0.101 | 17 | 126.4 | 3.1 | 0. | 369 | 0.018 |
| HNC | =1–0 | 90663.543 | 0.016 | 5 | 126.0 | 2.4 | 0. | 038 | 0.005 |
| C34S | =2–1 | 96412.982 | 0.01 | 7 | … | … | 0.026 | ||
| CS | =2–1 | 97980.968 | 0.067 | 16 | 126.2 | 2.8 | 0. | 225 | 0.016 |
| C18O | =1–0 | 109782.160 | 0.01 | 8 | … | … | 0.030 | ||
| 13CO | =1–0 | 110201.353 | 0.284 | 43 | 126.2 | 3.1 | 1. | 04 | 0.05 |
| CN | =1–0 =3/2–1/2 =5/2–3/2 | 113490.982 | 0.01 | 12 | … | … | 0.038 | ||
| CO | =1–0 | 115271.204 | 2.73 | 135 | 126.1 | 3.2 | 9. | 69 | 0.14 |
| SO | =43–32 | 138178.648 | 0.051 | 11 | 126.3 | 2.3 | 0. | 135 | 0.010 |
| H2CO | =21,2–11,1 | 140839.518 | 0.081 | 16 | 126.1 | 2.7 | 0. | 241 | 0.014 |
| C34S | =3–2 d) | 144617.147 | 0.015 | 7 | 125.3 | 1.9 | 0. | 018 | 0.007 |
| CH3OH | =30–20, A+ | 145103.230 | 0.01 | 10 | … | … | 0.029 | ||
| H2CO | =20,2–10,1 | 145602.953 | 0.059 | 16 | 126.2 | 2.2 | 0. | 142 | 0.013 |
| CS | =3–2 | 146969.049 | 0.065 | 14 | 126.3 | 2.5 | 0. | 179 | 0.012 |
| NO | =3/2–1/2 =5/2–3/2 (+) | 150176.480 | 0.01 | 17 | … | … | 0.048 | ||
| H2CO | =21,1–11,0 | 150498.339 | 0.069 | 19 | 126.4 | 2.5 | 0. | 167 | 0.016 |
| C3H2 | =41,4–30,3 | 150851.910 | 0.02 | 20 | … | … | 0.055 | ||
| H2CO | =30,3–20,2 d) | 218222.191 | 0.060 | 44 | 126.4 | 1.7 | 0. | 150 | 0.034 |
| 13CO | =2–1 | 220398.686 | 0.565 | 48 | 126.1 | 3.0 | 1. | 85 | 0.03 |
| H2CO | =31,2–21,1 | 225697.772 | 0.04 | 74 | … | … | 0.168 | ||
| CO | =2–1 | 230537.990 | 3.92 | 121 | 126.1 | 3.2 | 13. | 9 | 0.2 |
| =2–1 e) | 230537.990 | 3.02 | 112 | 126.1 | 3.5 | 11. | 7 | 0.1 | |
| CS | =5–4 | 244935.606 | 0.161 | 93 | 125.7 | 1.6 | 0. | 287 | 0.067 |
| HCN | =3–2 | 265886.432 | 0.1 | 250 | … | … | 0.52 | ||
| HCO+ | =3–2 | 267557.625 | 0.1 | 120 | … | … | 0.25 | ||
| CO | =3–2 | 345795.975 | 3.23 | 570 | 125.9 | 3.7 | 12. | 7 | 0.3 |
| =3–2 e) | 345795.975 | 2.37 | 130 | 126.1 | 3.7 | 9. | 66 | 0.08 | |
-
a)
For non-detections, the single channel 3 noise level is given, divided by the square root of the number of expected line channels.
-
b)
r.m.s noise for an individual channel.
-
c)
The intensities are integrated from = 122 to 130 . For the detected lines, errors are one standard deviation. For undetected transitions, upper 3 limits are given.
-
d)
Tentative detection
-
e)
The spectrum has been convolved to the beam size of the =1–0 transition ( 43′′).
3 Results
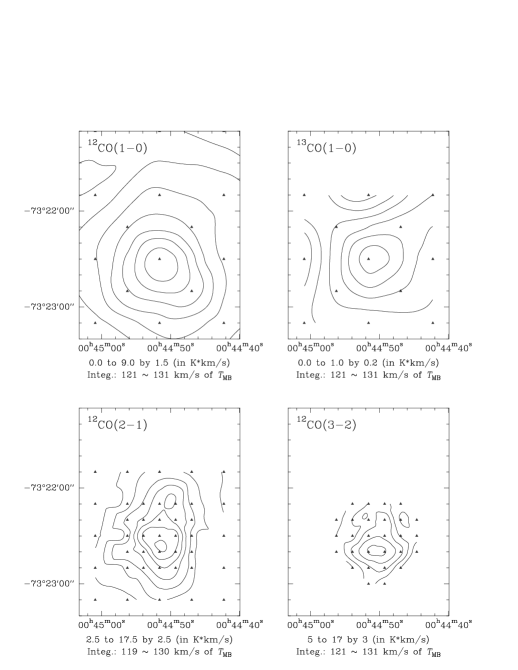
Fig. 1 shows maps of the LIRS 36 complex, obtained in 12CO =1–0, 2–1, 3–2, and 13CO =1–0 with spacings of 28′′, 10′′, 10′′, and 28′′ for the central region, respectively. The 1–0 map does not spatially resolve the source. While the 2–1 line data are marginally resolving the source in E–W direction (full width to half power (FWHP) size 40′′, corresponding to 12 pc at = 60 kpc), the emitting region is elongated along the N-S axis (FWHP size 60′′; 17 pc at = 60 kpc). The =3–2 emission shows a similar but more compact distribution. Radial velocities are slightly above 126 toward the central and western parts of the complex and 124 – 126 at southern, eastern and northern offsets.
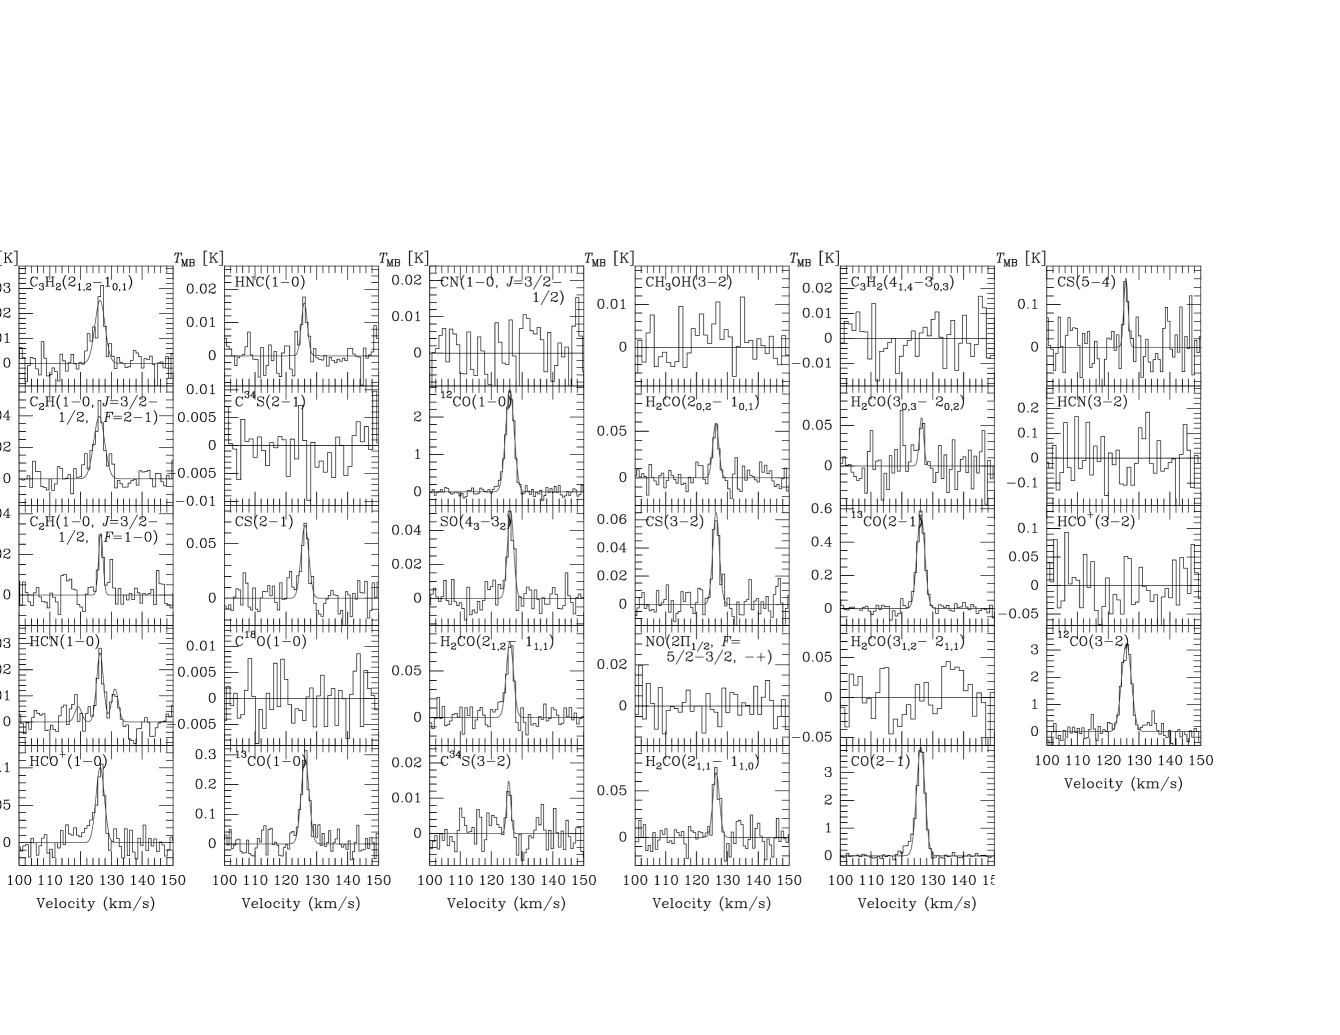
A total of 12 molecular species has been observed. We have detected nine of these in a total of 18 rotational transitions, including isotopic lines. Two tentative detections have also been obtained. This demonstrates that it is possible to carry out molecular multiline studies, including many species, for selected regions of the SMC, extending the range of metallicities by more than a factor of two below that of the Large Magellanic Cloud (cf. Westerlund 1990). Spectra and line parameters obtained by gaussian fits are displayed in Fig. 2 and Table 1. The three H2CO =2–1 = 0,1 transitions have been measured, while the = 30,3–20,2 transition is only tentatively detected. Three rotational transitions of CS, the =2–1, 3–2, and 5–4 lines, have been measured in the main species and two in C34S. While the C34S(3–2) line is apparently detected, we find no evidence for the corresponding 2–1 transition. Although studies of Galactic star-forming regions (Chin et al. 1996) imply that CS (3–2) transitions from rare isotopes are more easily detected than the corresponding 2–1 lines, we classify our C34S detection as tentative. The non-detection of the HCO+ and HCN =3–2 transitions is not surprising in view of the relatively high upper limits obtained in the warm humid weather conditions of the Chilean summer.
Among the rare isotopic species of CO, 13CO is seen but not C18O. The tentative detection of C2H (Chin et al. 1997) is confirmed; the relative line intensities of its two observed hyperfine components imply that the emission is optically thin (cf. Nyman 1984). CN remains unconfirmed, in spite of the higher sensitivity of the data presented here.
4 Discussion
LIRS 36 is one of the most prominent far infrared sources of the SMC (Schwering & Israel 1989). It is an IRAS point source with a cool dust spectrum ( 30 K) and an infrared luminosity of (we applied the method outlined by Wouterloot & Walmsley 1986; = 60k̇pc).
4.1 The X-factor
Assuming that the interstellar medium is in virial equilibrium at all linear scales and that the line width is representing the cloud’s velocity distribution, we can deduce the = / conversion factor from
and
is the virial mass in solar units (M⊙), is the cloud mass derived from (also in solar units), is the cloud radius in pc, is the total linewidth in , 1.36 is the correction to include helium and metals, is the H2 column density in , denotes the integrated CO (1–0) line intensity in , is the mass of an H2 molecule, and and (in ) are the integrated intensities of the upper and lower contours confining the area (in cm2; : number of contours). The factor 190 in the virial mass equation refers to a density distribution and is consistent, within a factor of two, with constant and density profiles (MacLaren et al. 1988). Making use of the beam deconvolved FWHP cloud size deduced from the 2–1 spectra (cf. Sect. 3) and accounting for all the CO emission from the cloud, we obtain = ()-1. This is a factor of two larger than the local Galactic disk value and leads to a H2 column density (averaged over the map) of (H2) , that is consistent with the characteristic column density of nearby Galactic molecular clouds (e. g. Larson 1981). The cloud follows the correlations between , mass, and size, proposed by Larson (1981), and the average number density becomes ) 100 .
Analysing CO clouds with a wide range of radii, Rubio et al. (1993a) obtained (/10pc)0.7 ()-1. The correlation between -factor and linear scale was interpreted in terms of an increased rate of photodissociation of CO due to a strong UV radiation field and a low gas to dust mass ratio and carbon abundance. Moreover, Rubio et al. (1993a) suggest a predominantly atomic intercloud medium. Our observations trace the SMC with a characteristic linear scale of 10 pc that is slightly smaller than the size of the molecular complex; our LIRS 36 -factor is half of the value obtained by Rubio et al. (1993a) from their sample of clouds.
Specifically for LIRS 36, Rubio et al. (1993b) find a virial mass of M⊙. The mass derived by us is M⊙. The application of a slightly smaller linewidth (3.6 ) than those of Rubio et al. (1993b) and Lequeux et al. (1994) (3.8 ) can be justified by the good agreement of the derived from our 12CO(1–0), (2–1), (3–2) and 13CO(1–0) observations (Table 1). Since the difference caused by linewidths is negligible ( 10%), the discrepancy in is caused mainly by the cloud radius , 18.6 versus 9.8 pc. The discrepancy in is caused by two effects: Firstly, Rubio et al. (1993a) use the CO non-deconvolved 0.4 contour (in units of antenna temperature) as the cloud boundary; we use instead the deconvolved FWHP contour. While Rubio et al. (1993a) cloud sizes are based on CO (1–0) data, our cloud size is based on the CO (2–1) transition, assuming that 1–0 and 2–1 emission have a similar extent. Since CO (1–0) and (2–1) cloud sizes should be similar for the SMC (cf. Lequeux et al. 1994) and since cloud size measurements based on higher resolution CO (2–1) spectra provide more accurate results, our smaller value should be preferred. The determination of (defined by the FWHP contour) from CO (1–0), not (2–1) line spectra, may lead to a systematic overestimate of the average -value for clouds with radii 10 pc. A small -factor may imply that an atomic interclump medium can only play a minor role in the molecular cores. Detailed studies of additional SMC cores are needed to demonstrate that small scale SMC -factors are generally as low as is indicated by our data.
4.2 Molecular abundances
4.2.1 12CO versus 13CO
Our measured 12CO and 13CO line intensities are larger than those reported by Rubio et al. (1993b): While the discrepancy is typically 20%, our 13CO(2–1) peak line temperature is higher by a factor of two. This is partially compensated by the exceptionally large linewidth assigned to this line by Rubio et al. (1993b), so that the ratio of integrated line intensities only becomes 1.3. Our beam size corrected =2–1/=1–0 12CO and 13CO line intensity ratios are and (the 1 error refers to the noise in the individual spectra and does not include calibration uncertainties that are given in Sect. 2). This should be compared with 1.16 and 1.25 from Rubio et al. (1993b). Most of the discrepancies in line intensity ratios can be explained in terms of the higher sensitivity of our = 1.3 mm data and the smaller 1.3 mm SEST beam efficiency adopted by us.
The integrated line intensity ratios from the presumably optically thin 13CO transitions are consistent with a density of ) (for 20 K, applying a Large Velocity Gradient (LVG) radiative transfer code; see also Lequeux et al. 1994). Since the density is higher than the virial density obtained in Sect. 4.1, there must be small scale structure that is not resolved by our 15′′ beam.
4.2.2 13CO versus C18O
The non-detection of C18O is consistent with the large 13CO/C18O line intensity ratios observed toward the LMC (Johansson et al. 1994; Chin et al. 1997). We find (13CO)/(C18O) 35 (a 3 limit). While the limit is less stringent than those obtained from star-forming regions of the LMC, the actual value must be larger than the characteristic Galactic line intensity ratio, (13CO)/(C18O) 10 (cf. Lada 1976; Johansson et al. 1994). Whether this is caused by ‘anomalies’ in the isotopic abundances relative to those of the Galactic disk (cf. Henkel & Mauersberger 1993), whether it is caused by isotope selective photodissociation (e. g. van Dishoeck & Black 1988; Fuente et al. 1993) or whether it is caused by fractionation in a partially ionized medium (cf. Watson et al. 1976) remains to be seen. The small C18O/C17O line intensity ratio in the LMC (Johansson et al. 1994) hints at a low 18O abundance, but we do not know whether this also holds for the SMC. (13CO)/(C18O) 40, as measured toward the Galactic H ii region S 68 (Bally & Langer 1982), demontrates that fractionation can, in principle, account for the observed line intensity ratio anomaly. Assuming that both 13CO and C18O are optically thin and have the same excitation temperature, that the 13CO abundance is enhanced by the maximum factor permitted by chemical fractionation, e, and that the 13C/12C : 18O/16O ratio is 7 as in the local Galactic disk (e. g. Wilson & Rood 1994), we obtain for (13CO)/(C18O) 40 with
a kinetic temperature of 20 K. The temperature is consistent with the cloud core model temperatures suggested by Lequeux et al. (1994). A large 13CO abundance enhancement caused by fractionation is plausible in the interstellar medium of the SMC with its small dust opacities and strong UV radiation field.
4.2.3 HCO+, HCN, and HNC
The relative =1–0 intensities of HCO+, HCN, and HNC, three molecules with similar rotational constants and electric dipole moments, also follow the trend obtained toward star-forming regions of the LMC. For the =1–0 transition, (HCO+)/(HCN) and (HCN)/(HNC) 1. This can be interpreted in terms of warm molecular gas, coupled with an intense ionization flux from supernovae, and with HCO+ arising from a larger volume than HCN (cf. Johansson et al. 1994; Chin et al. 1997).
4.2.4 CN
The most unexpected result of our line survey is the absence of a detectable CN signal. CS =2–1 and 3–2 lines tend to be weaker than those of CN in most Galactic and extragalactic sources (cf. Henkel et al. 1988, 1990, 1993; Mauersberger & Henkel 1989; Nyman & Millar 1989; Ziurys et al. 1989; Nyman et al. 1993). Toward LIRS 36, CN remains undetected but we may have seen a rare isotopic species of CS.
4.2.5 CS and the cloud density
At least three of the five observed CS transitions were detected (see Table 1 and Fig. 2). In the case that the CS emitting region is as extended as the CO emitting region, we have to apply the CO 1.3 mm line intensity correction factor, 0.7, for CS =5–4. This factor can be extracted from Table 1 and was also recommended by Rubio et al. (1993b) to account for the small 1.3 mm beam size when comparing 1.3 with 3 mm data. Interpolating, 0.85 is then the appropriate correction factor for our = 2 mm data. If CS arises instead from a point source, the beam size corrections become 0.25 at 1.3 mm and 0.5 at 2 mm wavelength. Since CS requires higher densities than CO to become detectable and since CS optical depths tend to be smaller (cf. Bohlin et al. 1978; Linke & Goldsmith 1980; Larson 1981; Bachiller & Cernicharo 1986), actual correction factors will be 0.25 0.7 at 1.3 mm and 0.5 0.85 at 2 mm. Applying an LVG model describing a spherical or planparallel cloud with uniform density and temperature (for details, see Mauersberger & Henkel 1989), we then find that in the optically thin case with = 20 K (cf. Lequeux et al. 1994) the number density becomes 106.0 ) 106.6 . Also accounting for the standard deviation of the integrated CS (5–4) line intensity (Table 1), we find ) = 105.9-6.9 . With a high 1.3 mm beam efficiency of 0.6 (0.45 is used throughout this paper; see Sect. 2) we would get instead ) = 105.7-6.4 . In order to fully explore the range of relevant kinetic temperatures, we have also calculated densities for = 100 K, a very high value (see e. g. Mauersberger et al. 1990; Lequeux et al. 1994). Accounting again for the standard deviation in the integrated CS (5–4) line intensity, we now find ) = 105.2-5.7 . With all uncertainties considered, we thus conclude that densities must be high, of order to . This is consistent with the density derived from H2CO if the = 3 transition is detected and if 1. The densities are much higher than those derived from 12CO in Sect. 4.1 and from 13CO in Sect. 4.2.1 and are mainly based on a comparison of 2–1 with 5–4 CS lines. Because of their relatively large separation in excitation energy, they are much more sensitive density tracers than e. g. the 2–1 and 3–2 transitions.
So far, we have assumed that CS lines are optically thin, which was suggested by Johansson et al. (1994) for N 159, an LMC H ii region that exhibits stronger line emission than LIRS 36. With a C32S/C34S abundance ratio of 20 in the disk of the Milky Way however (see Chin et al. 1996), a comparison of C32S and C34S (3–2) line intensities (Table 1) leads to an optical depth of 5 for the C32S (3–2) line. There are hence three possibilities: (1) The CS lines are moderately optically thick ( 5). With ) 104.5 , this does not imply a significant reduction of the densities estimated above. (2) The CS lines are optically thin and the 32S/34S ratio drastically deviates from that of the Galactic disk. This leads to a 32S/34S isotope ratio of 5, implying that in the SMC massive stars and type Ia supernovae provide an isotopic mixture that is quite different from that of the more metal rich disk of the Milky Way. (3) Our tentative C34S (3–2) detection, although appearing to be quite convincing, is not real. Another independent measurement of C34S is required to discriminate between these possibilities.
| Molecule | ) | Column density | Fractional abundance | |||
|---|---|---|---|---|---|---|
| [K] | [] | [] | ||||
| H2 a) | — | — | 3 | 1021 | 1 | |
| 12CO b) | — | — | 3 | 1016 | 1 | 10-5 |
| 13CO b) | 20 | 103.9 | 7 | 1014 | 2 | 10-7 |
| CN c) | — | — | 2 | 1012 | 7 | 10-10 |
| CS d) | 20 | 106.5 | 1 | 1012 | 3 | 10-10 |
| HCO+ e) | 30 | 105.0 | 7 | 1011 | 2 | 10-10 |
| HCN f) | 20 | 106.5 | 2 | 1011 | 7 | 10-11 |
| HNC g) | 20 | 105.5 | 9 | 1010 | 3 | 10-11 |
| H2CO h) | 20 | 105.5 | 9 | 1011 | 3 | 10-10 |
-
a)
Column density estimated from the virial mass (see Sect. 4.1).
-
b)
The column density has been derived from an LVG simulation, reproducing the beam size corrected 13CO =1–0, 2–1, and 3–2 line intensities (Table 1 and Sect. 4.2.1) and applying a velocity gradient of /2 = 0.27 pc-1. With a 12CO/13CO abundance ratio of 50 (Johansson et al. 1994) the CO column density becomes . The fractional abundance is [CO]/[H2] = . This is 20% of the value in Galactic clouds (e. g. Wilson et al. 1986), reflecting the low carbon abundance in star-forming regions of the SMC ([C/H] 1.3; Westerlund 1990).
-
c)
CN excitation temperatures are small ( 10 K) at low densities () ), while abundances decrease at higher densities (e. g. Turner & Gammon 1975; Churchwell 1980; Churchwell & Bieging 1982, 1983; Crutcher et al. 1984; Henkel et al. 1988; Johansson et al. 1994). With an excitation temperature of 10 K and accounting for the fact that the LTE intensity of the =1–0 =3/2–1/2 =5/2–3/2 CN line only comprises one third of the total =1–0 line intensity under optically thin conditions (Skatrud et al. 1983), we find the given beam averaged 3 upper CN column density limit. See also Sect. 4.2.4.
-
d)
See Sect. 4.2.5.
-
e)
The column density is derived in the same way as for HCN (see footnote f). Different densities and temperatures were chosen to account for HCO+ depletion at highest densities and for the suspected large spatial extent of the HCO+ emission region (e. g. Chin et al. 1997).
-
f)
HCN is suspected to emit mainly from the coolest and densest parts of the cloud (cf. Johansson et al. 1994; Chin et al. 1997), so that = 20 K and ) = 106.5 are appropriate. The column density was derived with an LVG code (see also footnote b). The HCN (3–2) upper limit (Table 1) is not small enough to provide a stringent density limit.
-
g)
The column density is derived in the same way as for HCN (see footnote f). Since [HCN]/[HNC] abundance ratios tend to drop with rising density (Schilke et al. 1992), ) = 105.5 is justified.
-
h)
The column density was derived from an LVG simulation with =3–2 line intensities being slightly weaker (by 30%) than the 2–1 lines (see also Sect. 4.2.5).
4.2.6 Column densities
Having estimated the molecular densities in Sects. 4.1, 4.2.1, and 4.2.5 and having a quantitative idea of the kinetic temperature distribution (Lequeux et al. 1994), we can now also determine the column densities for various molecular species. Both temperature and density vary inside the cloud and each molecule and transition is tracing gas at different temperature and density; error limits are thus difficult to assess. Nevertheless, our data allow a rough estimate of molecular abundances in the optically thin limit. This is the appropriate approach, firstly because we do not know the optical depth of most lines and secondly because Johansson et al. (1994) find HCO+, HCN, and CS to be (almost) optically thin in their mm-wave transitions toward the prominent LMC star-forming region N 159. Assumed kinetic temperatures, densities, and resulting absolute and fractional (relative to H2) column densities for a 50′′ (15 pc) beam size are given in Table 2.
A comparison with Galactic disk values directly shows that the LIRS 36 fractional abundances, [X]/[H2], are much smaller (e. g. Blake et al. 1987): For CO, CS, HCO+, and H2CO, underabundances relative to the Orion extended ridge or to the prototypical dark cloud TMC-1 are 10. For HCN and HNC and probably for CN as well, underabundances reach two orders of magnitude and are thus even surpassing those reported by Johansson (1997) for the LMC star-forming region N 159. It is quite remarkable that CN is not enhanced relative to HCN and HNC as observed in Galactic disk photodissociation regions with high UV fluxes (Fuente et al. 1993; Greaves & Church 1996). We may suspect that the low LIRS 36 fractional abundances of HCN, HNC, and CN are related to a small nitrogen abundance. With average values of [N/H] = 1.1 and [C/H] = 1.3 in star-forming regions of the SMC (Westerlund 1990), however, nitrogen is not the most depleted among the CNO elements. It thus remains to be seen whether the HCN, HNC, and CN fractional abundances are related to an exceptionally small nitrogen abundance in LIRS 36 or whether they are caused by a chemical process that is found in other molecular SMC cores as well.

4.2.7 Chemical model calculations
We have used the models described by Chin et al. (1997) to investigate the chemical evolution of LIRS 36 using elemental abundances of C, N, and O from the S2 model of Millar & Herbst (1990). Because observed emission clearly arises in regions having different densities and because we have no information on the density profile within the molecular cloud nor on the the size of the high density CS clump, we have considered a simple constant density model with densities in the range ) = and = 20 K. For comparison, we have also calculated a ‘Galactic’ model (model ‘G’ of Millar & Herbst 1990) for ) = (Fig. 3). In addition to a lower metallicity, the SMC models have a smaller dust-to-gas ratio, and hence H2 formation rate, by a ratio of 6.5 and a UV intensity larger by a factor of 4, compared to Galactic values. There are conflicting results on the appropriate cosmic-ray ionisation rate. Chi & Wolfendale (1993) have argued that, based on gamma-ray observations, the rate in the SMC is at most 11% of the Galactic value. However, observations of HCO+ in the LMC and SMC (Chin et al. 1997) indicate that the rate is larger than that implied by Chi & Wolfendale. In these models we use a rate of s-1, three times larger than the Galactic value. The main impact of this rate is to increase the ionisation fraction and to reduce the chemical time-scales. Finally, we have used a visual extinction of 10 mag. in calculating photorates. While this is obviously too large for the molecular envelope of LIRS 36, the central region, in which densities greater than are derived from CS, could easily have an extinction large enough to exclude photoeffects even with a low dust-to-gas ratio.
The results of our four model calculations are summarised in Fig. 3 and indicate that the abundance of CN is sensitive to the O2 abundance since this species destroys CN with a fast, measured rate coefficient of (/300 K)-0.6 cm3 s-1 down to 20 K (Sims et al. 1994). The fractional abundance of O2 increases as one goes from the Galactic to the SMC model at ) = and as density increases because of the decreasing abundance of C atoms which destroy O2. In model S2 there is more free oxygen remaining after all available carbon has been tied up in CO so that the importance of the destruction of CN by O2 increases. Note that the ratio, where represents the elemental abundance of species , varies between 2.4 (model G) and 10.5 (model S2) while the difference between the elemental abundances of and is (model G) and (model S2), and the ratio (, increases from 1.4 (model G) to 10.4 (model S2). These values show that in model S2 there is a lot of oxygen remaining after all the carbon has been processed into CO and thus the importance of CN destruction by O2 is more important in the SMC models.
The fractional abundance of CN decreases by about a factor of 3 as one goes from model G to S2 and by a further factor of 100 as the density increases from to . As a result, the abundance of CN becomes less than or comparable with those of HCN and HNC at high density. On the other hand, CS is not destroyed by O2 or O atoms and its abundance changes by less than a factor of two over all the models investigated. Note that the maximum fractional abundance of CN at 106 is only for chemical timescales yrs; for longer times, the abundance falls rapidly to its steady-state value of .
5 Conclusions
Having made a mm-wave molecular survey of the LIRS 36 star-forming region in the SMC, we obtain the following main results:
-
(1)
We have detected CO, CS, SO, C2H, HCO+, HCN, HNC, H2CO, and C3H2. NO, CH3OH, and, surprisingly, CN were not detected. Among the rare isotopic species, we have seen 13CO and tentatively C34S, but not C18O.
-
(2)
For a characteristical scale length of 10 pc and assuming virial equilibrium, the = (H2)/ conversion factor is with ()-1 a factor of two larger than the local Galactic disk -factor. SMC -factors given by Rubio et al. (1993a) for this scale length may have to be reduced by half an order of magnitude.
-
(3)
Density estimates range from ) 100 (deduced from the virial masss and the spatial extent of the CO emission) over (from 13CO) to – (from CS). The observed CS transitions provide strong evidence for the presence of a very dense core with a density likely surpassing .
-
(4)
As in the LMC cloud cores, the (13CO)/(C18O) line intensity ratio is larger than the usual values encountered in the Galactic disk. Whether this is caused by isotopic abundance anomalies, by isotope selective photodissociation, or by chemical fractionation remains an open question.
-
(5)
(HCO+)/(HCN) and (HCN)/(HNC) line intensity ratios are 1, consistent with molecular emission from a warm ( 10 K) molecular environment exposed to a high ionizing flux.
-
(6)
Fractional (relative) abundances of CO, CS, HCO+, and H2CO are an order of magnitude below those of the Galactic disk. HCN, HNC, and likely also CN are even underabundant by two orders of magnitude. Whether this is reflecting a particularly small nitrogen abundance in LIRS 36 or whether this is a common chemical peculiarity of other SMC cores as well remains open. The non-detection of CN can be explained in terms of the high cloud density and a (relatively) high fractional abundance of O2 that is destroying CN but not CS.
Acknowledgements.
We thank A. Heikkilä for critically reading the manuscript. YNC thanks for financial support through National Science Concil of Taiwan grant 86-2112-M001-032. TJM is supported by a grant from PPARC. Financial support enabling JBW to travel to SEST was provided by the Department of Industry Science and Tourism, Australia.References
- [1999] Bachiller R., Cernicharo J., 1986, A&A 166, 283
- [1999] Bally J., Langer W.D., 1982, ApJ 255, 143
- [1999] Blake G.A., Sutton E.C., Masson C.R., Phillips T.G., 1987, ApJ 315, 621
- [1999] Bohlin R.C., Savage B.D., Drake J.F., 1978, ApJ 224, 132
- [1999] Chi X., Wolfendale A.W., 1993, J. Phys. G, 19, 795
- [1999] Chin Y.-N., Henkel C., Whiteoak J.B., Langer N., Churchwell E.B., 1996, A&A 305, 960
- [1999] Chin Y.-N., Henkel C., Whiteoak J.B., et al., 1997, A&A 317, 548
- [1999] Churchwell E., 1980, ApJ 240, 811
- [1999] Churchwell E., Bieging J.H., 1982, ApJ 258, 515
- [1999] Churchwell E., Bieging J.H., 1983, ApJ 265, 216
- [1999] Crutcher R.M., Churchwell E., Ziurys L.M., 1984, ApJ 283, 668
- [1999] Fuente A., Martín-Pintado J., Cernicharo J., Bachiller R., 1993, A&A 276, 473
- [1999] Greaves J.S., Church S.E., 1996, MNRAS 283, 1179
- [1999] Heikkilä A., Johansson L.E.B., Olofsson H., 1997, IAU Symp. 178 Abstract Book, Molecules in Astrophysics, Probes and Processess, eds. D.J. Jansen, M.R. Hogerheijde, E.F. van Dishoeck, Leiden, p301
- [1999] Henkel C., Mauersberger R., 1993, A&A 274, 730
- [1999] Henkel C., Mauersberger R., Schilke P., 1988, A&A 201, L23
- [1999] Henkel C., Whiteoak J.B., Nyman L.-Å, Harju J., 1990, A&A 230, L5
- [1999] Henkel C., Mauersberger R., Wiklind T., Hüttemeister S., Lemme C, Millar T.J., 1993, A&A 268, L17
- [1999] Johansson L.E.B., 1991, IAU Symp. 146, Dynamics of Galaxies and their Molecular Cloud Distributions, eds. F. Combes, F. Casoli, Kluwer Academic Publishers, Dordrecht, p1
- [1999] Johansson L.E.B., 1997, IAU Symp. 178, Molecules in Astrophysics, Probes and Processes, ed. E.F. van Dishoeck, Kluwer Academic Publishers, Dordrecht, p515
- [1999] Johansson L.E.B., Olofsson H., Hjalmarson Å, Gredel R., Black J.H., 1994, A&A 291, 89
- [1999] Lada C.J., 1976, ApJS 32, 603
- [1999] Larson R.B., 1981, MNRAS 194, 809
- [1999] Lequeux J., Le Bourlot J., Pineau de Forêts G., et al., 1994, A&A 292, 371
- [1999] Linke R.A., Goldsmith P.F., 1980, ApJ 235, 437
- [1999] Mauersberger R., Henkel C., 1989, A&A 223, 79
- [1999] Mauersberger R., Henkel C., Sage L.J., 1990, A&A 236, 63
- [1999] MacLaren I., Richardson K.M., Wolfendale A.W., 1988, ApJ 333, 821
- [1999] Millar T.J., Herbst E., 1990, MNRAS 242, 92
- [1999] Nyman L.-Å., 1984, A&A 141, 323
- [1999] Nyman L.-Å., Millar T.J., 1989, A&A 222, 205
- [1999] Nyman L.-Å., Olofsson H., Johansson L.E.B., Booth R.S., Carlström U., Wolstencroft R., 1993, A&A 269, 377
- [1999] Rubio M., Garay G., Lequeux J., 1997, IAU Symp. 178 Abstract Book, Molecules in Astrophysics, Probes and Processes, eds. D.J. Jansen, M.R. Hogerheijde, E.F. van Dishoeck, Leiden, p302
- [1999] Rubio M., Lequeux J., Boulanger F., 1993a, A&A 271, 9
- [1999] Rubio M., Lequeux J., Boulanger F., et al., 1993b, A&A 271, 1
- [1999] Schilke P., Walmsley C.M., Pineau de Forêts G., et al.. 1992, A&A 256, 595
- [1999] Schwering P.B.W., Israel F.P., 1989, A&AS 79, 79
- [1999] Sims I.R., Queffelec J.L., Defrance A., Rebrion-Rowe C., Travers D., Bocherel P., Rowe B.R., Smith I.W.M., 1993, JCP 100, 4229
- [1999] Skatrud D.D., de Lucia F.C., Black G.A., Sastry K.V.L.N., 1983, J. Mol. Spec. 99, 35
- [1999] Turner B.E., Gammon R.H., 1975, ApJ 198, 71
- [1999] van Dishoeck E.F., Black J.H., 1988, ApJ 334, 771
- [1999] Watson W.D., Anicich V.G., Huntress W.T., 1976, ApJ 205, L165
- [1999] Westerlund B.E., 1990, A&AR 2, 29
- [1999] Wilson T.L., Rood T.R., 1994, ARA&A 32, 191
- [1999] Wouterloot J.G.A., Walmsley C.M., 1986, A&A 168, 237
- [1999] Ziurys L.M., Snell R.L., Dickman R.L., 1989, ApJ 341, 857