The Globular Cluster System of the Sagittarius Dwarf Spheroidal Galaxy: The age of Terzan 8 ††thanks: Based on data taken at the New Technology Telescope - ESO, La Silla.
Abstract
We present deep V,I CCD photometry of the globular cluster Terzan 8, recently found to be a member of the globular cluster system of the Sagittarius dwarf spheroidal galaxy. We accurately estimate the metallicity of Ter 8 and provide the first direct determination of the color excess toward this cluster. Our robust age estimate confirms that this cluster is indeed coeval with typical galactic globulars of comparable metal content, and thus it is probably significantly older than at least two other Sagittarius clusters, Terzan 7 and Arp 2. The implications of this result on the star formation history of the Sagittarius galaxy are briefly discussed.
keywords:
dwarf galaxies: general; globular clusters: age.1 Introduction
The discovery of the Sagittarius dwarf spheroidal galaxy (Sgr dSph), by Ibata, Gilmore & Irwin (1994, hereafter IGI-I), is certainly one of the most exciting findings of the decade in the field of Galactic astronomy. The Sgr dSph is the most prominent member of the family of dwarf spheroidals orbiting the Milky Way (MW) both in luminosity () and extension on the sky (at least degrees); in addition, it is by far the nearest galaxy to us (see Ibata et al. 1997, and references therein). Because of its position within the Galaxy and its morphology, it is commonly believed that the Sgr dSph is being subjected to serious disruption by the tidal field of the MW and its destiny will be, sooner or later, to dissolve into the main body of the Galaxy. Furthermore, four globular clusters, previously thought to be ordinary Galactic globulars (i.e. NGC 6715 = M54, Arp 2, Terzan 7, Terzan 8), are now believed to belong to the Sgr dSph on the basis of their phase space coincidence with it (Da Costa & Armandroff 1995, IGI-I, Ibata et al. 1997), and at least two of them (Arp 2, Terzan 7) are also members of a small subset of halo globulars whose age is significantly ounger than the bulk of galactic globular clusters (see Fusi Pecci et al. 1995, hereafter FBCF, and references therein).
So, we are apparently witnessing the practical realization of the Searle and Zinn (SZ) paradigm for the formation of the galactic halo (Searle & Zinn 1978, Lee 1993, Zinn 1996 and references therein): a small galaxy which has experienced a star formation/chemical enrichment history mostly independent of the MW, and is participating in the build up of the galactic halo, adding its own young globulars to the MW globular cluster system.
The relevance of this kind of mechanism to the formation of the bulk of the halo is still under debate, and several recent results have cast some doubt on the basic assumptions of the SZ model of galaxy formation (namely the very existence of an age gradient in the halo GC system, see FBCF, Fusi Pecci & Bellazzini 1997 and Harris et al. 1997 for deeper insights and references). Nevertheless, the above arguments make the Sagittarius galaxy and its globular cluster system particularly worthy of interest. In fact, its star formation/chemical enrichment history and its connection to the Galaxy can help to shed light on many mysteries concerning the evolution of dwarf spheroidal systems (see Gallagher & Wise 1994 for a review about dSph’s) and the formation of the Galactic Halo.
For these reasons we started a long-term program devoted to the determination of ages and chemical characteristics of the Sagittarius system. Some important steps in this respect have already been accomplished by our group in determining the age of Arp 2 and Terzan 7 (Buonanno et al. 1994, Buonanno et al. 1995a, Buonanno et al. 1995b), even before the very existence of Sgr dSph was recognized. Moreover, photometric studies of the main member of the Sgr dSph GC system (M54=NGC6715) have recently been published by Sarajedini & Layden (1995), Marconi et al. (1997), Layden & Sarajedini (1997) and Layden & Sarajedini (1998).
Here we present the Color Magnitude Diagram (CMD) of Terzan 8 from deep (V,I) photometry obtained with the ESO New Technology Telescope and the CTIO 0.9 m telescope, in order to provide a relative age estimate which is much more accurate than those available so far. The only previous study of this cluster was performed by Ortolani & Gratton (1990, hereafter OG90); the photometry presented here reaches a fainter limiting magnitude and provides a much better definition of the principal sequences in the CMD (see sec. 4 and compare with fig. 10b of OG90).
The plan of the paper is as follows: in section 2 and 3, we describe the observations and data-reduction processes, respectively; in section 4, we present the CMD of Terzan 8 and measure its metallicity and reddening; finally, in section 5, we derive the age of the cluster and we discuss our results.
2 Observations
The data presented in this paper has been secured during two different observational runs.
| Date | Filter | Exp. | Seeing |
|---|---|---|---|
| time | (FWHM) | ||
| June 11, 1996 | V (ESO 606) | 60 s | |
| June 11, 1996 | I (ESO 610) | 60 s | |
| June 11, 1996 | V (ESO 606) | 1800 s | |
| June 11, 1996 | I (ESO 610) | 1800 s | |
| June 11, 1996 | V (ESO 606) | 2400 s | |
| June 11, 1996 | I (ESO 610) | 2400 s | |
| June 12, 1996 | I (ESO 610) | 1200 s |
| Date | Filter | Exp. | Seeing |
|---|---|---|---|
| time | (FWHM) | ||
| May 30, 1996 | I (CTIO I31) | 350 s | |
| May 30, 1996 | V (CTIO Vtek2) | 200 s | |
| May 30, 1996 | B (CTIO Btek2) | 420 s | |
| May 30, 1996 | I (CTIO I31) | 350 s | |
| May 30, 1996 | V (CTIO Vtek2) | 200 s | |
| May 30, 1996 | B (CTIO Btek2) | 420 s | |
| May 30, 1996 | I (CTIO I31) | 350 s | |
| May 30, 1996 | V (CTIO Vtek2) | 200 s | |
| May 30, 1996 | B (CTIO Btek2) | 420 s |
The main set of observations were carried out at ESO-La Silla (Chile) in June 1996 with the 3.5m NTT. In order to minimize the contamination by galactic field stars, which is significant at the position of Terzan 8 () we planned to take advantage of the high spatial resolution of the SUSI camera (Zjilstra et al. 1996) to probe the inner regions of the cluster. Unfortunately, the weather conditions were unsatisfactory (two out of three nights allocated to this project were mostly cloudy) and the modest seeing conditions (ranging from ) lead us to prefer the wider field of the EMMI camera with the RILD setup (Zjilstra et al. 1996). This instrument provides an optically corrected and unvignetted field of . The detector was a Tek 2048 CCD ( pxs, pixel size ) with a read-out noise of rms, a dark current of and a gain factor of 1.34 . The image scale is .
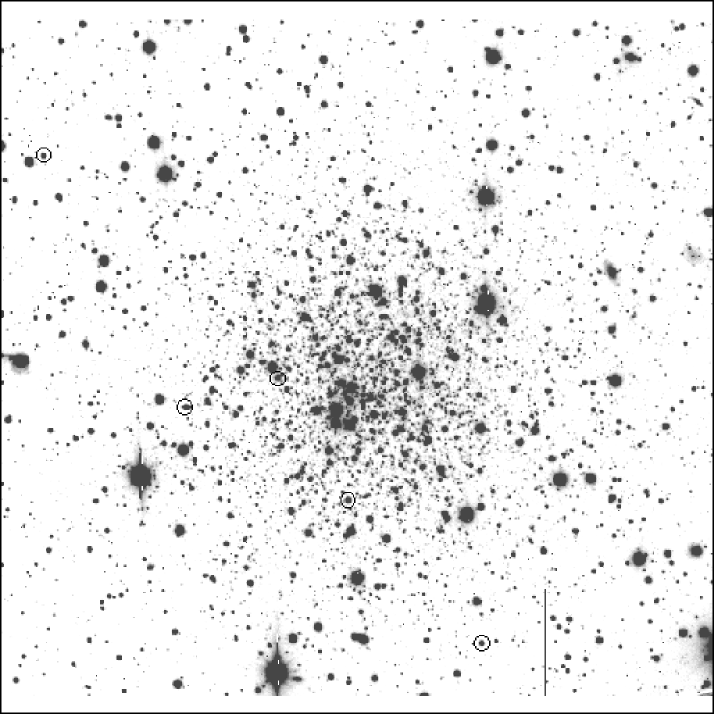
The EMMI wide field covers almost the whole cluster, so only one field, roughly centered on the cluster, was observed during the run; its field of view is displayed in Figure 1.
Due to unstable weather conditions, only frames obtained under acceptable seeing conditions () have been used in this study. Table 1 shows the observing log for each selected frame. Due to non-photometric conditions no standard stars were observed during this run (NTT).
A second set of B,V and I frames has been obtained at the 0.9 m telescope at CTIO during the night of May 30, 1996. All of the frames were taken in optimal photometric conditions, and many standard star fields have also been secured. The log of observations is listed in table 2. The detector at CTIO was also a Tek 2048 CCD with pixel size ; it was operating at a gain setting of 3.3 , a read-out noise of rms, and a dark current of . For this telescope/detector combination, the linear scale is , so the field covered was about . The CTIO CCD was controlled by the CTIO ARCON system, and used the standard quad amplifier mode for readout of images.
3 Reductions
3.1 CTIO data

All photometric reductions of the CTIO data were done using IRAF 111IRAF is distributed by the National Optical Astronomy Observatories which are operated by the Association of Universities for Research in Astronomy, Inc. under cooperative agreement with the National Science Foundation. on a dual 200 Mhz Pentium Pro system running Solaris 2.5 for x86 processors at the University of Alaska in Anchorage. Preprocessing of the CTIO material was carried out at Kitt Peak National Observatory using standard IRAF/QUADPROC procedures. The CTIO data were used to provide a photometric calibration for the NTT observations. This was done by first establishing the photometric transformations to the V, B-V, V-I system using standard star observations of selected fields in the list by Landolt (1993). A total of 38 different stars were observed from several fields, covering a wide range of colours. Extinction was well determined since the standard star observations covered a range from 1.1 to 2.1 airmass.
Reduction of the standard star data was done using standard processing within the IRAF/DAOPHOT/PHOTCAL routines. The B, V, and I equations were fit separately in this processing, yielding the following transformation equations:
where X is the airmass;, b, v, and i are the instrumental observations, and B, V, and I are the Landolt (1993) standard values. The root mean square deviation of the standard values from these fits are 0.018 mag, 0.012 mag, and 0.024 mag, respectively.
The cluster frames were processed individually rather than averaging exposures in each filter. A spatially variable point spread function (PSF) was determined for each frame using a single set of 150 stars and each frame was processed with DAOPHOT/ALLSTAR. The aperture correction was accomplished using a single set of 14 stars observed in all frames with ALLSTAR as well as with PHOT using the same configuration employed with the photometric standard stars.
However, checking the variation of the aperture correction as a function of X, Y , and radial position (R) relative to the cluster center revealed a quadratic dependence of the aperture correction on R. This variation appears to be due to the spatially variable PSF, which is itself caused by curvature in the surface of the CCD, optical problems in imaging, etc. The effect is small in this case, amounting to corrections on the order of 0.0 to 0.03 mag over the field, except for V which displayed a slightly larger variation.
A quadratic equation was fitted to the spatially variable aperture correction and applied to the ALLSTAR output magnitudes. The resulting instrumental photometry was transformed to the standard system and combined in the following manner. The nine frames were grouped in three sets of B, V, I images, so the final result was three sets of V, B-V, V-I data. These three data sets were averaged, with rejection of stars which were not found in all three sets within one pixel of each other, and with any star rejected if the V magnitude varied by more than 0.05 magnitude. This final, averaged result was then used to calibrate the NTT data as described below.
Figure 2(a,b) shows the (V, B-V) and (V, V-I) diagrams obtained from the CTIO observations. Because of the wide field, the contamination by galactic field stars is quite high in these diagrams. Nevertheless the RGB and the blue HB are clearly identifiable in both diagrams.
3.2 NTT data
All of the reductions were carried out using the DAOPHOT package (Stetson 1987) mounted on a Digital-Alpha station of the Bologna Observatory. In order to determine the PSF and to find and fit stars in each frame, we adopted the standard procedure as described by Stetson (1987).
The program stars were detected automatically adopting a threshold-criterion () above the local background level. The searching procedure was performed independently on each frame listed in Table 1. In particular we used the shortest exposures () to properly measure the () brightest stars near the RGB tip, which were heavily saturated on the deeper exposures.
The instrumental magnitudes in each colour obtained in each frame were referred to the best quality frame assumed to be the reference, and then averaged properly weighting the photometric quality of each frame. Since our main goal was to derive a good estimate of the age and metallicity of the cluster using the principal sequences in the CMD, we optimized the process of data reduction in order to obtain a final CMD which is as clean as possible. For this reason, we used the image quality diagnostics in DAOPHOT to discard stars with poor measurements; no attempt was made to estimate the degree of completeness of the sample. At the end of the reduction procedure a set of instrumental magnitudes, colours and positions was obtained for a sample of 3115 stars.
Since no photometric calibration was obtained during the NTT run, we used the well calibrated CTIO set to link the NTT instrumental magnitudes to the standard Johnson system.

The cross correlation between the NTT and the CTIO catalogues identified 684 stars in common which were used to calibrate the NTT data. The equations relating the NTT instrumental system to the CTIO calibrated data set are:
and
as derived from the least squares fit (with a recursive 2 rejection) of magnitude residuals as a function of the NTT instrumental colour. The calibration curves are plotted in Figure 3. As can be seen, the stars in common cover a sufficiently wide range in colour which should prevent any residual uncorrected colour trend.
The list of the final calibrated magnitudes and positions for 3115 star identified in the field covered by our observations and which satisfy the above selection criteria, is available upon request to the first author222Send e-mail request to montegriffo.@astbo3.bo.astro.it.. Figure 4 shows the CMD obtained from the whole NTT sample of measured stars.
3.3 Photometric errors
A first-order estimate of the internal accuracy of the photometry can be obtained from the rms frame-to-frame scatter of the instrumental magnitudes, once they have been referred to the standard reference frame as described above.
The rms values has been computed for each individial star in the NTT data set according to the formula:
where and are the DAOPHOT photometric internal errors (Stetson 1987), is the number of independent magnitude estimates for the star, is the instrumental magnitude, and is the weighted mean instrumental magnitude of the stars. For the brightest stars, the only ones that were measured only on a single couple of frames (i.e. the short V and I exposures), we assumed .
The rms values obtained for the V and I filters are plotted in Figure 5a,b as a function of the mean calibrated magnitude adopted for each star. The mean errors for are less than 0.01 mag, and they are however less than 0.1 mag even at the faint limit.
3.4 Variable stars
The rms frame-to-frame scatter can be used to obtain indications on variability of the objects identified by our reduction procedure. In particular, the detection of any RR Lyrae variable can be important to clearly define the exact HB morphology of Ter 8 (i.e to establish whether all HB stars are bluer than the instability strip). From the analysis of Figure 5 it is evident that there are some stars which show rms values significantly higher than the mean value expected at the HB level (): these stars might be variables. On the basis of the rms scatter we identified candidates. Among them, five stars (namely # 117, 688, 1350, 1582, 2784) show large differences in magnitude also with respect to the CTIO measures, confirming they might be true variables. Their position (in pixels) and magnitude are listed in Table 3 (they are also identified in the map shown in Figure 1).
Our photometry does not have a sufficient time coverage to properly define a light curve, so the evidences presented here should be considered as preliminary indications of variability. A specific follow-up study is need to firmly establish their nature.

| Name | V | I | X | Y |
|---|---|---|---|---|
| 117 | 18.03 | 17.34 | 1381.9 | 152.6 |
| 688 | 17.55 | 16.29 | 998.4 | 563.0 |
| 1350 | 17.96 | 17.46 | 531.8 | 830.0 |
| 1582 | 17.27 | 16.35 | 796.3 | 913.1 |
| 2784 | 17.61 | 16.39 | 122.1 | 1551.1 |
4 The Color-Magnitude Diagrams
The inspection of the CMDs presented in Figure 2 and 4 shows that the field contamination by the Galaxy () is particularly severe at the latitude of Terzan 8. Despite this, the principal sequences of the cluster population in the CMD are quite well defined. The overall morphology of the CMD can be summarized as follows, as it appears from Figure 4.
-
•
The Red Giant Branch is well defined, though sparsely populated in the very upper portion. The brightest measured giant is located at and .
-
•
The Horizontal Branch (HB) is populated mainly on the blue side of the instability strip as expected for an old, metal poor population (Da Costa & Armandroff 1995, OG90) and the blue tail extends down to .
-
•
The subgiant branch (SGB) and the upper main sequence are defined and well populated down to and the main sequence turnoff (TO) can be located at , as measured from the derived ridge line and from the rms dispersion of the points around it in the TO region (see below).
In order to compute the mean ridge lines of the main branches of the CMD plotted in Figure 4 we followed an iterative process. First, the portions of the CMD containing the cluster branches were selected by eye. Then, we adopted two different methods depending on the magnitude:
-
1.
the bright region of the CMD (i.e. for , RGB and HB): we adopted the polynomial fitting technique described by Sarajedini & Norris (1994). The main branches have been iteratively fitted by a second order polynomial; in each iteration stars more distant than from the fit were rejected and the fitting procedure repeated until the solution was stable, i.e. no more stars were rejected.
The resulting equation was:
-
2.
the faint region of the CMD (i.e. , SGB and upper-MS): the stars were divided into 0.4-mag wide bins in V magnitude. The median color and magnitude of each bin was then computed and the stars more distant than from the median point of the bin were rejected. The process was repeated until the difference of the median between two successive iterations became negligible. The median points were then interpolated with a cubic spline.
The resulting ridge lines obtained as described above match smoothly at and have been tested to be very stable against different choices of the initially selected area. They provide an excellent representation of the branches of Terzan 8 CMD; the adoped normal point of the main branches are listed in Table 4.

4.1 The level of the Horizontal Branch
The horizontal part of the cluster HB is scarcely populated and falls in a region of the CMD where the field contamination is significant. To derive the 333In the following we define as the mean V magnitude of the RR Lyrae variables. In all cases in which a detailed study of the cluster RR Lyraes is not available, the mean V magnitude of the stars located in the instability strip is adopted as the estimator of (see Chaboyer, Demarque & Sarajedini, 1996, hereafter CDS). we followed the procedure already adopted in previous papers (see Ferraro et al. 1992; Ferraro, Fusi Pecci & Buonanno 1992; Sarajedini 1994; Cassisi & Salaris 1997).
We considered reference clusters with a) roughly comparable metallicity, b) a HB populated both on the blue and red side of the RR Lyrae region and c) a precise determination of the HB level is available from RR Lyrae analysis; then we shifted the Terzan 8 CMD until the HB sequence overlaps the blue HB of the reference cluster.
Since Terzan 8 is a quite metal poor cluster ( Da Costa & Armandroff, 1995), we adopted as reference clusters two well-studied metal poor clusters, i.e. M68 () and M15 (). A detailed study of the RR Lyrae population in M68 has recently been published by Walker (1994) who found . In figure 6 (panel a) the HB stars for Terzan 8 in the (V,V-I) plane (filled squares) have been shifted ( and ) to match the blue HB of M68 (open squares): the solid line is the level found by Walker (1994). This procedure yields .
M15 is a metal poor cluster with a large population of RR Lyraes (more than 100 has been listed by Sawyer-Hogg, 1973, but new candidates have been found by Ferraro & Paresce, 1993 and Butler et al. 1997). An accurate study of the RR Lyrae in M15 has been published by Bingham et al. (1984) who found . The zero point of the Bingham et al. (1984) calibration is consistent with the photographic study by Buonanno et al. (1983). For this reason, Figure 6b presents the HB stars in Terzan 8 in the (V,B-V) plane (from the CTIO observations) (filled squares) shifted (by and ) to match the blue HB tail of M15 (open squares) by Buonanno et al. 1983. This procedure yields . The heavy solid line is the level found by Bingham et al. (1984).
The two determinations turns out to be highly consistent; they differ by only one hundreth of a magnitude. OG90 do not provide an explicit extimate of but inspection of their CMD (OG90, fig. 9) suggests a good agreement with our measures. In the following, we adopt , the errors being a conservative estimate of the uncertainty of the procedure.

4.2 Metallicity and Reddening
As is well known the shape and position of the RGB can be used to derive a photometric estimate of the cluster metallicity and reddening. In order to get a simultaneous measure of and , we apply the SRM method developed by Sarajedini (1994) in the (V V-I) plane, using the and the RGB ridge line listed in Table 4 (see Sarajedini 1994 for definitions and details). The same procedure can also be applied in the (V B-V) plane using the appropriate calibration (Sarajedini & Layden 1997).
Assuming (see Section 4.1) we find and , respectively, in the (V,V-I) and (V,B-V) planes. With these values and the mean ridge lines listed in Table 4 the SRM method yields:
and
and ,
from (V,V-I) and (V,B-V) CMD, respectively. The relation by Dean et al. (1987) has been adopted in order to convert E(V-I) into E(B-V).
The errors associated with the derived quantities include the combination of three main uncertanties:
-
1.
the uncertainty of in the determination of the magnitude level of the HB (see the previous section);
-
2.
the uncertanty in V-I of the ridge line at the HB level, estimated to be mag, i.e. the local standard deviation from the ridge line.
-
3.
the uncertainty in B-V of the ridge line at the HB level, estimated to be , i.e. the local standard deviation from the ridge line.
As can be seen, the two semi-independent values derived for the metallicity and reddening are in excellent agreement. Moreover, the estimated metallicities show remarkable agreement with previous determinations, both photometric (, OG90) and spectroscopic (Da Costa & Armandroff 1995).
The weighted means of the two values yield and , where, besides the formal errors, the quoted errors take into account a conservative estimate of the uncertainty due to the sensitivity of the method to the details of the assumed ridge line especially in the case of metal poor clusters with very steep RGBs.
In summary our results provide: a) the first direct measure of the reddening for this cluster and b) a confirmation that the metallicity as measured by photometric parameters coincides with that found with spectroscopy of cluster giants.
So it seems that Terzan 8 does not suffer the same syndrome as the Sagittarius clusters (i.e. Ter 7) and the young clusters (Pal 12), whose spectroscopic measures yield a higher metal content than the photometric ones (by ; see FBCF, Sarajedini & Layden 1997, Da Costa & Armandroff 1995). Indications for a decoupling of spectroscopic and photometric metallicity indexes has been found also for Arp 2 and Rup 106 (FBCF,Sarajedini & Layden 1997) though the differences are not inconsistent within the measurement errors. However, the high dispersion spectroscopy study of Rup 106 giants by Brown, Wallerstein & Zucker (1997) revealed that this cluster do indeed present significant chemical peculiarities with respect to a typical Halo population. So it seems not excluded that the spectroscopic vs. photometric differences in the measurement of clusters metallicity could track true differences in the chemical mix.
| RGB | |||||||
| V-I | V | V-I | V | V-I | V | V-I | V |
| 1.485 | 14.80 | 1.088 | 17.50 | 0.941 | 20.10 | 0.675 | 21.45 |
| 1.466 | 14.90 | 1.079 | 17.60 | 0.939 | 20.15 | 0.674 | 21.50 |
| 1.447 | 15.00 | 1.069 | 17.70 | 0.936 | 20.20 | 0.674 | 21.55 |
| 1.429 | 15.10 | 1.060 | 17.80 | 0.934 | 20.25 | 0.674 | 21.60 |
| 1.411 | 15.20 | 1.051 | 17.90 | 0.932 | 20.30 | 0.675 | 21.65 |
| 1.393 | 15.30 | 1.043 | 18.00 | 0.928 | 20.35 | 0.676 | 21.70 |
| 1.375 | 15.40 | 1.035 | 18.10 | 0.924 | 20.40 | 0.679 | 21.75 |
| 1.358 | 15.50 | 1.027 | 18.20 | 0.918 | 20.45 | 0.681 | 21.80 |
| 1.341 | 15.60 | 1.019 | 18.30 | 0.909 | 20.50 | 0.685 | 21.85 |
| 1.325 | 15.70 | 1.012 | 18.40 | 0.896 | 20.55 | 0.688 | 21.90 |
| 1.309 | 15.80 | 1.005 | 18.50 | 0.880 | 20.60 | 0.692 | 21.95 |
| 1.293 | 15.90 | 0.999 | 18.60 | 0.860 | 20.65 | 0.697 | 22.00 |
| 1.278 | 16.00 | 0.993 | 18.70 | 0.836 | 20.70 | 0.702 | 22.05 |
| 1.263 | 16.10 | 0.987 | 18.80 | 0.817 | 20.75 | 0.707 | 22.10 |
| 1.248 | 16.20 | 0.981 | 18.90 | 0.798 | 20.80 | 0.712 | 22.15 |
| 1.234 | 16.30 | 0.976 | 19.00 | 0.779 | 20.85 | 0.718 | 22.20 |
| 1.220 | 16.40 | 0.972 | 19.10 | 0.761 | 20.90 | 0.723 | 22.25 |
| 1.206 | 16.50 | 0.967 | 19.20 | 0.744 | 20.95 | 0.729 | 22.30 |
| 1.193 | 16.60 | 0.963 | 19.30 | 0.730 | 21.00 | 0.735 | 22.35 |
| 1.180 | 16.70 | 0.960 | 19.40 | 0.718 | 21.05 | 0.741 | 22.40 |
| 1.167 | 16.80 | 0.956 | 19.50 | 0.708 | 21.10 | 0.747 | 22.45 |
| 1.155 | 16.90 | 0.953 | 19.60 | 0.700 | 21.15 | 0.753 | 22.50 |
| 1.144 | 17.00 | 0.951 | 19.70 | 0.693 | 21.20 | 0.759 | 22.55 |
| 1.131 | 17.10 | 0.948 | 19.80 | 0.687 | 21.25 | 0.765 | 22.60 |
| 1.120 | 17.20 | 0.946 | 19.90 | 0.683 | 21.30 | 0.771 | 22.65 |
| 1.109 | 17.30 | 0.944 | 20.00 | 0.679 | 21.35 | 0.777 | 22.70 |
| 1.099 | 17.40 | 0.943 | 20.05 | 0.677 | 21.40 | 0.783 | 22.75 |
| HB | |||||||
| V-I | V | V-I | V | V-I | V | V-I | V |
| 0.050 | 19.22 | 0.175 | 18.31 | 0.300 | 18.09 | 0.425 | 17.95 |
| 0.075 | 18.82 | 0.200 | 18.25 | 0.325 | 18.06 | 0.450 | 17.93 |
| 0.100 | 18.61 | 0.225 | 18.21 | 0.350 | 18.03 | 0.475 | 17.91 |
| 0.125 | 18.48 | 0.250 | 18.16 | 0.375 | 18.00 | 0.500 | 17.88 |
| 0.150 | 18.38 | 0.275 | 18.13 | 0.400 | 17.98 | 0.525 | 17.86 |
5 The Age of Terzan 8
A most efficient way to study the relative ages of clusters having similar metallicities is by a detailed comparison of the main branches in the CMD.
In Figure 7, the ridge line of Terzan 8 is shifted by and to match the CMD of M68 (Walker 1994) and by and to match the CMD of M55 (Ortolani & Desidera, private communication). Neither the Ter 8 ridge line nor the reference CMDs have been corrected for reddening. However, we have taken E(B-V) values for M55 and M68 from the compilation of Peterson (1993) to check if the adopted (V-I) shifts are consistent with the expected differences in color excess between Ter 8 and the reference clusters. The color shift applied to Ter 8 relative to M68 is in excellent agreement with the estimated difference in color excess between the two clusters (). The same is found for Ter 8 relative to M55: the difference in color excess () turns to be in good agreement with the applied shift ().
The Terzan 8 mean loci agree quite nicely with those of both clusters, any subtle difference being attributable to unsignificant distortions of the shape of the ridge line.
In order to study the age of Terzan 8 in more detail, we compute the parameter, which is widely considered as one of the best diagnostics to quantify age differences between GC pairs (see Buonanno, Corsi & Fusi Pecci 1989; CDS, Stetson, Vandenberg & Bolte 1996).
From the mean ridge lines listed in Table 4, the TO point of Terzan 8 can be located at ; using the estimated above, and propagating errors, we find . This value is compatible with that found for M55 ( by Ortolani & Desidera) but slighlty greater than the figure determined by Walker (1994) for M68 (). Although the Terzan 8 and M68 values agree to within the errors, the weak indication from Fig. 7 that M68 may be slightly younger than Terzan 8 is marginally supported. Notwithstanding this small difference, which is of low significance given the size of the errors, we can conclude that the derived value of for Terzan 8 is in rather good agreement with those obtained for the typical old metal poor GGCs. Thus, Terzan 8 is apparently coeval with the bulk of the galactic globulars of the same metallicity class, implying that the first episodes of globular cluster formation took place at the same time in the Milky Way and in the Sagittarius galaxy.
A similar conclusion has been reached from the study of the oldest set of GC in the Large Magellanic Cloud (Testa et al. 1995, Brocato et al. 1996). Moreover deep HST photometry of the globular clusters n. 1, 2, 3 and 5 in the Fornax dSph has been recently presented by Buonanno et al. (1997). The ridge lines of the Fornax clusters were shown to match very well the same CMDs of M68 and M55 we used here for comparisons with Ter 8, so they too result coeval with ordinary old Galactic globulars. All these evidences suggests a scenario in which the formation of the oldest populations of clusters started at nearly the same era (within ) over a very wide volume around the Galaxy (see also Harris et al. 1997).

5.1 The Globular Cluster System of the Sagittarius Galaxy
The Sgr and Fornax dSph galaxies share the property of having their own globular cluster systems. This is a very lucky opportunity to provide constraints on the Star Formation History (SFH) of these galaxies, via age-dating of their clusters. While age estimates of the Fornax GCs will be soon available from HST data (Buonanno et al. 1997) reliable age determinations are indeed available (from ground based observations) for all GCs belonging to the Sgr galaxy: Arp 2, Ter 7 (Buonanno et al 1995a,b), M54 (Marconi et al. 1997; Layden & Sarajedini 1997), and Ter 8 (this paper).
So, the results from the relative age scale within the Sgr GC system provide the tantalizing possibility of studying its Age-Metallicity Relation (even if it will appear somewhat noisy due to observational and theoretical uncertainties). Given the measured and , we can derive the age differences of the Sgr clusters with respect to Ter 8 which happens to be the oldest and most metal-poor cluster of the group. This cluster also provides a strong tie to the Galactic GC system time-scale, being coeval with the oldest Galactic globulars. In order to derive the age differences, we use equations of the form provided by CDS, applying their prescription for clusters with stubby red HB morphologies to the case of Ter 7. For the sake of comparison we calculate under two different assumption for the slope of the relation between the absolute magnitude of the HB and the cluster metallicity, i.e.: , corresponding to the second row of Table 1 of CDS and corresponding to the last row of the same table (see Buonanno, Corsi, & Fusi Pecci 1989, CDS, and Vandenberg, Bolte & Stetson 1996 for discussion about the impact of on the Galactic age scales). It must be stressed that in the derivation of a relative age scale, only the slope of this relation is relevant.
Given the uncertainties in the observables and in the metallicity scale, the adoption of a calibration based on different isochrones would not have a significant impact on the derived relative age scale.
The results of our calculations are reported in Table 5, together with the metallicity and value of each cluster, along with the associated references. Two different entries are provided for the cluster Ter 7 reporting the differences in its relative age due to the adoption of the metallicity measurements obtained through spectroscopy of giant stars or via photometric methods. This specific topic is widely discussed in FBCF and Sarajedini & Layden (1997) and we will not provide here any new insight. Similar discrepancies are also found for M54 (Sarajedini & Layden 1995, 1997) and Arp 2 (FBCF), but they are only marginally significant. So we adopt, as a homogeneous set, the metallicity values derived via photometric methods (see Table 5 for references). It must be stressed that the presented age-scales are also affected by this further uncertainty.
In summary, any derived age scale is necessarily subject to a) errors in the observables, b) uncertainties in the slope of the relation, and c) uncertainties associated with the choice of the metallicity (photometric vs. spectroscopic), which is greater than the error of each single measure. To take into account all these sources of uncertainty we assign a conservative error-bar of to our relative age values.

With this assumpion, the two age-scales do not show significant differences. In the following discussion we will thus adopt the age-scale associated with the higher slope of the relation (i.e. ; column #5 of Tab. 4) as a conservative choice, being the one which minimizes the age differences between clusters.
| Cluster | [Fe/H] | Ref. | |||
|---|---|---|---|---|---|
| Ter 8 | 3.60 | 0.00 | 0.00 | present paper | |
| Ter 7 | 3.20 | 9.75 | 7.02 | B95a + S95 | |
| Ter 7 | 3.20 | 8.86 | 6.83 | B95a | |
| Arp 2 | 5.53 | 4.39 | B95b and SL97 | ||
| M 54 | 1.50 | 1.00 | SL95 and LS98 |
B95a = Buonanno et al. 1995a; B95b = Buonanno et al. 1995b; M97 = Marconi et al. 1997; S95 = Suntzeff et al. 1996; SL95 = Sarajedini & Layden. 1995; SL97 = Sarajedini & Layden 1997; LS98 = Layden & Sarajedini 1998;
a CDS erroneously interpreted the value provided by Buonanno et al. 1995b for this cluster as the V magnitude of the Zero Age Horizontal Branch and, consequently, applied an unnecessary correction to obtain for this cluster, since was instead estimated in a way very similar to the one applied in the present paper to Ter 8 (Buonanno et al., private communication).
b This is preferred over the M97 value because the photometry of LS98 (see also Layden & Sarajedini 1997) extends deeper than that of M97. However, within the errors, the values of M97 and LS98 are in reasonable agreement.
5.2 The Age - Metallicity Relation
Figure 8 displays the observed Age - Metallicity Relation (AMR) for the Sgr GC System, as derived with the prescription described above.
It is worth stressing that significant features are present in the diagram despite the large uncertainties involved and independent of the assumptions inherent in the adopted relation:
-
1.
Arp 2 and Ter 7 are certainly younger than Ter 8, i.e. overall globular cluster formation lasted for in the Sgr dSph .
-
2.
Ter 7 is at least three times more metal rich than any other Sgr cluster, i.e. a great deal of chemical enrichment occurred in the lapse of time during which all the Sgr globulars (and probably also the bulk of its field stars; see below) were formed.
Besides this, coupling the information contained in Figure 8 with the results of many recent studies of the Sgr galaxy and its clusters (see Ibata et al. 1997 and Layden & Sarajedini 1997 for references), we note that:
-
•
The presence of an old stellar population (i.e. of age comparable to Ter 8) in the Sagittarius galaxy is confirmed by the identification of RR Lyrae variables (Mateo et al. 1995; Alard 1996; Alcock et al. 1996) and Planetary Nebulae (Zijlstra & Walsh 1996), while the dominant population looks very similar to Ter 7, both in age and metallicity (Marconi et al. 1997). Any possible younger population, whose existence has been suggested by Mateo et al. (1995), Layden & Sarajedini (1997) and Whitelock et al. (1996), is constrained by the present data to contribute only a small fraction of Sgr stars. So, it seems reasonable to assume that the AMR presented in Figure 7 has to track the main features of the AMR of the whole galaxy.
-
•
From Figure 8 and from the above dicussion it is apparent that the Sgr dSph formed relatively metal poor stars and clusters for a significant fraction of its evolutionary history, but the main star formation event (i.e. the one associated with Ter 7) occured at a time when the interstellar medium had been greatly enriched in heavy elements. The process of enrichment could have been completed in , as judged from the age difference between Arp 2 and Ter 7.
-
•
Massive star formation in the Sgr dSph ceased several gigayears ago. Even if sporadic episodes occured later than the epoch during which Ter 7 formed, no hint has been found for the existence of populations younger than , and the system is presently found to be totally gas-depleted (Koribalski, Johnston & Optrupceck 1995). Coupled with the fact that the orbital path of Sgr brings it very near the Galactic bulge/disk (Ibata et al. 1997), this evidence strongly suggests that the star formation history of this galaxy has been largely influenced by some episode of gas-stripping due to interactions with the Milky Way. It seems also likely that the major mass contribution injected in the Galactic Halo and/or Disk by the Sgr system was in the form of enriched gas (presumably at the metallicity of Ter 7), not stars (see also Gilmore 1996).
-
•
A potentially powerful test to allow better time resolution at older ages would be to measure the ratio both in the GCs and the field stars of Sgr. It is reasonable to assume that, in the presence of previous star formation, clusters formed after the enrichment of the medium by type Ia supernovae (a time scale generally believed to be ; Wheeler, Sneden & Truran 1989) should display a lower ratio with respect to typical Galactic Halo GCs and stars (Wheeler, Sneden & Truran 1989; Cayrel 1996), while “ordinary” -enhancement would imply formation within from the onset of star formation in the system. The possibility that the Sgr globulars can present differences in abundance patterns has been already suggested and discussed by FBCF and Sarajedini & Layden (1997).
-
•
If Sgr has to be considered a typical SZ “fragment”, which is being accreted and is in the process of building up the Galactic Halo, the above considerations show that such systems may leave signatures in the ordinary Galactic Halo in the form of anomalies in the age and metallicity distributions of Halo globulars and field stars.
Acknowledgments
This research has made use of NASA’s Astrophysics Data System Abstract Service. We thank S. Ortolani and S. Desidera for kindly sending us the data on M55 before publication. Paolo Montegriffo was supported by a 1996-grant of the Fondazione del Monte, Rolo Banca 1473. Donald Martins was supported by a research and travel grant from the University of Alaska, Anchorage, and would like to acknowledge the friendly hospitality of the National Optical Astronomy Observatories during his visit there. Ata Sarajedini was supported by the National Aeronautics and Space Administration (NASA) grant number HF-01077.01-94A from the Space Telescope Science Institute, which is operated by the Association of Universities for Research in Astronomy, Inc., under NASA contract NAS5-26555. The finacial support of the Ministero delle Università e della Ricerca Scientifica e Tecnologica (MURST) and of the Agenzia Spaziale Italiana (ASI) is kindly acknowledged.
We are also indebted to an anonymous referee for the many useful comments.
References
- [1] Alcock, C. et al., 1997, ApJ, 474, 217
- [2] Alard, C., 1996, ApJ, 458, L17
- [3] Bingham, E.A., Cacciari, C., Dickens, R.J., Fusi Pecci, F., 1984, MNRAS, 209, 765
- [4] Brocato, E., Castellani, V., Ferraro, F.R., Piersimoni, A.M., Testa, V., 1996, MNRAS, 282, 614
- [5] Brown, J.A., Wallerstein, G., Zucker, D., 1997, AJ, 114, 180
- [6] Buonanno, R., Buscema, G., Corsi, C.E., Iannicola, G., Fusi Pecci, F., 1983, A&A Suppl., 51, 83
- [7] Buonanno, R., Corsi, C.E., Fusi Pecci, F., 1989, A&A, 216, 80
- [8] Buonanno, R., Corsi, C., Fusi Pecci, F., Fahlman, G.G., Richer, H.B., 1994, ApJ, 430, L121
- [9] Buonanno, R., Corsi, C.E., Fusi Pecci, F., Richer, H.B., Fahlman, G.G., 1995a, AJ, 109, 650
- [10] Buonanno, R., Corsi, C.E., Pulone, L., Fusi Pecci, F., Richer, H.B., Fahlman, G.G., 1995b, AJ, 109, 663
- [11] Buonanno, R., et al., 1997, in Views on Distance Indicators, F. Caputo, M. Arnaboldi & A. Rifatto Eds., Mem. SAIt., in press
- [12] Butler, R.F., Shearer, A., Redfern, R.M., Colhoun, M., O’Kane, P., Penny, A.J., Morris, P.W., Griffiths, W.K., and Cullum, M. 1997, MNRAS, in press
- [13] Cassisi, S., Salaris, M., 1997, MNRAS, in press
- [14] Cayrel, R., 1996, A&AR, 7, 217
- [15] Chaboyer, B., Demarque, P., Sarajedini, A., 1996, ApJ, 459, 558 (CDS)
- [16] Chaboyer, B., Demarque, P., Kernan, P. J., Krauss, L. M., and Sarajedini, A., 1996, MNRAS, 283, 683
- [17] Da Costa, G., Armandroff, T., 1995, AJ, 109, 2533
- [18] Djorgovski, S.G., 1993, in Structure and Dynamics of Globular Clusters, S.G. Djorgovski and G. Meylan Eds., ASP Conf. Series, vol. 50, p. 373
- [19] Fahlman, G.G, Mandushev, G., Richer, H.B., Thompson, I.B., Sivaramakrishnan, A., 1996, ApJ, 459, L65
- [20] Ferraro, F.R., Clementini, G., Fusi Pecci, F., Sortino, R., Buonanno, R., 1992, MNRAS, 256, 391
- [21] Ferraro, F.R., Fusi Pecci, F., Buonanno, R., 1992, MNRAS, 256, 376
- [22] Ferraro, F.R., Paresce, F., 1993, AJ, 106, 154
- [23] Ferraro, F.R., Fusi Pecci, F., Testa, V., Greggio, L., Corsi, C.E., Buonanno, R., Terndrup, D.M., Zinnecker, H., 1995, MNRAS, 271, 385
- [24] Fusi Pecci, F., Bellazzini, M., 1997, in Third Conference on Faint Blue Stars, A.G.D. Philips Ed., Cambridge University Press, in press (astro-ph/ 9701026)
- [25] Fusi Pecci, F., Bellazzini, M., Cacciari, C., Ferraro, F.R., 1995, AJ, 110, 1664 (FBCF)
- [26] Gallagher, J.S. III, Wyse, R.F.G, 1994, PASP, 106, 1225
- [27] Gilmore, G., 1996, in The formation of the Galactic Halo inside… and out, H. Morrison and A. Sarajedini eds., ASP Conf. Ser., vol 92, p. 161
- [28] Harris, W.E., Bell, R.A., Vandenbergh, D.A., Bolte, M., Stetson, P.B., Hesser, J.E., van den Bergh, S., Bond, H., Fahlman, G.G., Richer, H.B., 1997, AJ, in press, (astro-ph 9707048)
- [29] Ibata, R.A., Gilmore, G., Irwin, M.J., 1994, Nature, 370, 194 (IGI-I)
- [30] Ibata, R.A., Wyse, R.F.G., Gilmore, G., Irwin, M.J., Suntzeff, N.B., 1997, AJ, 113, 634
- [31] Koribalski, B., Johnston, S., Optrupceck, R., 1995, MNRAS, 270, L43
- [32] Landolt, A.U., 1993, AJ, 104, 340
- [33] Layden, A. C., Sarajedini, A. 1997, ApJL, in press
- [34] Layden, A. C., Sarajedini, A. 1998, in preparation
- [35] Lee, Y.W., 1993, in The Globular Cluster - Galaxy connection, G. Smith and J. Brodie, ASP conf. Ser., vol. 48, p. 142
- [36] Lee, Y.W., Demarque, P., Zinn, R., 1994, ApJ, 423, 248
- [37] Marconi, G., Buonanno, R., Castellani, M., Iannicola, G., Pasquini, L., Molaro, P., A&A, submitted (astro-ph/ 9703081)
- [38] Mateo, M., Kubiak, M., Szymansky, M., Kaluzny, J., Krzeminski, W., Udalski, A., 1995, AJ, 110, 1141
- [39] Ortolani, S., Gratton, R., 1990, A&A Suppl., 82, 71 (OG90)
- [40] Peterson, C.J., 1993, in Structure and Dynamics of Globular Clusters, S.G. Djorgovski and G. Meylan Eds., ASP Conf. Series, vol. 50, p. 337
- [41] Sarajedini, A., 1994, AJ, 107, 618
- [42] Sarajedini, A. 1994, PASP, 106, 404
- [43] Sarajedini, A., Norris, J. E. 1994, ApJS, 93, 161
- [44] Sarajedini, A., Layden, A., 1995, AJ, 109, 1086
- [45] Sarajedini, A., Layden, A., 1997, AJ, 113, 264
- [46] Sawyer-Hogg, H., A third Catalogue of Variable Stars in Globular Clusters, David Dunlap Obs.,3, n. 6, Toronto, University of Toronto
- [47] Searle, L., Zinn, R., 1978, ApJ, 225, 357 (SZ)
- [48] Stetson, P., 1987, PASP, 99, 191
- [49] Stetson, P., Vandenberg, D.A., Bolte, M., 1996, PASP, 108, 560
- [50] Suntzeff, N., Richer, H.B., Lin, D.N.C., 1996, in preparation
- [51] Testa, V., Ferraro, F.R., Brocato, E., Castellani, V., 1995, MNRAS, 275, 454
- [52] Vandenberg, D.A., Bell, R.A., 1985, ApJ Suppl., 58, 561
- [53] Vandenberg, D.A., Bolte, M., Stetson, P., 1996, ARA&A,
- [54] Unavane, M., Wyse, R.F.G., Gilmore, G., 1996, MNRAS, 278, 727
- [55] Walker, A., 1994, AJ, 108, 555
- [56] Wheeler, J.C., Sneden, C., Truran, J.W.Jr., 1989, ARA&A, 27, 279
- [57] Whitelock, P.A., Irwin, M., Catchpole, R.M., 1996, New Ast., 1, 57
- [58] Zinn, R., 1996, in The formation of the Galactic Halo inside… and out, H. Morrison and A. Sarajedini eds., ASP Conf. Ser., vol 92, p. 211
- [59] Zjilstra, A.A., Walsh, J.R., 1996, A&A 312, 21
- [60] Zjilstra, A.A., Giraud, E., Melnick, H., Dekker, H., D’Odorico, S., 1996, ESO Operating Manual n. 15, Version n. 3.0