Coulomb interactions in the intracluster medium
Abstract
In this paper we discuss the effect of Coulomb collisions on the temperature profiles of the intracluster medium in clusters of galaxies, motivated by recent reports of negative temperature gradients in some clusters by Markevitch et al. The timescale for electrons and protons to reach temperature equilibrium can exceed a few billion years beyond radii of a Mpc, if the intracluster gas is assumed to be at the usual cluster virial temperature. If a cluster merger has occurred within that time causing the protons, but not the electrons, to be rapidly heated then a small negative temperature gradient can result. This gradient is larger in clusters with high temperatures and steep density profiles.
Applying these considerations to the cluster of galaxies A2163, we conclude that, more plausibly, the observed gradient is due to a lack of hydrostatic equilibrium following a merger.
keywords:
X-ray: galaxies – galaxies: clusters: general – galaxies: clusters: individual: A21631 INTRODUCTION
Recent results on steep temperature profiles in some clusters of galaxies, as measured by ASCA X-ray spectra (Markevitch 1996 and Markevitch et al. 1996), have raised questions on the physical condition of the intracluster medium (ICM). At a radius of a few 100 kpc, the ICM has a characteristic density cm-3, temperature K and a heavy element abundance of about 30 per cent of the solar value. The density drops at larger radii approximately as .
Assuming a polytropic distribution for the gas, the temperature scales with density as
| (1) |
where the polytropic index ranges between 1 and 5/3, the limits corresponding to the gas being isothermal and adiabatic, respectively. Markevitch (1996) found that and 1.7 for the clusters A2163 and A665, respectively ( and 1.3 and the 90 per cent confidence level). When the gas is convectively unstable, which tends to produce turbulent motions in the ICM, resulting in a mixed, homogeneous gas after several sound crossing times. The detection of a dramatic drop in the temperature profile may be an indication that those clusters are observed in a very unusual, brief stage in their existence, perhaps having experienced a major merger within the previous few billion years.
An alternative possibility to explain the steep temperature decline , suggested by Markevitch (1996 and Markevitch et al 1996), is that the electron temperature, , which is the quantity measured by X-ray observations, is not representative of the mean gas temperature, . This can occur, for example if a shock has heated the ICM, with the protons receiving most of the energy so that the proton temperature greatly exceeds the electron temperature . Coulomb scattering then equilibrates the temperatures at a rate (Spitzer 1962):
| (2) |
In this equation, , the equipartition time via Coulomb scattering, is given by
| (3) |
where , is the proton density, is the Thomson scattering cross section and is the ratio of largest to smallest impact parameters for the collisions (, Sarazin 1988; note that a similar term in the corresponding dimensionless proton temperature is negligible for the conditions of the ICM). The rate is proportional to the gas density and so can be low, and the equilibration time long, at the outer parts of a cluster where the density is least.
Here we examine the equilibration timescale for a typical ICM under the conservation of total kinetic energy. We find (Section 2) that an implausibly short timescale is required for a large temperature gradient to be observed. Both the X-ray emission and the equilibration of the ICM depend upon Coulomb scattering, so when the rate of emission is high the rate of equilibration is also high. In Section 3, we apply these considerations to the case of A2163 and discuss our conclusions in Section 4.
2 Electron–proton Coulomb interactions


The accretion of infalling material on the cluster potential shock heats the protons to an initial temperature , which is representative of their isotropic Maxwellian velocity distribution. The protons equilibrate between themselves in a time shorter than by a factor , so that they can be considered to be in equilibrium when the heating event occurred a time in the past. The electrons, which are not strongly involved in shock events due to their negligible mass, achieve a low temperature .
Since the total kinetic energy density has to be conserved, we have the following implications: (i) the local mean gas temperature, ,
| (4) |
is constant with time; (ii) the initial is about 2.2 times the balanced temperature value, ; (iii) increases (and decreases) with time, with the energy exchange between protons and electrons driven by the relation
| (5) |
Rearranging eqn.(2) in the form:
| (6) |
and using relation (4), we can solve analytically eqn.(6), obtaining
| (7) | |||||
Where , such as in the outer part of the temperature profile given a high central temperature and steep density profile, we can further expand the logarithmic term in eqn.(6). Then, for constant, we obtain that .
We now parametrise the proton density by a model (Cavaliere & Fusco-Femiano 1978), as generally adopted for the description of the ICM with central density and core radius ,
| (8) |
and fix the electron density .
Results for reference values of Gyrs, = 8 keV, cm-3, Mpc and , are shown in Fig. 1. A significant small temperature gradient can remain at this reference time. In Fig. (1), we also show the projected temperature, , which is the emissivity-weighted :
| (9) |
where the volume emissivity is integrated along the line of sight at projected radius . It is more appropriate to compare with observed values and is shown to decrease more significantly than .

The dependence of the temperature gradient on , and the central value of , , is shown in Fig. 2 and 3. Note that the temperature gradient steepen when there is (i) a higher energy per particle (i.e. when a larger central is considered); (ii) a greater value for , so that the gas density becomes steeper; or, of course, (iii) the timescale is shorter.
In Fig. 4, we show how varies with . A 10 per cent difference in , with respect to , requires that , where is in Gyrs and in units of 10 keV. We note that the outer densities detectable by the ROSAT PSPC in deep cluster images are of order of about .
2.1 The presence of a gradient in the gas temperature
Above, we have considered the case of constant.
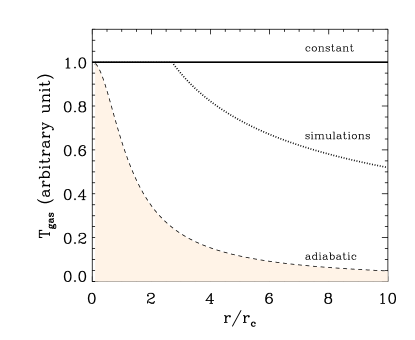
However, recent N-body simulations of clusters of galaxies (Navarro et al. 1996, Evrard et al. 1996) have shown that is almost constant in the range 0.1–0.4 (where indicates the radius at which the cluster mean density is 200 times the critical density value) and slightly decreases as towards the outer virialized part. Such a gradient is not unstable to convective mixing, from the adiabatic condition [cf. eqn.(1) and Fig. 5]:
| (10) |
We can use eqn.(7) (obtained under the condition of constant with time) to investigate the more extreme electron temperature gradient when the gas is adiabatic. We obtain a behavior of almost coincident with the profile shown in Fig. 5, for every considered.
3 The case of A2163
A long Coulomb equilibration timescale between electrons and protons has been suggested by Markevitch et al. as one explanation for the steep negative temperature profile observed in ASCA observations of A2163. We now try to test this possibility by comparing our calculated profile with the deprojected temperature in Abell 2163 (Markevitch et al. 1996; Elbaz et al. 1995; Fig. 6). In particular, we find that it is impossible to reconcile the theoretical temperature gradients with the observed one in the outer parts of the cluster, for any reasonable (even for 1 Gyr the disagreement is about of 5.4 ), if the final state for the ICM is isothermal. Only if we make the ad hoc assumption that the ICM is adiabatic beyond about one Mpc can we obtain some agreement (cf. dashed lines in Fig. 6).

We now consider whether the gas can be considered to be in hydrostatic equilibrium since the last plausible merger (a few billion years). The time required for a sound wave to cross a cluster is obtained by the relation , where and are the ICM pressure and density, respectively. Solving this relation with respect to time, we get , that does not depend significantly on any temperature (density) gradient. Using the values in Fig. 6 for A2163, we calculate that is , and Gyrs at 0.45, 1.43 and 2.99 Mpc, respectively (the errors are deviation obtained by propagation on and uncertainties). A critical condition for the hydrostatic assumption appears above 1.4 Mpc (), where the steep temperature profile requires that a merger occurred less than about 3 Gyrs ago, if the steepness is due to the Coulomb process. Then, the cluster appears unrelaxed in its outer parts, with the subsequent presence of gas bulk motions, whose pressure is not accounted for by the measured ICM temperature in the last spatial bin of Fig. 6 (see also the discussion in Markevitch et al. 1996). We conclude that in regions of space where the electron temperature is significantly below the proton temperature then it is likely that hydrostatic equilibrium has broken down.
Another timescale relevant to the thermalization of the ICM is the ionization equilibrium time of the abundant elements, . The emission lines of the highly ionized Fe atoms are the strongest features detected in numerous X-ray spectra of clusters of galaxies. Using the fitted parameters in Shull & Van Steenberg (1982) for the collisional ionization rate coefficients of the hydrogenic FeXXVI ions, we get Gyrs in the range for the density profiles considered above (i.e. and 1, keV). In the case of A2163, is of the order of a few tenth of Gyr, and less than 0.4 Gyr, which is shorter than any other timescale discussed here.
Finally, we note that the thermal conduction timescale on which temperature gradients are erased are much longer than the other timescales considered here by more than one order of magnitude.
4 CONCLUSIONS
In this paper, we have shown that electron–proton Coulomb interactions in ICM become inefficient in reaching the equipartition, steepen the electron temperature gradient significantly, only if (i) the energy per particle is high, (ii) the gas density profile is steep, and (iii) the time elapsed since the last merger, or proton heating event, is very short, i.e. . Local conservation of energy means that the proton temperature drops as the electron temperature rises. Regions of clusters where a large disequilibrium occurs are likely to both be out of hydrostatic equilibrium and to have low X-ray emission.
Similar conclusions are also presented by Fox & Loeb (1997), who consider Coulomb interactions in a plasma accreting on a cluster in the framework of the spherical self-similar model.
When applied to A2163, for which Markevitch et al. (1996) report a steep drop in electron temperature in the outer parts of the cluster, we find that we cannot reproduce the profile from gas in hydrostatic equilibrium, without requiring the mean gas temperature to drop sharply beyond about one Mpc.
ACKNOWLEDGEMENTS
We thank Paul Nulsen for discussion, and the anonymous referee for suggestions on improving this paper. SE acknowledges support from a PPARC studentship and a Cambridge European Trust Grant and ACF the support of the Royal Society.
References
- [] Cavaliere, A. & Fusco-Femiano, R., 1978, A&A, 70, 677
- [] Elbaz, D., Arnaud, M. & Böringher, H., 1995, A&A, 293, 337
- [] Evrard, A.E., Metzler, C.A. & Navarro, J.F., 1996, ApJ, 469, 494
- [] Fox, D.C. & Loeb, A., 1997, ApJ, submitted (astro-ph/9706266)
- [] Markevitch, M. et al., 1996, ApJ, 456, 437
- [] Markevitch, M., 1996, ApJL, 465 1
- [] Navarro, J.F., Frenk, C.S. & White, S.D.M., 1996, ApJ, 462, 563
- [] Sarazin, C.L., 1988, X-ray emission from clusters of galaxies, Cambridge University Press
- [] Shull, J.M. & Van Steenberg, M., 1982, ApJS, 48, 95
- [] Spitzer, L., 1962, Physics of Fully Ionized Gases J. Wiley & sons