X-ray emission, optical nebulosity and dust in early-type galaxies.
Abstract
We present new optical imagery of the X-ray bright elliptical galaxy NGC 5846, the dominant galaxy of a small group of galaxies. A filamentary dust lane with a dust mass of 7 M⊙ is detected in the central few kpc of NGC 5846. The optical extinction properties of the dust features are consistent with those of dust in our Galaxy. The morphology of the dust features are strikingly similar to that observed for the optical nebulosity and the X-ray emission. A physical connection between the different phases of the interstellar medium therefore seems likely.
We discuss three different options for the origin of the dusty nebular filaments: Condensation out of a cooling flow, mass loss of late-type stars within NGC5846, and material donated by a small neighbouring galaxy. We conclude that the dust as well as the optical nebulosity are most likely products of a recent interaction with a small, relatively gas-rich galaxy, probably of Magellanic type.
Dust grains in the dust lane are destroyed by sputtering in the hot, X-ray-emitting gas in yr, which is shorter than the crossing time of a (small) galaxy through the central 5 kpc of NGC5846. This indicates that the dust must be replenished to be consistent with the observed dust mass, at a rate of 10-3 M⊙ yr-1. We argue that this replenishment can be achieved by evaporation of cool, dense gas cloudlets that were brought in during the interaction. The evaporation rate of cool gas in NGC5846 is consistent with the “mass deposition rate” derived from X-ray measurements.
The energy lost by the hot gas through heating of dust grains and evaporation of cool gas clouds in the central few kpc of NGC5846 is adequately balanced by heat sources: transport of heat by electron conduction into the core of the X-ray-emitting gas and loss of kinetic energy of the in-falling galaxy. There does not seem to be a need to invoke the presence of a “cooling flow” to explain the X-ray and optical data.
Key words: galaxies: individual (NGC 5846) – galaxies: elliptical and lenticular, cD – galaxies: ISM – galaxies: structure
1 Introduction
Elliptical galaxies have long been considered to be inert stellar systems, essentially devoid of interstellar matter. However, our understanding of the nature of the interstellar medium (ISM) in elliptical galaxies has undergone a radical change from this consensus that prevailed only a dozen of years ago. Recent advances in instrumental sensitivity across the electro-magnetic spectrum have revealed the presence of a complex, diverse ISM in elliptical galaxies.
The ISM of luminous () elliptical galaxies is generally dominated (in mass) by hot ( K), X-ray-emitting gas (111H0 = 50 km s-1 Mpc-1 is assumed throughout this paper; e.g., Canizares, Fabbiano & Trinchieri [1987]). Relatively small, varying quantities of cool neutral gas (; cf. Lees et al. [1991]; Wiklind, Combes & Henkel [1995]), dust (; e.g., Knapp et al. [1989]; Goudfrooij & de Jong [1995]), and optical nebulosity (; e.g., Buson et al. [1993]; Goudfrooij et al. [1994b]; Macchetto et al. [1996]) have also been detected. Hence, all ISM components known to exist in spiral galaxies are now accessible in elliptical galaxies as well (although in rather different proportions). Unlike the situation in spiral galaxies however, it still remains unclear —and controversial— what the correct description of that ISM is, i.e., what the nature, origin and fate of the different components of the ISM are, and what the dominant process is that dictates the interplay between them.
A number of theoretical concepts have been developed for the secular evolution of the ISM of luminous elliptical galaxies. One of the currently most popular concepts is the “cooling flow” scenario (recently reviewed by Fabian, [1994]): The global dynamics of the hot gas present in X-ray bright elliptical galaxies is controlled by the relative efficiencies of heating and cooling processes. The cooling time of the gas decreases strongly with decreasing radius; in case the heating sources (stellar mass loss; supernova heating) are not strong enough to balance the cooling, a pressure-driven “cooling flow” will occur, in which the gas flows subsonically inward, where it converts into emission-line filaments, cooler gas and/or (low-mass) stars. Typical quoted values for the mass inflow rates derived from the X-ray data are M⊙ yr-1 for giant elliptical galaxies which are not at the centre of clusters (Thomas et al. [1986]), and up to several 102 M⊙ yr-1 for central dominant galaxies in clusters (e.g., Steward et al. [1984]).
An alternative concept is the “evaporation flow” scenario [independently proposed by Sparks, Macchetto & Golombek ([1989]) and de Jong et al. ([1990])] in which clouds of cold gas and dust have been accreted during post-collapse galaxy interactions. In this scenario, thermal interaction between the cool accreted gas and dust and the pre-existing hot gas locally cools the hot gas (thus mimicking a cooling flow) while heating the cool gas and dust, thereby giving rise to optical and far-infrared emission. A prediction of this scenario is that the X-ray-emitting gas distribution should follow that of the optical nebulosity quite closely (Sparks et al. [1989]; de Jong et al. [1990]; Sparks [1992]), and that dust should be associated with the optical nebulosity.
In order to properly assess the appropriateness of either of these two scenarios, it is important to study the relation between the hot and cooler components of the ISM. To date, the study of this relation has been restricted to statistical comparisons between the total H and X-ray luminosities of early-type galaxies detected by the Einstein satellite (Shields [1991]; Trinchieri & di Serego Alighieri [1991] [hereinafter TdSA]; Goudfrooij [1997]; Macchetto et al. [1996]). These studies have produced somewhat ambiguous conclusions, which is most probably due to different observational flux thresholds: Shields ([1991]) found essentially no correlation, whereas TdSA, Goudfrooij ([1997]) and Macchetto et al. ([1996]) found that —on average— galaxies with a larger content of hot gas also have more powerful line emission (often extended, at low surface brightness). However, the scatter in this relation is significant (like most of the correlations that involve X-ray emission), and clearly needs to be better understood.
In order to study the relation between the hot and cooler components of the ISM in detail, high spatial resolution imaging at X-ray and optical wavelengths of X-ray bright, H-emitting early-type galaxies are called for. Here we present the results of such a study for NGC5846, for which a detailed comparison between high spatial resolution X-ray data and optical broad-band and narrow-band CCD imaging has been possible.
2 NGC 5846
NGC 5846 (= UGC9706 = PGC53932) is a giant E0 galaxy (de Vaucouleurs et al. [1991], hereinafter RC3) which dominates a small group of galaxies [group LGG398 of Garcia ([1993])], containing 8 members. NGC5846 contains a compact radio core with a brightness of 20.9 mJy at 20 cm (Möllenhoff, Hummel & Bender [1992]). Einstein observations of NGC5846 have revealed the presence of a large reservoir of X-ray-emitting gas, extending out to kpc (Biermann, Kronberg & Schmutzler [1989]), which is equivalent to about 10 optical effective radii (cf. Bender, Burstein & Faber [1992]). The total mass of hot gas is , and the potential well of the hot gas corresponds to a virial mass of almost , which is very similar to that of M 87, the dominant elliptical of the Virgo cluster (Biermann et al. [1989]). Global galaxy properties of NGC5846 are listed in Table1.
| Parameter | Value | Reference |
| RA(J2000.0) | 15062917 | MHB92 |
| DEC(J2000.0) | +01∘36′ 209 | MHB92 |
| Galaxy Type | E0 | RC3 |
| S01(0) | RSA | |
| 69′′ | BBF92 | |
| 277 km s-1 | D+87 | |
| 11.05 | RC3 | |
| 0.14 | BH84 | |
| 1.03 | RC3 | |
| 0.57 | RC3 | |
| 1822 km s-1 | RC3 | |
| 1595 km s-1 | F+89 | |
| Distance | 31.9 Mpc | * |
| 21.99 | ** | |
Notes to Table1.
Parameters: Effective radius;
central velocity dispersion; Total B
magnitude; Absorption in B band
due to ISM in our Galaxy; ,
Mean colours inside the effective radius;
Heliocentric velocity;
Group velocity; Total
absolute B magnitude, corrected for Galactic absorption.
References:BBF92 Bender et al. (1992);
BH84 Burstein & Heiles (1984);
D+87 Davies et al. (1987);
F+89 Faber et al. (1989); MHB92 Möllenhoff et al. (1992);
RC3 de Vaucouleurs et al. (1991);
RSA Sandage & Tammann (1987); * derived from
; ** derived from and
.
3 Observations and data analysis
We obtained deep CCD images of NGC 5846 on May 28, 1996. We used the 3.5-m New Technology Telescope of the European Southern Observatory (ESO) on Cerro La Silla, Chile. The red arm of the EMMI instrument was used, which operates at f/5.2. The detector was a thin, back-illuminated CCD of type Tektronix TK2048EB Grade 2, having 20482048 sensitive pixels. We employed the “fast” readout mode, featuring a read-out noise of 5.2 e-. The pixel size was m, yielding a scale of 0.27 arcsec per pixel. NGC 5846 was observed through Bessel and filters, with total exposure times of 27 and 18 min, respectively. Multiple exposures were taken to enable easy removal of cosmic radiation events. The seeing was 10 in and 08 in , and the weather was photometric.
3.1 CCD data reduction
We used the ESO MIDAS image processing system for the basic reduction of the CCD images. We co-added 20 “bias” frames to construct a master bias frame which is free of cosmic radiation events and for which the effect of read-out noise is negligible. This master bias frame was subtracted from the science images after having been matched in absolute level, using the serial overscan region of the CCD. The images have been flat fielded using both dome flat fields illuminated by scattered sunlight and twilight sky exposures. The dome flat fields were used to correct for high spatial frequency variations, e.g., pixel-to-pixel variations. The twilight sky exposures were used to correct for the low-frequency spatial variations, since their colour temperature is better matched to that of the science images obtained at night.
Cosmic radiation events in the individual images were removed by an appropriate averaging program. First, the images taken through the same filter were aligned to a common coordinate system, using the centroids of stars in the field of view. This alignment procedure was accurate to within 0.03 pixel. The images were subsequently averaged together by comparing all individual pixel values (per unit exposure time) with the median value over all frames (taken using the same filter). Individual pixels are rejected in the averaging process if their value exceeds the range expected from the (sky + read-out) noise.
3.2 Surface photometry
Ellipses were fitted to the isophotes of the galaxy images using the “ellipse” fitting program in the stsdas.analysis.isophote package, running within the iraf222iraf is distributed by the National Optical Astronomy Observatories, which is operated by the Association of Research in Astronomy, Inc., under cooperative agreement with the National Science Foundation, U.S.A. image processing system. The position angle, ellipticity, and centre of the ellipses were free parameters in the fit, as long as the signal-to-noise was sufficient. The residuals from the fit are parameterized in terms of Fourier coefficients (see Jedrzejewski [1987]). Before the model fits were executed, image pixels occupied by foreground stars and neighbouring galaxies were flagged and ignored in the further analysis. Residual deviant sample points at each fitted isophote were identified (and ignored) using a –sigma clipping algorithm.
The sky background level and its uncertainty was determined by fitting power laws to the outer parts of the model intensity profiles as described in Goudfrooij et al. ([1994a]).
Absolute flux calibration was achieved through observations of standard stars from Graham ([1982]). Care was taken to choose stars with colours similar to elliptical galaxies to eliminate the dependence on colour terms in the calibration. The observations were corrected for atmospheric extinction using the values in the 1993 version of the ESO Handbook (Schwarz et al.), and for Galactic foreground extinction using the value in Burstein & Heiles ([1984]), listed in Table1. We assumed and . These extinction coefficients have been calculated using the standard Galactic extinction curve (e.g., Mathis [1990]) and the filter specifications given by Bessell ([1979]).
After a successful fitting procedure, model images with purely elliptical isophotes were reconstructed from the fit. Model intensities of individual image pixels were reconstructed by a spline fit to the radial intensity profile of the elliptical fit. Subtraction of the model fit from the original image was done as a sanity check of the quality of the fit.
4 Results
4.1 Surface brightness profile
The results of the surface photometry are given in graphical form in Figs.1 and 2. Outside the inner few arcsec where seeing limits any further increase in surface brightness, the radial surface brightness profile of NGC5846 closely follows a de Vaucouleurs ([1959]) law (cf. Fig.1), confirming its RC3 classification as an E0 galaxy. The colour gradient is very small: the colour stays essentially constant out to 40′′ (cf. Fig.2).


4.2 High-order Fourier terms
Fig.2 shows the presence of significant third-order Fourier terms in NGC5846, especially in the inner 10′′, which are more significant in than in . This behaviour is expected in the presence of dust features (see Goudfrooij et al. [1994a]). Also the cos 4 term seems to be influenced by dust. Taking into account the influence of dust, the only significant deviation of the stellar light from pure ellipses seems to be a slightly negative sin 4 component in the inner 5′′, which indicates some excess light at about 675 from the major axis of the galaxy.
4.3 Dust in the central region
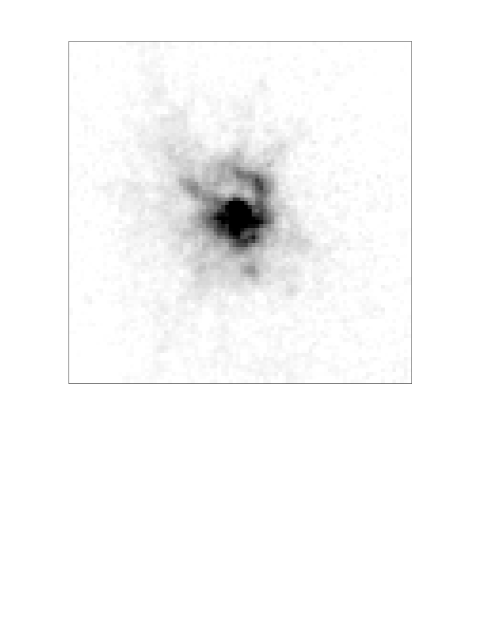
Subtraction of an elliptical model from the galaxy image reveals distinct, filamentary dust features in a “boomerang” shape, reaching out to 12′′ from the nucleus, beyond which they become less obvious to detect. Tentative detections of dust were already reported by TdSA and Buson et al. ([1993]), who however did not pursue any further quantitative investigation and did not have multi-colour imagery. Véron-Cetty & Véron ([1988]) did not find dust in NGC5846.
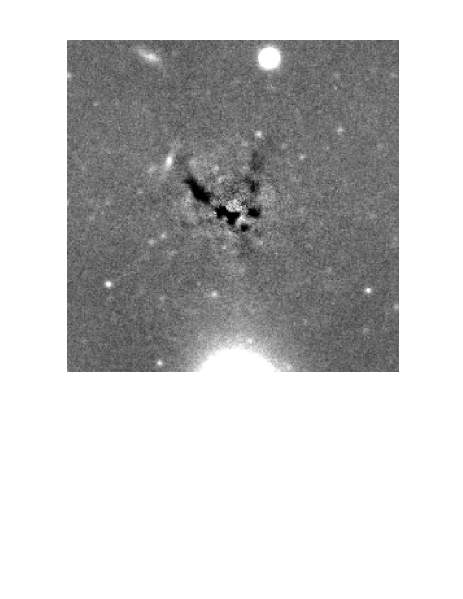
Given the existence of the dust features, we reiterated the ellipse fitting procedure once again, now with the dusty regions flagged and discarded from the fit, so that the fitted ellipses accurately describe the underlying stellar light distribution. A grey scale plot of the residuals of the final fit is shown in Fig.3333Note, however, that this method does not reliably reveal dust features in the inner few seeing disks from the centre.. A qualitative check on the reality of the dust features in the central part () —where the uncertainties in the ellipse fit are arguably largest— is provided by the fact that they are also clearly seen in the HST/WFPC2 image published by Forbes, Brodie & Huchra ([1997]) in their study of the globular cluster system of NGC5846.
5 Properties of the dust in NGC5846
5.1 Extinction curve
To investigate quantitative properties of the dust extinction in NGC5846, we used the final model images to create “extinction” maps,
| (1) |
where is the observed intensity level (of any individual image pixel), and is the intensity level of the purely elliptical model image described above. The image was aligned with the image, and rebinned to a common coordinate system. The uncertainty of the alignment was 0.02 pixel. After slightly smoothing the (rebinned) image to match the seeing of the image, masks were set up covering the regions occupied by dust. Numerical values for and were then extracted within those masks for independent, rectangular boxes, comparable in size to the seeing. The scatter within each box was used (along with the sky background subtraction uncertainty) to estimate the uncertainty associated with these measurements.
A plot of versus of these boxes is shown in Fig. 4, along with models for different extinction curves. As Mathis ([1990]) concluded in his review, the Galactic interstellar extinction curve from the far-IR to the UV is mainly a function of . In Fig. 4 we have drawn the relation between and for = 3.1 (average value for dust in Galactic ISM) and 5.0 (dust in outer clouds of our Galaxy). In addition, we have drawn the extinction curve for = 2.5 as tabulated by Steenman & Thé ([1989]). Low values for such as this —which indicate a relatively low value of the abundance ratio of large grains to small grains— are commonly found in elliptical galaxies with large-scale dust lanes, which is thought to be the result of evolved destruction of dust grains since the time the dust in the rapidly rotating dust lanes was accreted from outside (Goudfrooij et al. [1994c]).
Figure4 shows that the extinction values for the dust in NGC5846 are best fit with the curve for = 3.1, the canonical value for dust in our Galaxy. While these data cannot really dismiss other values of (especially values slightly larger than 3.1), this means that the dust in NGC5846 is consistent with having “normal” Galactic properties. This result holds when taking into account the effect of the presence of foreground stars (see, e.g., Nørgaard-Nielsen et al. [1993]) to the appearance of the extinction curve (cf. Fig. 4). In the scenario of Goudfrooij et al. ([1994c]), this means that the dust in NGC5846 is relatively young (younger than 109 yr), which is consistent with the filamentary structure of the dust lane.

5.2 Mass of dust
The amount of dust can be derived from the values by assuming a grain size distribution as well as a composition of the dust grains (see, e.g., Goudfrooij et al. [1994c]). For a given grain size distribution function where is the grain radius, the cross-section for spherical particles at wavelength can be written as
| (2) |
(see, e.g., Spitzer [1978]), where and represent the lower and upper cutoffs of the grain size distribution, respectively, and is the extinction efficiency at wavelength . The total extinction in magnitudes at wavelength can then be written as
| (3) |
where is the length of the dust column in the line of sight. The dust column density [g cm-2] is
| (4) |
where is the specific grain mass density, which we assume to be 3 g cm-3 (Draine & Lee [1984]; this represents the average of their graphite and silicate grain models). Hence, dust masses can be estimated from the measured values by making sensible assumptions for , , and .
From the available data, we have reason to believe that the dust in NGC5846 is similar to that in our Galaxy (cf. Sect. 5.1). Hence, we assume the grain size distribution to be the Galactic one (, cf. Mathis, Rumpl & Nordsieck [1977])444Note that we only have information about the “large” grains (radius of order 0.1 m) which absorb optical light. Our measurements are not sensitive to extinction by small grains, which has to be studied in the UV.. Using extinction efficiencies for graphite and “dirty silicate” grains listed by Goudfrooij et al. ([1994c]), and assumed equal abundances of graphite and silicate grains (cf. Draine & Lee [1984]), the resulting dust mass is M⊙, where is the distance in units of 31.9 Mpc. Here we assumed that 50% of the stars in NGC5846 are in front of the dust for any given line of sight.
5.3 Temperature of dust; far-infrared emission
Following the methods detailed upon by Goudfrooij & de Jong ([1995]), we have calculated the expected radial dust temperature profile for NGC5846. Being embedded in a luminous X-ray-emitting halo, the dust grains in NGC5846 are heated by two main processes: (i) stellar heating (the “general interstellar radiation field”), and (ii) collisions with hot electrons in the X-ray-emitting gas (Dwek [1986]; de Jong et al. [1990]). We used the surface brightness profiles presented in Sect. 4.1 to derive the radial gradient of the average intensity of optical radiation. As to the heating by hot electrons, we used the radial electron density profile of Trinchieri et al. ([1997]), which was derived from ROSAT HRI images. For the electron temperature we assumed keV which is the average temperature in the arcmin range (Trinchieri et al. [1997]). Dust temperatures were then calculated by equating the heating rates with the cooling rate of a dust grain by infrared emission (see Goudfrooij & de Jong [1995] for further details). The resulting radial dust temperature profiles are presented in Fig.5. The dust temperatures were determined for a grain size of = 0.1 m, and therefore representative of the “large” grains, which absorb optical light. Inclusion of the small grains with radius m, which are stochastically heated to high temperatures (e.g., Dwek [1986]), can in principle raise the average grain temperature somewhat, especially in a case where the grain size distribution includes a relatively substantial amount of small grains. However, we believe that this is not the case in X-ray bright ellipticals such as NGC5846, for the following reasons: (i) the sputtering time for small grains in a hot gas with K is extremely short, e.g., yr for grains of radius 0.01 m (cf. Sect.7), so that they will be preferentially removed from the grain size distribution; (ii) the 12 and 25 m IRAS flux densities of giant elliptical galaxies rule out any significant contribution from emission by small grains as they are entirely consistent with the combination of the contributions of stellar (photospheric) and circumstellar dust around late-type stars (cf. Knapp et al. [1992]; Goudfrooij [1994]). Furthermore, the appropriate average value for a grain radius when determining the average grain temperature is that weighted by the contribution of each grain to the infrared emission and hence by the grain volume :
(cf. also Hildebrand [1983]). For a grain size distribution such as the one proposed by Mathis et al. ([1977]; ), we obtain = 0.1 m, the grain size we used to determine the grain temperature.

We have checked whether our derived dust temperature distribution is consistent with the IRAS data on NGC5846 (Knapp et al. [1989]). Assuming a emissivity law at wavelengths m, the IRAS emission from (Galactic) dust is
| (5) |
(cf. Goudfrooij & de Jong [1995]) where is the IRAS flux density in mJy, is the distance of the Galaxy in Mpc, is the dust mass in solar units, is the wavelength in m, and is the dust temperature. We extracted the values of image pixels occupied by dust features. Dust temperatures, and hence IRAS flux densities at 60 and 100 m (cf. Eq. 5) were then calculated for each image pixel, according to their (projected) distance from the galaxy nucleus. The resulting total flux densities are mJy and mJy, which is consistent with the 1 upper limits from IRAS: mJy and mJy (Knapp et al. [1989]).
6 Comparison between different components of the ISM in NGC5846
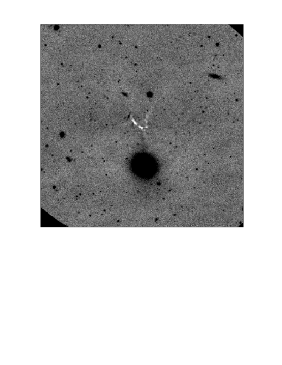
The distributions of dust, optical nebulosity, and X-ray emission in the central 200 200 arcsec of NGC5846 are depicted in Fig.6. The ROSAT HRI map is from Trinchieri et al. ([1997]), and the H+[N ii] map is from TdSA. To suppress noise from the sky background, both of these two maps have been slightly smoothed by convolution with circular Gaussians. The values of were 25 and 03, respectively. The X-ray– and H+[N ii] morphologies have been described in detail before; here we only mention features that are relevant to the discussion in Sect.7 and 8.
6.1 Optical nebulosity vs. X-ray emission
The morphology of the X-ray emission in NGC5846 is highly asymmetric and clumpy relative to that of the stellar (optical) emission (NGC5846 is a very round E0 galaxy). The asymmetry is mostly caused by enhanced emission in the NE quadrant; interestingly, X-ray spectral data from the ROSAT PSPC show that the emission in the NE quadrant is cooler than in the other three quadrants at the same distance from the centre (Trinchieri et al. [1997]). The distribution of H+[N ii] emission in NGC5846 is also rather complex and asymmetric. Filamentary structures are visible at different scales. The most extended filament is pointed towards the NE, where the excess X-ray emission is also situated. All in all, there seems to be a spatial correlation between X-ray and H+[N ii] emission features, strongly suggesting a close physical link between the “hot” and “warm” components of the ISM.
We note that this spatial correlation has also been found in NGC1553 (Trinchieri et al. [1997]) and NGC4696 (Sparks, Jedrzejewski & Macchetto [1994]). All of these three X-ray-emitting ellipticals exhibit X-ray morphologies that are much more clumpy and asymmetric than their smooth optical (broad-band) isophotes.
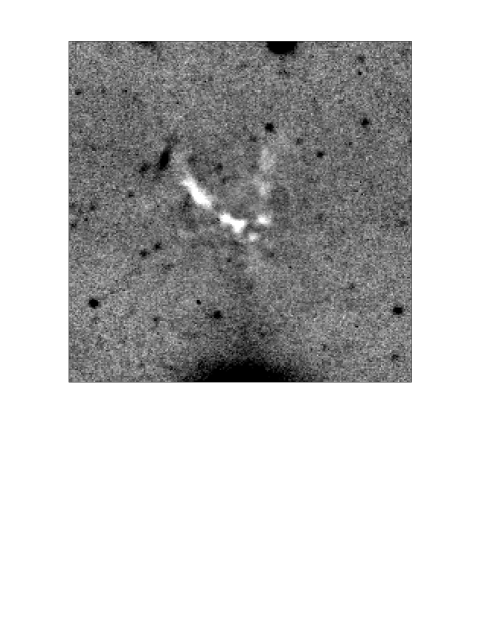
6.2 Optical nebulosity vs. dust absorption
As the dust lane is small compared with the angular dimension of the X-ray emission, we depict the distributions of dust and optical nebulosity in the inner 60 60 arcsec of NGC5846 separately in Fig.7. An important result of this comparison is that the dust lane is associated with the filament system that has the highest H+[N ii] surface brightness in NGC5846. Hints of the other, roughly radially distributed H+[N ii]-emitting filaments (which have lower surface brightness) are visible in the image when inspected on a computer screen (and in the HST/WFPC2 image of Forbes et al. [1997]), but unfortunately hardly recognizable on the grey-scale reproduction in Fig.7. The remaining H+[N ii] emission, which has a significantly lower surface brightness and a more spherically symmetric distribution, does not have an obvious counterpart in the image. This does not imply that the nebulosity at low surface brightness is not associated with dust, since the method used to reveal the dust features (cf. Sect.4.3) is not appropriate for detecting a diffuse distribution of dust.
The finding of dust being associated with optical nebulosity in X-ray bright elliptical galaxies is by no means limited to the case of NGC5846: this association has now been identified in several X-ray bright ellipticals (cf. Jørgensen et al. [1983]; Hansen et al. [1985]; Sparks et al. [1989], [1993]; de Jong et al. [1990]; Goudfrooij et al. [1994b]; Pinkney et al. [1996]). A physical connection between the dust and the optical nebulosity seems to be required to explain this observed association.
7 Origin of dust and ionized gas in NGC 5846
Taken at face value, the mere presence of dust features in the central region of an X-ray bright elliptical galaxy such as NGC5846 is an important finding in the context of assessing the appropriateness of the “cooling flow” and/or the “evaporation flow” scenarios mentioned in Sect. 1, since the local physical conditions are very hostile for dust grains. In the following discussion, we will address implications of the presence of dust in X-ray bright ellipticals to the interpretation of properties of their multi-phase ISM, both specifically for the case of NGC5846 and in a more general sense.
7.1 Cooling flow origin ?
The lifetime of a dust grain of radius against collisions with hot protons and -particles (“sputtering”) in a hot gas with K is
| (6) |
(Draine & Salpeter [1979]; Tielens et al. [1994]), which is typically of order only 107 yr for grains of radius 0.1 m in the central few kpc of X-ray bright ellipticals such as NGC5846 (and proportionally shorter for smaller grains). Hence, any matter that condenses out of a “cooling flow” in the central regions of early-type galaxies is very likely to be devoid of dust. This is illustrated by e.g., the finding that the intergalactic medium within the Coma cluster is depleted in dust by a factor of 140 with respect to the Galactic dust-to-gas ratio (Dwek et al. [1990]).
The cooling gas is also unlikely to generate dust internally: While pressures in the central regions of a cooling flow ( cm-3 K) are high compared with typical pressures in the diffuse ISM in our Galaxy, they are still significantly lower than those of known sites of grain formation such as the atmospheres of red giant stars ( cm-3 K; Tielens [1990]).
7.2 Stellar mass loss ?
Dust and gas are continuously injected into the ISM of early-type galaxies by red giant winds and planetary nebulae at a rate
| (7) |
where is the stellar density (typically of order 10-21 g cm-3 in the galaxy centre), and is the specific rate of stellar mass loss ( s-1, essentially insensitive to the stellar IMF in the case where the bulk of the stars were formed in a coeval instantaneous burst, cf. Mathews [1989]). The evolution of internally produced dust in a hot, X-ray-emitting environment has been studied by Tsai & Mathews ([1995], [1996]) who found that the vast majority of dust grains at any galactocentric radius have been introduced at that same radius, due to the steep radial gradients of stellar and gas density and thus dust lifetime. The gas and dust ejected from stars are expected to merge essentially instantaneously with the hot gas (on time scales 10 yr, Mathews [1990]), where it is subject to rapid erosion by sputtering.
The continuous dust injection rate of Eq. (7) amounts to M⊙ yr-1 for the central 15′′ of NGC5846 ( 2 kpc; = 13.16). In a Hubble time, one would then accumulate 104 M⊙ of internally produced dust, taking into account the short sputtering time scale for grains in that region (cf. Tsai & Mathews [1996]). Although this is equal (to within the uncertainties) to the mass in the dust features (cf. Sect. 5.2), we have strong doubts that the observed dust features are of internal origin. If that were the case, it is easy to show that dust features similar to these would be easily observed in the central kpc of each and every nearby luminous elliptical. Although dust has been optically detected in a large fraction of giant ellipticals, the mass of such dust certainly does not correlate significantly with global properties of the galaxies (Goudfrooij et al. [1994b]; van Dokkum & Franx [1995]). It seems more probable that the gas and dust injected by evolved stars into the hot gas generally ends up in a more diffuse distribution, thus not easily detectable by optical means. Brighenti & Mathews ([1996]) studied the evolution of internally produced gas as a function of total angular momentum of the stellar system, and found that when a small but typical amount of galactic rotation is introduced, this gas will be deposited in a large disk extending out to an effective radius or beyond.
7.3 Accreted during galaxy interaction ?
A simple explanation for the asymmetric morphology of the main dust feature, which accounts for the presence of both dust and gas (as well as their physical association), is that the dust and gas represent the debris of material that has been accreted or tidally stripped from a small neighbouring galaxy. Comparison of the observed filamentary but essentially coherent structure with recent model calculations of the formation of dust lanes or rings in galaxies (e.g., Steiman-Cameron & Durisen [1988], [1990]; Christodoulou & Tohline [1991]) shows that the accretion event must have occurred recently, yr ago, depending on the orientation of the in-falling galaxy with respect to the equatorial plane of the giant elliptical. In this respect, it is tempting to identify the extended H+[N ii]-emitting filament (pointing toward the NE) with a tidal feature which might reflect the original direction from which the small galaxy was accreted. Kinematic information from deep H+[N ii] spectroscopy would obviously shed more light on the nature of this filament.
7.3.1 Constraints on the nature of the donor galaxy
If a galaxy interaction has indeed taken place, the apparent absence of any obvious “stellar” signs of a recent interaction such as “shells” or a secondary nucleus in NGC5846 has to be accounted for.
Shells are quite common among elliptical galaxies, and believed to be stellar remnants of galaxy encounters (see e.g., Prieur [1990]; Forbes et al. [1994], and references therein). Many different model simulations have been put forward to account for the presence and morphology of shells (e.g., major mergers, minor mergers, and weak interactions); however, the simulations typically only covered a small range of parameter space as to the initial conditions and orbital parameters for the interaction. For instance, it remains to be seen how sensitive the formation and evolution of shells is to the nature of the secondary galaxy (e.g., mass ratios, galaxy types). The simulations to date involved strongly nucleated secondary galaxies (bulges, small ellipticals), whereas in-falling irregular galaxies (of Magellanic type) may be expected to disrupt significantly faster (due to dynamical friction) than strongly nucleated galaxies do, which would result in much lower stellar densities in any shells that might still form. Another (rather remote) possibility for not finding shells might be that most of the stars from the secondary galaxy have not yet had time to form shells (i.e., less than a crossing time), but in that case one would expect to see the nucleus of the secondary galaxy (if it was indeed nucleated). All in all, the absence of shells seems to favour a scenario in which the secondary galaxy was not significantly nucleated, e.g., a small irregular galaxy.
The small amount of filamentary dust observed (, cf. Sect. 5.2) also indicates that the secondary galaxy must have been a small satellite. A galaxy similar to the Small Magellanic Cloud (, cf. Schwering 1988, Chap.6) seems to be a good candidate.
8 Discussion
8.1 Survival of the dust
Let us assume for the moment that the dust lane and ionized gas represent remnants of a small, relatively gas-rich galaxy, that has recently been accreted by NGC5846. Adopting the velocity dispersion of the NGC5846 group of galaxies of 150 km s-1 (Garcia 1993) as a typical asymptotic infall velocity, we estimate that an in-falling galaxy crosses the X-ray core of 4.6 kpc diameter in about yr. This provides a lower limit for the life time of the dust in that region unless some form of replenishment is taking place.
How does this compare to the sputtering time scale for dust grains? From the analysis of the ROSAT observations (Trinchieri et al. [1997]), the electron density of the hot gas in the inner 15′′ of NGC5846 (where the dust is observed) is cm-3. From Eq. (6) we obtain a lifetime of yr for grains of radius 0.1 m ( for gas with a cosmic abundance of Hydrogen and Helium). In principle, this time scale is not very much shorter than the crossing time mentioned above, which seems to allow for the possibility that the donor was a small irregular galaxy which originally hosted a few times more dust than that observed at present, of which part of the dust has sputtered away in the mean time. On the other hand, it is at least as likely that (part of) the dust has already spent at least a few crossing times around the nucleus of NGC5846, as evidenced by the multiple filaments of dust and nebulosity. In that case, the remaining dust and gas clouds must have been replenished to maintain the observed dust mass, since the in-falling galaxy cannot have been a large one (cf. Sect. 7.3.1). Note that this latter scenario would be even more likely in case any significant number of small grains would still be present.
8.2 Maintaining the observed amount of dust: Evaporation off cool gas clouds
8.2.1 Cooling vs. evaporation
For the observed dust mass of M⊙, the required dust replenishment rate is yr-1. Our working hypothesis is that this replenishment takes place by evaporation off cool gas clouds brought in during the galaxy interaction, as proposed by de Jong et al. ([1990]). Allowing a reasonable range for the gas-to-dust mass ratio of (the latter being appropriate to the Small Magellanic Cloud, cf. Bouchet et al. [1985]), the dust replenishment rate is equivalent to a gas evaporation rate M⊙ yr-1.
How does this compare with the mass deposition rate derived from the X-ray data? In a steady cooling flow, the mass-loss rate required to support the flow is
(e.g., Thomas et al. [1986]) where is the X-ray luminosity and is the enthalpy of the gas (where is the atomic mass per Hydrogen atom for a gas with cosmic Helium abundance). Using the radial distributions of X-ray flux and electron temperature of Trinchieri et al. (1997), we obtain M⊙ yr-1 for NGC5846, which is entirely consistent with the gas evaporation rate found above.
8.2.2 Properties of evaporating gas clouds
Cold gas clouds embedded in a hot gas are heated by fast-moving electrons. Assuming that the clouds are much smaller than the mean free path of hot electrons (“saturated heat flow”), the heat flow is (Cowie & McKee [1977])
| (8) | |||||
where is the flux of hot electrons (e.g., Spitzer [1978]), is the electron temperature in units of K, and is the electron density in units of 0.01 cm-3. In a gas with a cosmic Helium abundance, 2.3 particles (1.1 nuclei and 1.2 electrons) have to be evaporated (and thus heated to temperature ) per Hydrogen atom. Thus, the evaporative flux is
Inserting cm-3 and K (Trinchieri et al. 1997), we find that in one core crossing time of yr, all clouds with column densities cm-2 will have been evaporated.
This limiting column density of surviving clouds is a few times smaller than the one found by de Jong et al. (1990) for the case of NGC4696, the central cD galaxy in the Centaurus cluster which features dusty filaments in its central regions, with a morphology very similar to the ones in NGC5846. As de Jong et al. showed, this limiting column density is still lower than that of the “marginally stable clouds” of Spitzer ([1968]), which represent clouds whose mass and central density is not quite high enough so as to be destroyed on a free-fall timescale. In conclusion, there is an appreciable range in column density left for gas cloudlets in NGC5846 to have survived until now, but not gravitationally collapsed.
8.2.3 Energy budget for the dust lane
In this section we investigate whether the energy lost by the hot gas in NGC5846 through heating dust grains and evaporating cool clouds in the central 15′′ can be balanced by transport of heat from the outer regions of the hot gas.
Heating of dust grains by hot electrons is a major heat sink of the hot gas. Using the radial grain temperature curves in Sect.5.3, the IRAS 60 and 100 m flux densities of the dust features due to heating by hot electrons alone are found to be = 3.1 mJy and = 10.5 mJy. Using the usual formula for the total far-infrared luminosity from Lonsdale et al. ([1986]),
where and are flux densities in mJy and is the distance in Mpc, we obtain an energy loss due to grain heating of L⊙(cf. Eq. 5). The hot gas also looses energy by evaporating clouds, at a rate
For , this results in L⊙. Thus, the total energy loss of the hot gas in the central 2.3 kpc () radius of NGC5846 is L⊙.
How does this compare with the energy transport into the core of NGC5846 ? The amount of heat transported by electron conduction is
| (9) |
where erg s-1 cm-2 K-3.5 (e.g., McCray & Snow [1979]). The ROSAT data (Trinchieri et al. 1997) show that the electron temperature drops from () keV to () keV over the inner 25. Hence, we find that L⊙ for the whole 25 region, and L⊙ for the central region of 2.3 kpc radius. The uncertainty of these numbers (due to those of the X-ray temperatures) amounts to %.
Kinetic energy of the small infalling galaxy is another —potentially important— heating source for the hot gas (cf. Miller [1986]; Yahil & Ostriker [1973]). The loss of kinetic energy can be estimated as
Inserting M⊙ (a small irregular galaxy), km s-1, and yr, we find L⊙. It seems therefore that the energy losses of the hot gas are quite adequately balanced by heat transport, especially since we have neglected any other heating sources that may be at work, e.g., a modest amount of star formation which may be going on. For instance, the absence of a colour gradient in the inner regions (cf. Sect. 4.1; Forbes et al. 1997) seems to indicate the presence of an age gradient in the sense that the stars are younger in the inner regions than they are outside, because the radial gradient of the Mg2 absorption-line index does indicate a significant metallicity gradient (Davidge [1991]).
8.3 Mass and excitation of nebular emission-line gas
The main properties of the emission-line gas of NGC5846 have been discussed already in TdSA, so that we limit ourselves here to a reconsideration of its properties in the light of the associated dust absorption.
In a situation where gas clouds are continuously evaporating, it is quite plausible that the excitation of the ionized gas is (at least partly) provided by collisions with hot electrons. In this respect it is interesting to compare the heat input from electron conduction with the observed energy emitted by the dusty filaments.
The saturated heat flux (eq. [8]) amounts to 0.012 erg s-1 cm-2 multiplied by the surface area of the filament system. Assuming that the total surface area is three times the projected surface area (corresponding to a 3-D morphology intermediate between a sheet and a sphere), we obtain a total heat flow energy of erg s-1. The far-infrared luminosity of the dust lane is erg s-1 (cf. Sect. 5.3), while the total H+[N ii] luminosity from NGC5846 is erg s-1 (TdSA). For gas temperatures of order 104 K, the cooling curve of Raymond, Cox & Smith ([1976]) indicates that the total radiated emission-line luminosity is 100 times that in H+[N ii] alone (cf. also Ferland & Netzer [1983]). Thus, the total radiated energy from the emission-line filaments is erg s-1. This is strikingly similar to the heat input from electron conduction, which makes this an energetically attractive excitation mechanism for explaining the nebular emission in NGC5846 (and other X-ray bright early-type galaxies, see e.g., Sparks et al. [1989]; Macchetto et al. [1996]). Detailed model computations of the emitted emission-line intensity ratios still need to be carried out, however.
Another viable excitation mechanism of gas in ellipticals is photoionization by hot post-AGB stars within the old stellar population. Binette et al. ([1994]) recently found that post-AGB stars generally provide sufficient ionizing radiation to account for the observed H equivalent widths and luminosities in a sample of 19 elliptical galaxies. Furthermore, more recent correlation studies on the ISM in elliptical galaxies have shown the existence of a strong correlation between the H+[N ii] luminosity and the stellar luminosity within the emitting region, independent of the X-ray properties of the galaxies (Macchetto et al. [1996]; Goudfrooij 1997), which is also quite suggestive of a stellar origin for the ionizing photons. Binette et al. (1994) also showed that the LINER-type emission-line intensity ratios, which are typical of nebular gas in giant ellipticals (e.g., Véron-Cetty & Véron [1986]; Phillips et al. [1986]; Kim [1989]; Goudfrooij et al. [1994b]) are well fit by their photoionization models. In the present case of NGC5846, we have followed the prescriptions of Binette et al. to predict the H flux from photoionization by post-AGB stars. Using model calculations of an aging starburst, Binette et al. estimated the present-day specific ionizing photon luminosity for a population of stars typically found in elliptical galaxies to be 7.3 1040 quanta s-1 M. The total number of ionizing photons () then follows by multiplying this value with the mass of stars inside the H-emitting region. Integrating within the ellipse that encompasses the emitting region, we obtain . Assuming (Binette et al. 1994), we obtain = 1.1 s-1. Assuming case B recombination and complete re-processing of the Lyman continuum photons, we obtain a predicted H luminosity of 1.5 1040 erg s-1. The observed H luminosity is only slightly higher (2.0 1040 erg s-1, cf. TdSA), so that post-AGB stars should also be considered as serious candidates for providing a significant part of the ionizing photons. However, the calculations by Binette et al. assumed the covering factor of the gas to be unity, which is likely to be an overestimate since the gas distribution is much more complex than that of the stellar component, i.e., the gas is not likely to intercept all ionizing photons from PAGB stars within the region outlined by the ellipse that encompasses the emitting region. This suggests that not all of the nebular emission observed in NGC5846 is due to photoionization by post-AGB stars.
The mass of emission-line gas in (elliptical) galaxies can in principle be estimated from H imaging data in case the effective volume occupied by the gas is known. Since this is not well constrained, mass estimates rely on the assumption that homogeneous physical conditions prevail in the gas clouds. The electron density is usually taken to be 103 cm-3, appropriate for the observed [S ii] 6716/6731 doublet ratio in the nuclei of elliptical galaxies (e.g., Phillips et al. [1986]; Kim [1989]; Goudfrooij et al. [1994b]). However, long-slit spectra of extended gas in elliptical galaxies (Goudfrooij, in preparation) reveal [S ii] 6716/6731 doublet ratios that are in the low-density limit (i.e., cm-3; cf. Osterbrock [1974]), which implies that the usual mass estimates are lower limits. In the case of X-ray bright ellipticals such as NGC5846, one can provide a further constraint on the mass of nebular gas by assuming pressure equilibrium with the hot gas, i.e., . Since , the nebular density can be derived from the density of the hot gas. Using the radial X-ray gas density profile of Trinchieri et al. (1997), we obtain cm-3 within , and cm-3 at the outskirts of the observed H+[N ii] emission (). Under the pressure equilibrium assumption, the total mass of nebular gas is 3.0 106 M⊙ (a factor 54 higher than that obtained by using the usual assumption of cm-3). This is similar to the mass of neutral gas in NGC5846 (assuming a reasonable gas-to-dust mass ratio), which implies that the ionized fraction of the gas in ellipticals such as NGC5846 could well be much higher than that usually assumed for ellipticals. If so, the amount of ionized gas which is seen depends critically on the amount of gas present (i.e., not merely on the number of ionizing photons available).
8.4 Concluding remarks
The main conclusions emerging from this study are as follows:
-
–
A filamentary dust lane with a dust mass of 7 M⊙ has been detected in the central few kpc of NGC 5846. The optical extinction properties of the dust features (which are due to the “large” dust grains with radius 0.1 m) are consistent with those of dust in our Galaxy. We do not expect this to be also true for the “small” grains, as they are very quickly destroyed by sputtering in the high pressure, X-ray-emitting gas pervading NGC5846. This can be tested by determining the extinction properties in the UV. The morphology of the dust features are strikingly similar to that observed for the optical nebulosity and the X-ray emission. A physical connection between the different phases of the ISM therefore seems likely. In view of the combination of the filamentary morphology of the dust lane, its close association with the ionized nebulosity, and the inprobability of forming dust in cooling flow condensations, we conclude that the dust as well as the ionized nebulosity most likely originate from a recent interaction with a small, relatively gas-rich galaxy, probably of Magellanic type.
-
–
The lifetime of dust grains in the centre of NGC5846 is shorter than the crossing time of a galaxy through the central 5 kpc of NGC5846 (where the dust is located), which indicates that the dust must be replenished. To be consistent with the observed dust mass, the replenishment rate is 10-3 M⊙ yr-1. We argue that this replenishment can be achieved by evaporation of cool, dense gas cloudlets that were brought in during the interaction. The mass and density of these cloudlets is large enough to have survived evaporation until this time, but does not have to be so large that they are unstable against gravitational collapse and subsequent star formation.
-
–
The energy lost by the hot gas through heating of dust grains and evaporation of cool gas clouds in the central few kpc of NGC5846 is adequately balanced by heat sources: heat transport by electron conduction into the core of the X-ray-emitting gas and loss of kinetic energy of the infalling galaxy. There does not seem to be a need to invoke a “cooling flow” to explain the X-ray observations of NGC5846 (although we cannot firmly exclude that some part of the radial temperature gradient in NGC5846 is due to cooling of hot gas). Detailed studies of the multi-phase ISM in other X-ray bright early-type galaxies should enable one to assess the general applicability of this scenario to X-ray bright ellipticals (that are not at the centres of clusters). This issue will be addressed in future papers in this series.
-
Acknowledgements.
We thank Christian Henkel for a useful discussion, and the referee for a critical reading of the manuscript. This work was initiated while PG was at the European Southern Observatory under Service Contract No. 46975/DMD/96/6661/GWI, the receipt of which is hereby acknowledged. PG is grateful to Phil Crane for the temporary use of his office which allowed us to conduct the data reduction for this project during psychologically hard times. We have made use of the NASA/IPAC Extragalactic Database (NED) which is operated by the Jet Propulsion Laboratory, Caltech, under contract with the National Aeronautics and Space Administration.
References
- 1992 Bender R., Burstein D., Faber S. M., 1992, ApJ 399, 462
- 1979 Bessell M. S., 1979, PASP 91, 589
- 1989 Biermann P. L., Kronberg P. P., Schmutzler T., 1989, A&A 208, 22
- 1994 Binette L., Magris C. G., Statinśka G., Bruzual A. G., 1994, A&A 292, 13
- 1985 Bouchet P., Lequeux J., Maurice E., Prévot L., Prévot–Burnichon M.–L., 1985, A&A 149, 330
- 1996 Brighenti F., Mathews W. G., 1996, ApJ 470, 747
- 1984 Burstein D., Heiles C., 1984, ApJS 54, 33
- 1993 Buson L. M., Sadler E. M., Zeilinger W. W., et al., 1993, A&A 280, 409
- 1987 Canizares C. R., Fabbiano G., Trinchieri G., 1987, ApJ 312, 503
- 1991 Christodoulou D. M., Tohline J. E., 1991, in: “Warped Disks and Inclined Rings around Galaxies”, eds. S. Casertano, P.D. Sackett & F.G. Briggs, Cambridge University Press, Cambridge, p. 122
- 1977 Cowie L. L., McKee C. F., 1977, ApJ 211, 135
- 1991 Davidge T. J., 1991, JRASC 85, 131
- 1987 Davies R. L., Burstein D., Dressler A., et al., 1987, ApJS 64, 581
- 1990 de Jong T., Nørgaard-Nielsen H. U., Hansen L., Jørgensen H.E., 1990, A&A 232, 317
- 1959 de Vaucouleurs G., 1959, Handbuch der Physik 53, 275
- 1991 de Vaucouleurs G., de Vaucouleurs A., Corwin G., et al., 1991, “Third Reference Catalog of Bright Galaxies”, Springer-Verlag, New York (RC3)
- 1979 Draine B. T., Salpeter E., 1979, ApJ 231, 77
- 1984 Draine B. T., Lee H. M., 1984, ApJ 285, 89
- 1986 Dwek E., 1986, ApJ 302, 363
- 1990 Dwek E., Rephaeli Y., Mather J. C., 1990, ApJ 350, 104
- 1994 Fabian A. C., 1994, ARA&A 32, 277
- 1989 Faber S. M., Wegner G., Burstein D., Davies R. L., Dressler A., Lynden-Bell D., Terlevich R. J., 1989, ApJS 69, 763
- 1983 Ferland G. J., Netzer H., 1983, ApJ 264, 105
- 1994 Forbes D. A., Thomson R. C., Groom W., Williger G. M., 1994, AJ 107, 1713
- 1997 Forbes D. A., Brodie J. P., Huchra J., 1997, AJ, in press
- 1993 Garcia A. M., 1993, A&AS 100, 47
- 1994 Goudfrooij P., 1994, Ph. D. thesis, University of Amsterdam, The Netherlands
- 1997 Goudfrooij P., 1997, in: “The Second Stromlo Symposium: The Nature of Elliptical Galaxies”, eds. M. Arnaboldi, G. S. Da Costa and P. Saha, Astronomical Society of the Pacific, San Francisco, p. 338
- 1995 Goudfrooij P., de Jong T., 1995, A&A 298, 784
- 1994a Goudfrooij P., Hansen L., Jørgensen H. E., et al., 1994a, A&AS 104, 179
- 1994b Goudfrooij P., Hansen L., Jørgensen H. E., Nørgaard-Nielsen H. U., 1994b, A&AS 105, 341
- 1994c Goudfrooij P., de Jong T., Hansen L., Nørgaard-Nielsen H. U., 1994c, MNRAS 271, 833
- 1982 Graham J. A., 1982, PASP 94, 244
- 1985 Hansen L., Nørgaard-Nielsen H. U., Jørgensen H. E., 1985, A&A 149, 442
- 1983 Hildebrand R. H., 1983, QJRAS 24, 267
- 1987 Jedrzejewski R. I., 1987, MNRAS 226, 747
- 1983 Jørgensen H. E., Nørgaard-Nielsen H. U., Pedersen H., Rasmussen I.L., Schnopper H., 1983, A&A 122, 301
- 1989 Kim D.-W., 1989, ApJ 346, 653
- 1989 Knapp G. R., Guhathakurta P., Kim D.-W., Jura M., 1989, ApJS 70, 329
- 1992 Knapp G. R., Gunn J. E., Wynn-Williams C. G., 1992, ApJ 399, 76
- 1991 Lees J. F., Knapp G. R., Rupen M. P., Phillips T. G., 1991, ApJ 379, 177
- 1986 Lonsdale C. J., Helou G., Good J. C., et al., 1986, “Cataloged Galaxies and Quasars in the IRAS Survey”, JPL-D-1932, Pasadena
- 1996 Macchetto F., Pastoriza M., Caon N., et al., 1996, A&AS 120, 463
- 1989 Mathews W. G., 1989, AJ 97, 42
- 1990 Mathews W. G., 1990, ApJ 354, 468
- 1990 Mathis J. S., 1990, ARA&A 28, 37
- 1977 Mathis J. S., Rumpl W., Nordsieck K. H., 1977, ApJ 217, 425
- 1979 McCray R., Snow T. P., 1979, ARA&A 17, 213
- 1986 Miller L., 1986, MNRAS 220, 713
- 1992 Möllenhoff C., Hummel E., Bender R., 1992, A&A 255, 35
- 1993 Nørgaard-Nielsen H. U., Goudfrooij P., Hansen L., Jørgensen H. E., 1993, A&A 279, 61
- 1974 Osterbrock D. E., 1974, “Astrophysics of Gaseous Nebulae”, W. H. Freeman & Co., San Francisco
- 1986 Phillips M. M., Jenkins C. R., Dopita M. A., Sadler E. M., Binette L., 1986, AJ 91, 1062
- 1996 Pinkney J., Holtzman J., Garasi C., Watson A.M., Gallagher J.S., et al., 1996, ApJ 468, L13
- 1990 Prieur J. L., 1990, in: “Dynamics and Interactions of Galaxies”, ed. R. Wielen, Springer, Heidelberg, p. 72
- 1976 Raymond J. C., Cox D. P., Smith B. W., 1976, ApJ 204, 290
- 1987 Sandage A. R., Tammann G. A., 1987, “A Revised Shapley-Ames Catalog of Bright Galaxies”, Carnegie Institution of Washington, Washington, D.C.
- 1988 Schwering P. B. W., 1988, Ph. D. thesis, Leiden University
- 1991 Shields J. C., 1991, AJ 102, 1314
- 1992 Sparks W. B., 1992, ApJ 399, 66
- 1989 Sparks W. B., Macchetto F., Golombek D., 1989, ApJ 345, 153
- 1993 Sparks W. B., Ford H. C., Kinney A. L., 1993, ApJ 413, 531
- 1994 Sparks W. B., Jedrzejewski R. I., Macchetto F., 1994, in: “The soft X-ray cosmos”, eds. E. M. Schlegel & R. Petre, AIP Conference Proceedings No. 313, New York, p. 389
- 1968 Spitzer L., 1968, in: “Nebulae and Interstellar Matter, Stars and Stellar Systems Vol. VII”, eds. B. M. Middlehurst and L. H. Aller, Univ. of Chicago Press, Chicago, p. 42
- 1978 Spitzer L., 1978, “Physical Processes in the Interstellar Medium”, Wiley, New York
- 1989 Steenman H., Thé P. S., 1989, Ap&SS 159, 189
- 1988 Steiman-Cameron T. Y., Durisen R. H., 1988, ApJ 325, 26
- 1990 Steiman-Cameron T. Y., Durisen R. H., 1990, ApJ 357, 62
- 1984 Stewart G. C., Fabian A. C., Jones C., Forman W., 1984, ApJ 285, 1
- 1986 Thomas P. A., Fabian A. C., Arnaud K. A., Forman W., Jones C., 1986, MNRAS 222, 655
- 1990 Tielens A. G. G. M., 1990, in: NASA Conference Publication No. 3063, “Carbon in the Galaxy: Studies from Earth and Space”, eds. J. C. Tarter, S. Chang and D. J. DeFrees, NASA, Washington, DC, p. 59
- 1994 Tielens A. G. G. M., McKee C. F., Seab C. G., Hollenbach D.J., 1994, ApJ 431, 321
- 1995 Tsai J. C., Mathews W. G., 1995, ApJ 448, 84
- 1996 Tsai J. C., Mathews W. G., 1996, ApJ 468, 571
- 1991 Trinchieri G., di Serego Alighieri S., 1991, AJ 101, 1647 (TdSA)
- 1997 Trinchieri G., Noris L., di Serego Alighieri S., 1997, A&A 326, 565
- 1995 van Dokkum P. G., Franx M., 1995, AJ 110, 2027
- 1986 Véron-Cetty M. P., Véron P., 1986, A&AS 66, 335
- 1988 Véron-Cetty M. P., Véron P., 1988, A&A 204, 28
- 1995 Wiklind T., Combes F., Henkel C., 1995, A&A 297, 643
- 1973 Yahil A., Ostriker J. P., 1973, ApJ 185, 787